Experimental Errors Uncertainty Objectives Define precision accuracy Understand

Experimental Errors & Uncertainty

Objectives • Define precision, accuracy. • Understand sources of uncertainty where they come from. • Understand sources of random & systematic errors. • Methods to minimize random & systematic errors.

Errors/Uncertainties Mistakes Happen –but there are no small mistakes if you are a civil engineer.

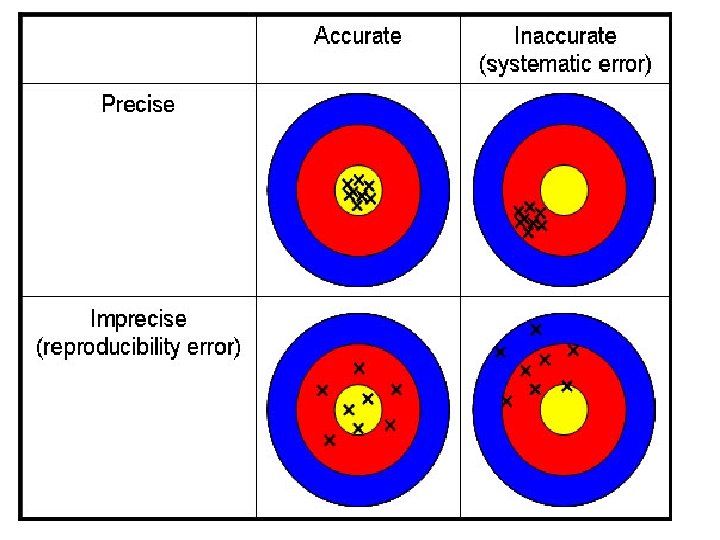
Accuracy • How close average value comes to accepted value. Precision • When repeated measurements are close in value.
 of a")
Typical Sources of Uncertainty in Measurement • Measure the diameter (in cm) of a ball with the ruler. Report your measurement. • Is that the actual diameter? • What are sources of uncertainty? • Measure the width of the index card on the desk in cm. • Which measurement seems more accurate? • Precise?

There is some uncertainty and error in every measurement. • • Why? Limits of measuring device. Experimental procedure/technique. Nature of measurement (too difficult) eg. Speed of light. You may be asked to analyze sources of uncertainty in your experiments and explain how they have affected your results.

What is this measurement? 1. 3 cm The precision of the instrument is 0. 1 cm.

Analog Instruments • Rulers, protractors, analog scales • Report to the smallest or half the smallest measure on instrument. That will be the best you can read. There will be situations where the measure will be much less precise than that.

Digital Instruments • Precision is to the place of the last digit. Cannot Report any more precise. 1. 00 V ± 0. 01 V

Experimental Errors There is always a difference between measured value & actual value. That is why we don’t use fractions to report a measurement! Weight ≠ 220 1/2 lbs. Weight = 220. 5 lbs. No Way! This scale is wrong!

Two types of errors/uncertainty: Random & Systematic • Random – measured values too high and too low. Measured values fall above & below actual. • Caused by fluctuations in temperature, poor reflexes on stopwatch, poor vision, vibrations while measuring, variation in wire thickness.

Do you think: Doing more experimental trials should reduce random error? True

Systematic Error – measured values fall consistently above or below actual values. Examples: • Poor instrument calibration. • Clock runs too fast or slow. • Parallax error s. t. • Balance is above or below zero. • Zero offset error.

Will doing more trials help? • NO. • Only with random error. When systematic error is small, a measurement is said to be accurate. Instrument is well calibrated.

How can we correct systematic error? • Instrument calibration • Better lab technique • Mathematical correction factor.

This graph shows which type of error? Why? Mass Volume

volume This graph shows which type of error? Why? mass m

Which of the following are examples of experimental error? • Misreading the scale on the pan balance. • Incorrectly calculating a value by using the wrong data. • Incorrectly transferring data from your notes into your lab report.

Error & Uncertainty Propagation & Reporting Absolute Error or Uncertainty is the total uncertainty in a measurement reported as a ± with the measurement. Absolute uncertainty. V ± ΔV = (13. 8 ± 0. 2) m. L V falls within 13. 6 – 14. 0 m. L

Absolute Uncertainty show a range 4. 5 kg 0. 1 kg Absolute Uncertainty or Error This says the actual value lies between 4. 4 – 4. 6 kg. The absolute error should be 1 F only. Its place must agree with the measurement’s place. ST called raw unc.

• At minimum it’s the instrument uncertainty. • Usu instrument uncertainty plus other uncertainty sources. Use your judgment but be logical. • Ball radius in drop height. • Meniscus in graduated cylinder.

Instrument Uncertainty • For scales where you can read between 2 divisions, you can report ½ the smallest or the actual smallest measure as your instrument uncertainty (I generally use the smallest increment). • For digital measures just report the smallest unit.

Absolute Uncertainty of Mean • Unc. Shrinks w more trials. • Generally experiment requires a 5 x 5 table. Five trials, Five different values for independent variable. • Take five different drop heights, 5 trials each. Measure the time to hit the ground. Average times. • For set of measurements, absolute uncert: (Max – Min) / 2

1: Given Ball a drop experiment with set of drop times in seconds for 1 height: • • • 0. 23 0. 22 0. 26 0. 34 0. 18 • Find the mean and the absolute uncertainty of the mean. • Proper value = • mean = 0. 246 s • unc. is • (0. 34 – 0. 18)/2 • 0. 08 • 0. 25 ± 0. 08 s
 of the")
Use the metric ruler to measure: • the width (left to right) of the counter in cm. • the depth (front to back) of the counter in cm. • Which is more uncertain? Explain.

2. Adding or subtracting measurements, the total absolute error is the sum of the absolute errors! 2. 61 0. 05 cm 5. 6 0. 1 cm + 2. 82 0. 05 cm - 2. 1 0. 1 cm 5. 4 0. 1 cm Decimal Agreement 3. 5 0. 2 cm

3. Find the perimeter and absolute uncertainty of a rectangular floor measuring 10. 0 ± 0. 3 m by 6. 0 ± 0. 2 m. 10. 0 ± 0. 3 m • Add the sides 32. 0 m = perimeter. • Add the abs uncert. 0. 3 + 0. 2 +0. 2 = ± 1. 0 m. • 32. 0 m ± 1. 0 m. • Round to abs uncert to 1 SF 32 ± 1 m.

4. A protractor is precise to ± 1 o. A student obtains the following measurements for a refraction angle: 45, 47, 46, 45, and 44 degrees. How show he express the refractive angle with its uncertainty? • • • Mean = 45. 4 o. Max – Min = 47 – 44 = 3 o. Half range = 1. 5 o. With rounding: Value = 45 ± 2 o.

Film Clip: The difference of precision and Accuracy Ted 5: 00 Min. • https: //www. youtube. com/watch? v=h. RAFPd. Dppzs

# measurements Graph Accuracy Precision inaccurate, imprecise Accurate, precise Precise, not accurate Accurate, not precise

Error bars show uncertainty on graphs. Line or curve should touch all the bars.

• In class precision & accuracy sheet & IB MC questions.

- Slides: 34