III THE DATA OF MACROECONOMICS 5 Measuring a















- Slides: 83
III THE DATA OF MACROECONOMICS
5 Measuring a Nation’s Income
Microeconomics and Macroeconomics • Microeconomics is the study of how individual households and firms make decisions and how they interact with one another in markets • Macroeconomics is the study of the economy as a whole • Its goal is to explain the economic changes that affect many households, firms, and markets at once CHAPTER 5 MEASURING A NATION’S INCOME
Macroeconomics • Macroeconomics answers questions like these: • Why is average income high in some countries and low in others? • Why do prices rise rapidly in some time periods while they are more stable in others? • Why do production and employment expand in some years and contract in others? CHAPTER 5 MEASURING A NATION’S INCOME
The Role of Data • To see whethere’s a problem, you first need data
The Role of Data • In macroeconomics, data are crucial 1. Data help policy makers see what problems, if any, need to be addressed 2. Data help macroeconomists identify theories that make correct predictions and theories that make incorrect predictions 3. Data often reveal interesting puzzles that macroeconomic theories need to solve CHAPTER 5 MEASURING A NATION’S INCOME
Total Income • Recall that we need to measure the health of an economy • When judging whether an economy is doing well or poorly, it is natural to look at the total income that everyone in the economy is earning CHAPTER 5 MEASURING A NATION’S INCOME
Total Income • We can temporarily enjoy a high standard of living even if total income is low • How? By borrowing from others. • But we can’t keep borrowing forever • At some point we’ll have to repay—with interest—what we’d borrowed • At that point, we will have to repay out of our income • This is why a nation’s standard of living depends heavily on its own total income CHAPTER 5 MEASURING A NATION’S INCOME
Gross Domestic Product • Gross Domestic Product (GDP) is one measure of a country’s total income • There are other measures of total income, but GDP is the most popular measure CHAPTER 5 MEASURING A NATION’S INCOME
Gross Domestic Product CHAPTER 5 MEASURING A NATION’S INCOME
Gross Domestic Product • GDP is the total market value of all final goods and services produced within a country in a given period of time. • GDP is also the total expenditure on all final goods and services produced within a country in a given period of time. • It is also the total income earned from all productive activity in the domestic economy Why “final goods and services”?
“Final” Goods and Services • Final goods are those goods sold to their final users • Final goods are those goods that do not disappear in the process of the production of some other for-sale good • Goods that disappear in the process of the production of some other for-sale good are called intermediate goods
“Final” Goods and Services • A pencil is a final good because, once produced, it is ready for use by its final users • The wood, the graphite, and the other materials that disappeared in the pencil are not final goods • Their market value is counted when the market value of the pencil is counted • So, counting them separately in GDP would be counting them twice
What is Gross Domestic Product (GDP)? • Video: https: //youtu. be/mj. Jmo 5 m. N 5 y. A CHAPTER 5 MEASURING A NATION’S INCOME
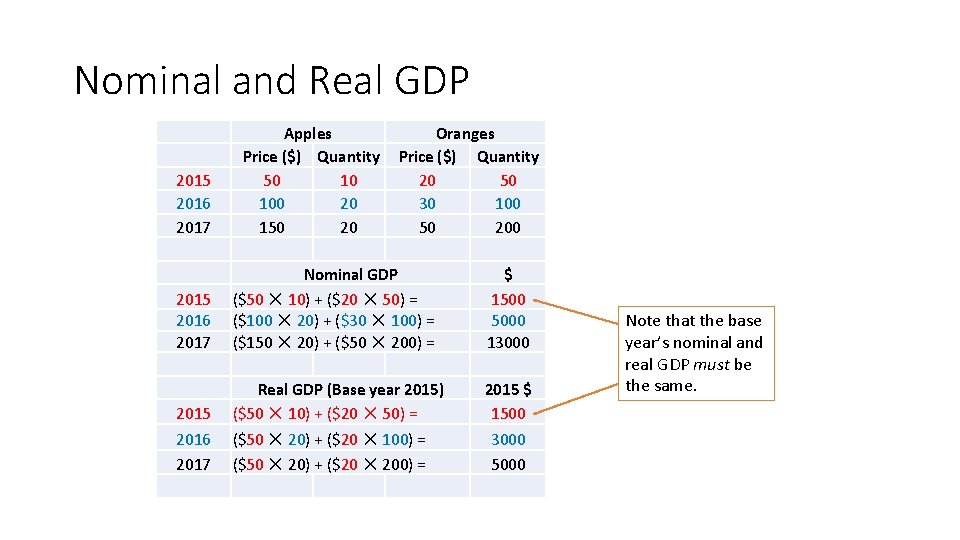
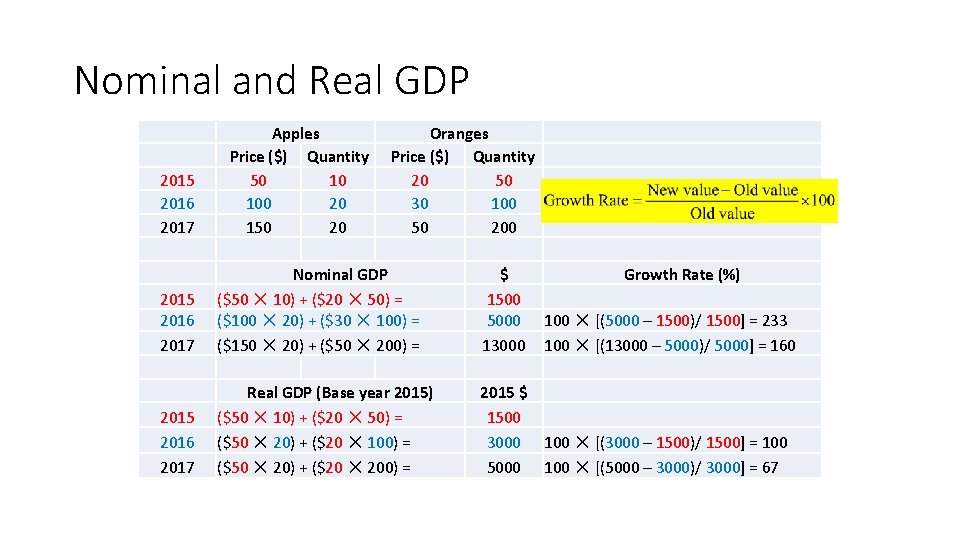
Nominal and Real GDP How can we measure a nation’s productive activity so that the numbers can be compared across time?
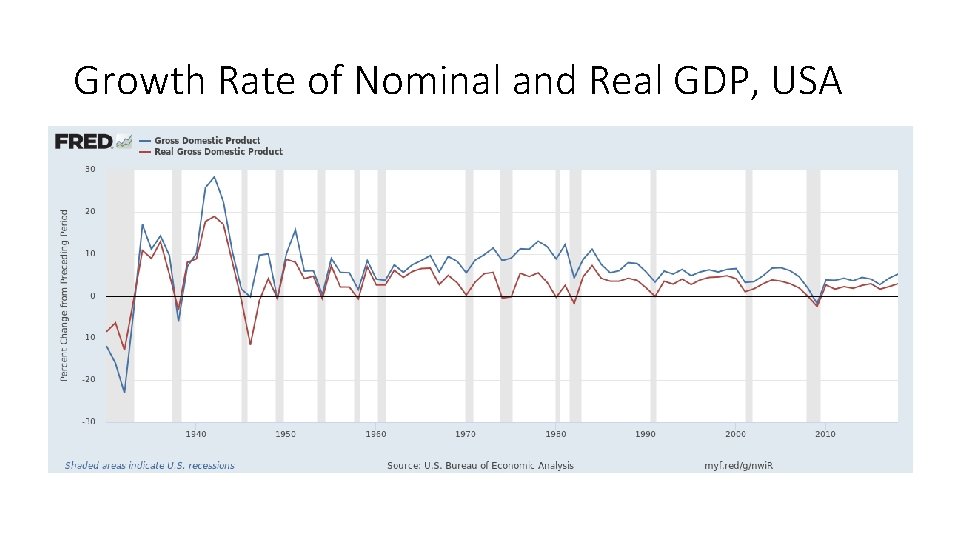
GDP: nominal and real • GDP comes in two flavors: • Nominal GDP (also called GDP at current prices), and • Real GDP (also called GDP at constant prices) • So, when you see or hear a discussion of GDP, be sure to ask, “Nominal or real? ”
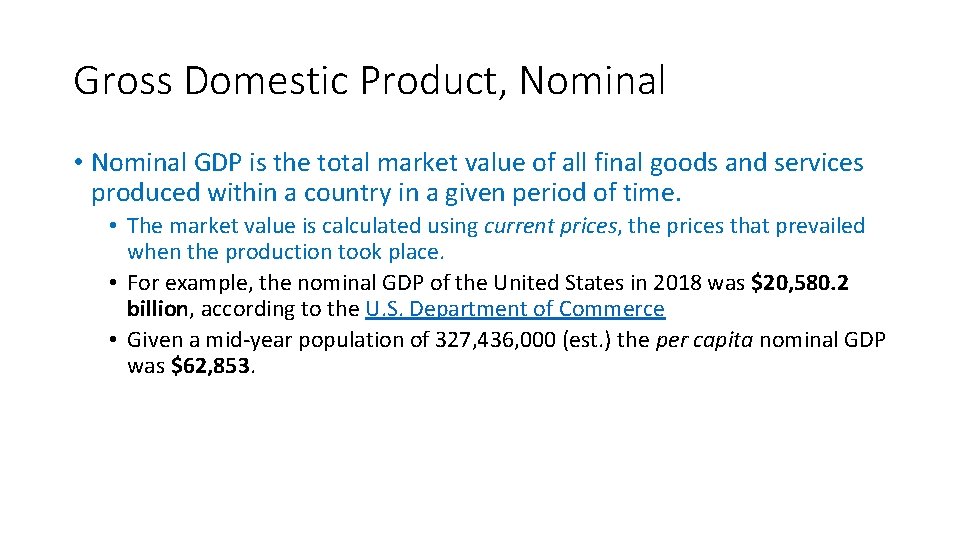
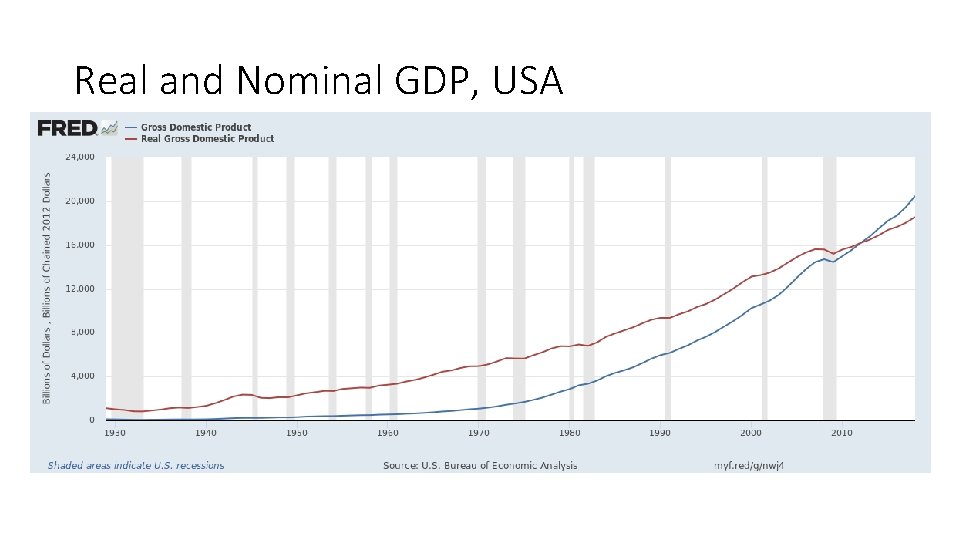
Gross Domestic Product, Nominal • Nominal GDP is the total market value of all final goods and services produced within a country in a given period of time. • The market value is calculated using current prices, the prices that prevailed when the production took place. • For example, the nominal GDP of the United States in 2018 was $20, 580. 2 billion, according to the U. S. Department of Commerce • Given a mid-year population of 327, 436, 000 (est. ) the per capita nominal GDP was $62, 853.
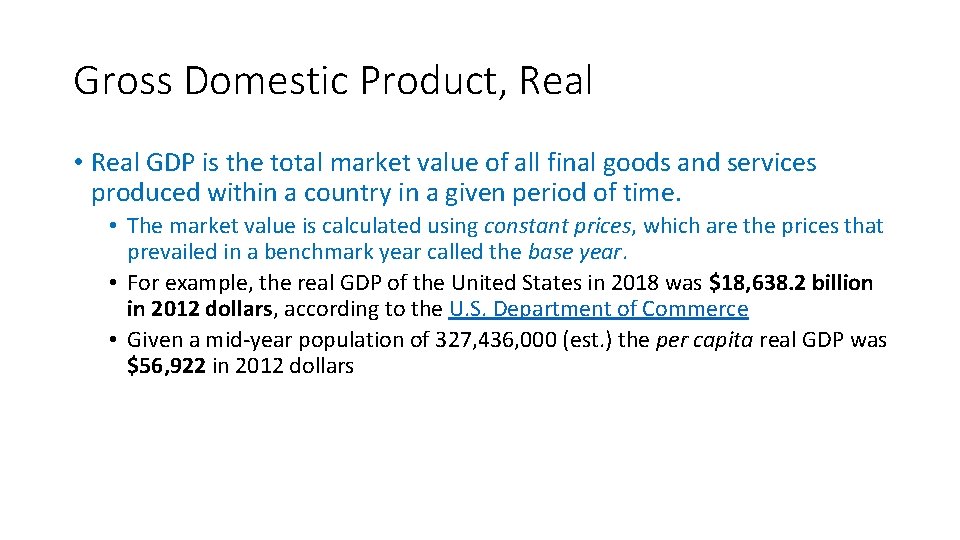
Gross Domestic Product, Real • Real GDP is the total market value of all final goods and services produced within a country in a given period of time. • The market value is calculated using constant prices, which are the prices that prevailed in a benchmark year called the base year. • For example, the real GDP of the United States in 2018 was $18, 638. 2 billion in 2012 dollars, according to the U. S. Department of Commerce • Given a mid-year population of 327, 436, 000 (est. ) the per capita real GDP was $56, 922 in 2012 dollars
Nominal and Real GDP 2015 2016 2017 Apples Price ($) Quantity 50 10 100 20 150 20 Oranges Price ($) Quantity 20 50 30 100 50 2015 2016 2017 Nominal GDP ($50 ✕ 10) + ($20 ✕ 50) = ($100 ✕ 20) + ($30 ✕ 100) = ($150 ✕ 20) + ($50 ✕ 200) = $ 1500 5000 13000 2015 Real GDP (Base year 2015) ($50 ✕ 10) + ($20 ✕ 50) = 2015 $ 1500 2016 2017 ($50 ✕ 20) + ($20 ✕ 100) = ($50 ✕ 20) + ($20 ✕ 200) = 3000 5000 Note that the base year’s nominal and real GDP must be the same.
Nominal and Real GDP 2015 2016 2017 Apples Price ($) Quantity 50 10 100 20 150 20 Oranges Price ($) Quantity 20 50 30 100 50 2015 2016 2017 Nominal GDP ($50 ✕ 10) + ($20 ✕ 50) = ($100 ✕ 20) + ($30 ✕ 100) = ($150 ✕ 20) + ($50 ✕ 200) = $ 1500 5000 13000 2015 Real GDP (Base year 2015) ($50 ✕ 10) + ($20 ✕ 50) = 2015 $ 1500 2016 2017 ($50 ✕ 20) + ($20 ✕ 100) = ($50 ✕ 20) + ($20 ✕ 200) = 3000 5000 Growth Rate (%) 100 ✕ [(5000 – 1500)/ 1500] = 233 100 ✕ [(13000 – 5000)/ 5000] = 160 100 ✕ [(3000 – 1500)/ 1500] = 100 ✕ [(5000 – 3000)/ 3000] = 67
Real and Nominal GDP, USA
Growth Rate of Nominal and Real GDP, USA
Nominal vs. Real GDP • Video: https: //youtu. be/r. Gqh. TQy. Y 6 g 4 CHAPTER 5 MEASURING A NATION’S INCOME
The GDP Deflator How do we come up with one number—that can represent the overall level of prices? CHAPTER 5 MEASURING A NATION’S INCOME
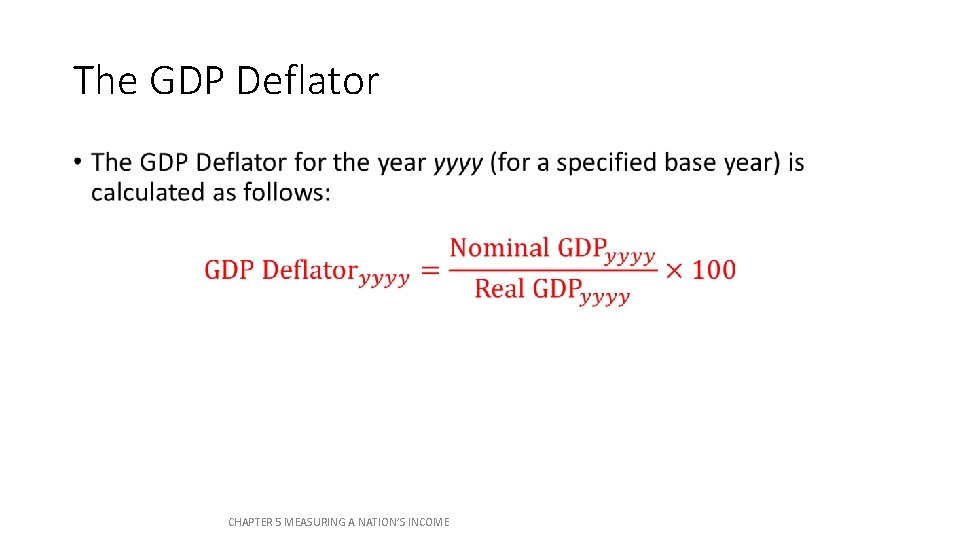
The GDP Deflator • CHAPTER 5 MEASURING A NATION’S INCOME
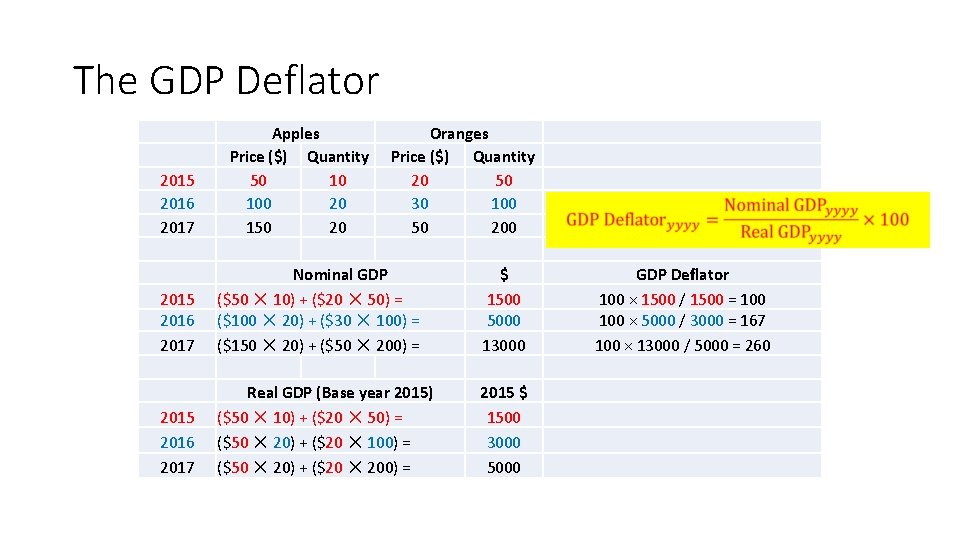
The GDP Deflator 2015 2016 2017 Apples Price ($) Quantity 50 10 100 20 150 20 Oranges Price ($) Quantity 20 50 30 100 50 2015 2016 2017 Nominal GDP ($50 ✕ 10) + ($20 ✕ 50) = ($100 ✕ 20) + ($30 ✕ 100) = ($150 ✕ 20) + ($50 ✕ 200) = $ 1500 5000 13000 2015 Real GDP (Base year 2015) ($50 ✕ 10) + ($20 ✕ 50) = 2015 $ 1500 2016 2017 ($50 ✕ 20) + ($20 ✕ 100) = ($50 ✕ 20) + ($20 ✕ 200) = 3000 5000 GDP Deflator 100 × 1500 / 1500 = 100 × 5000 / 3000 = 167 100 × 13000 / 5000 = 260
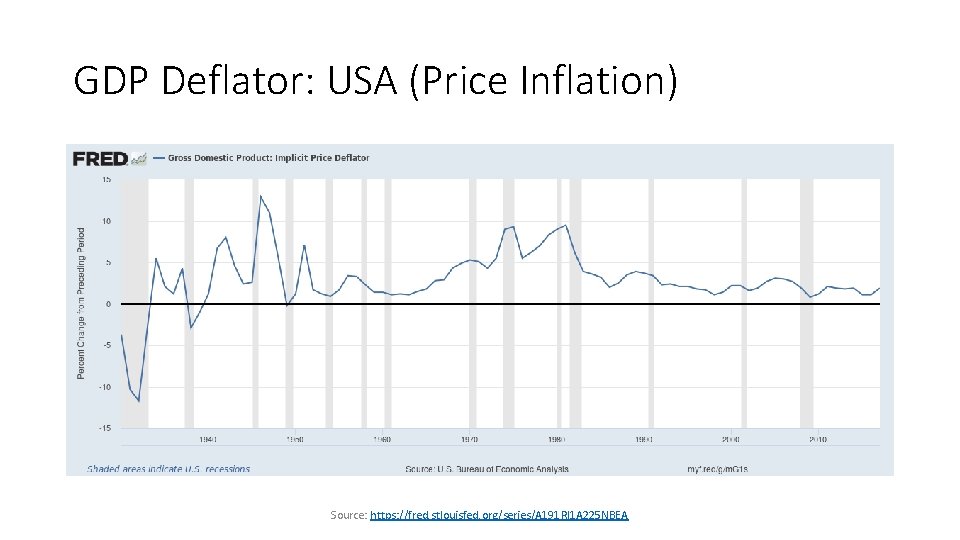
The GDP Deflator • The GDP deflator is a measure of the overall level of the prices of the final goods and services produced within a country during a given period of time • And its growth rate is, therefore, a measure of the rate of inflation. CHAPTER 5 MEASURING A NATION’S INCOME
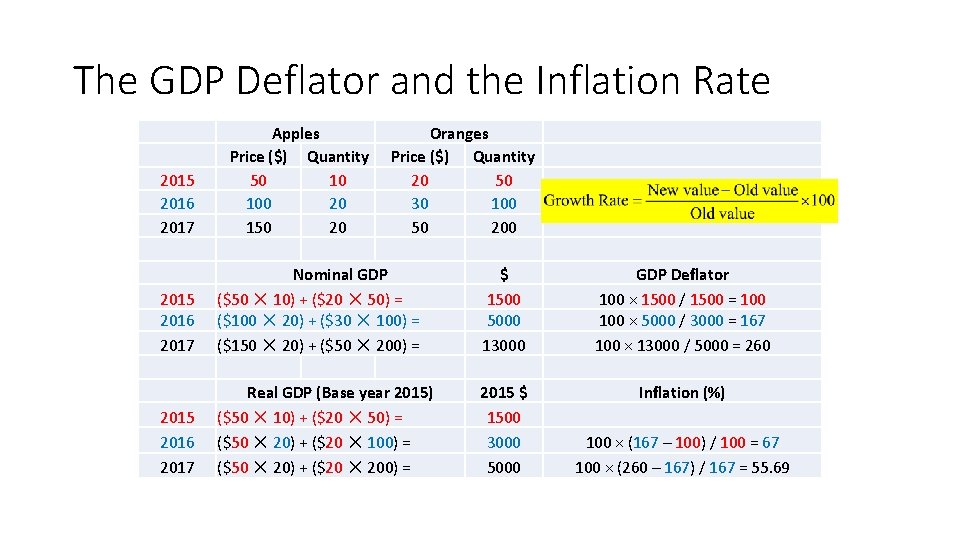
The GDP Deflator and the Inflation Rate 2015 2016 2017 Apples Price ($) Quantity 50 10 100 20 150 20 Oranges Price ($) Quantity 20 50 30 100 50 2015 2016 2017 Nominal GDP ($50 ✕ 10) + ($20 ✕ 50) = ($100 ✕ 20) + ($30 ✕ 100) = ($150 ✕ 20) + ($50 ✕ 200) = $ 1500 5000 13000 GDP Deflator 100 × 1500 / 1500 = 100 × 5000 / 3000 = 167 100 × 13000 / 5000 = 260 2015 $ 1500 Inflation (%) 2015 Real GDP (Base year 2015) ($50 ✕ 10) + ($20 ✕ 50) = 2016 2017 ($50 ✕ 20) + ($20 ✕ 100) = ($50 ✕ 20) + ($20 ✕ 200) = 3000 5000 100 × (167 – 100) / 100 = 67 100 × (260 – 167) / 167 = 55. 69
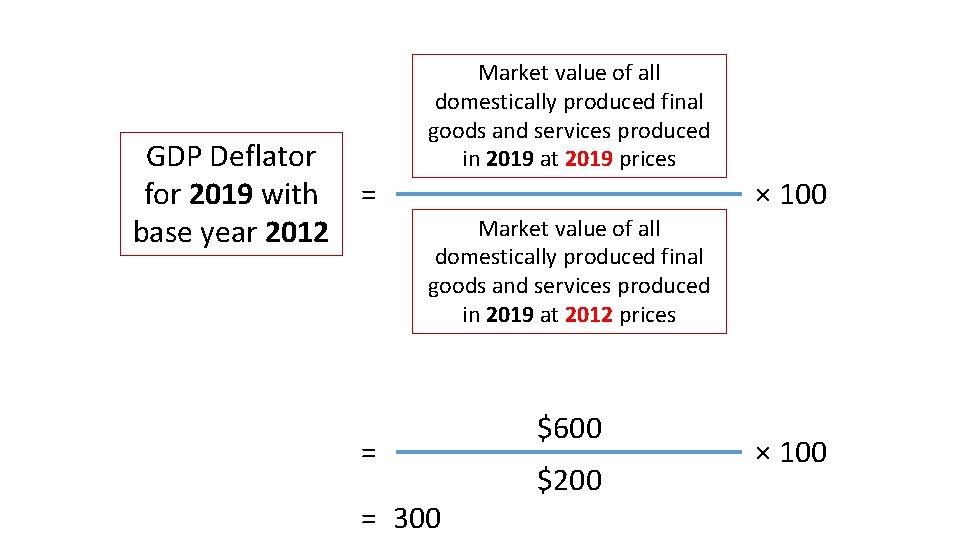
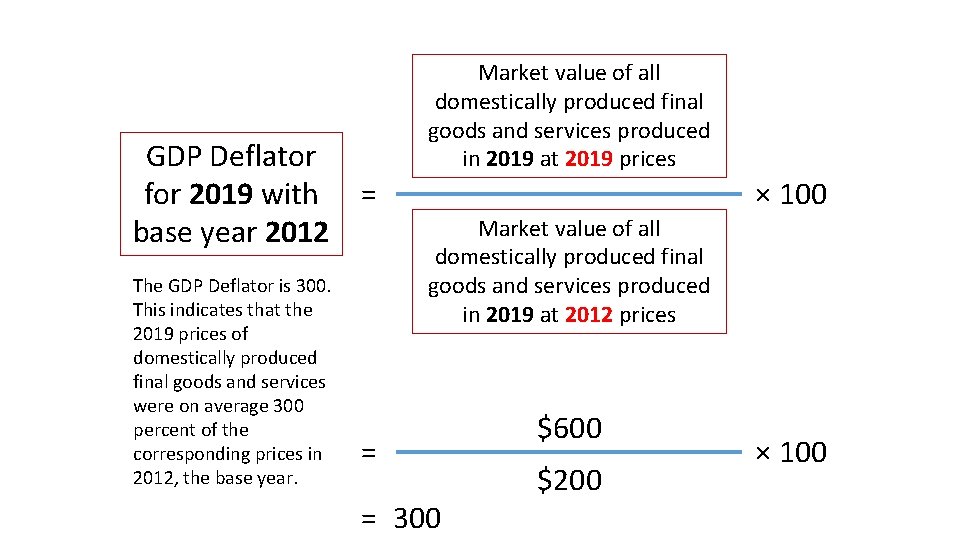
GDP Deflator for 2019 with = base year 2012 Market value of all domestically produced final goods and services produced in 2019 at 2019 prices × 100 Market value of all domestically produced final goods and services produced in 2019 at 2012 prices = = 300 $600 $200 × 100
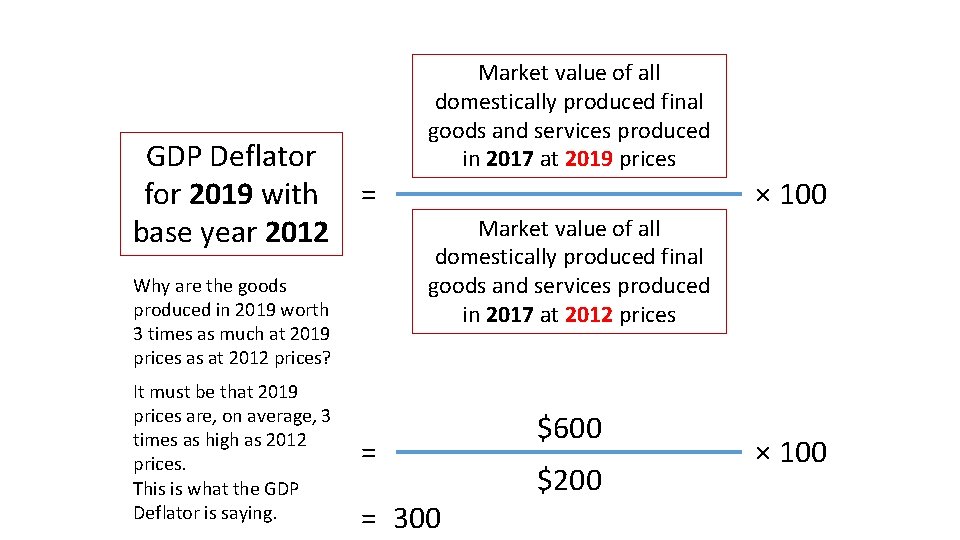
GDP Deflator for 2019 with = base year 2012 Why are the goods produced in 2019 worth 3 times as much at 2019 prices as at 2012 prices? It must be that 2019 prices are, on average, 3 times as high as 2012 prices. This is what the GDP Deflator is saying. Market value of all domestically produced final goods and services produced in 2017 at 2019 prices × 100 Market value of all domestically produced final goods and services produced in 2017 at 2012 prices = = 300 $600 $200 × 100
GDP Deflator for 2019 with = base year 2012 The GDP Deflator is 300. This indicates that the 2019 prices of domestically produced final goods and services were on average 300 percent of the corresponding prices in 2012, the base year. Market value of all domestically produced final goods and services produced in 2019 at 2019 prices × 100 Market value of all domestically produced final goods and services produced in 2019 at 2012 prices = = 300 $600 $200 × 100
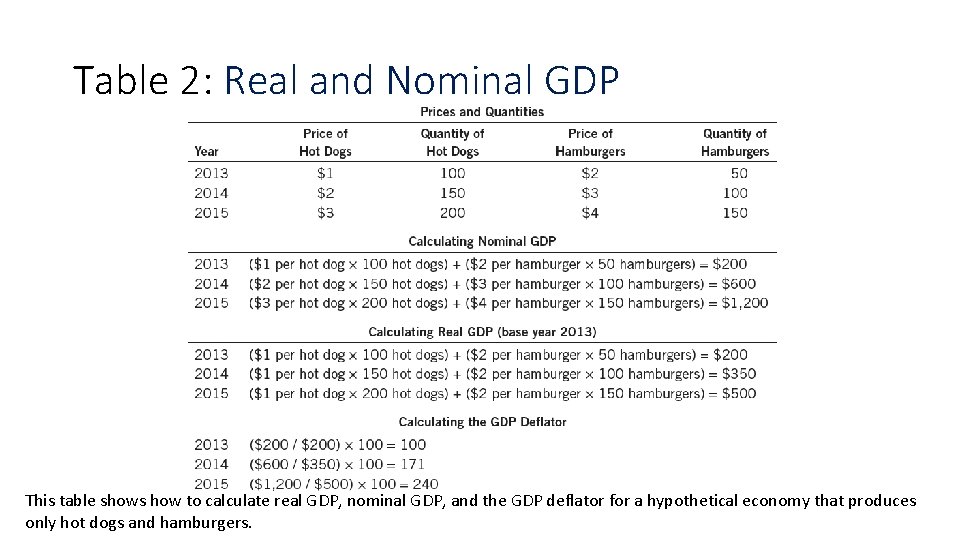
Table 2: Real and Nominal GDP This table shows how to calculate real GDP, nominal GDP, and the GDP deflator for a hypothetical economy that produces only hot dogs and hamburgers.
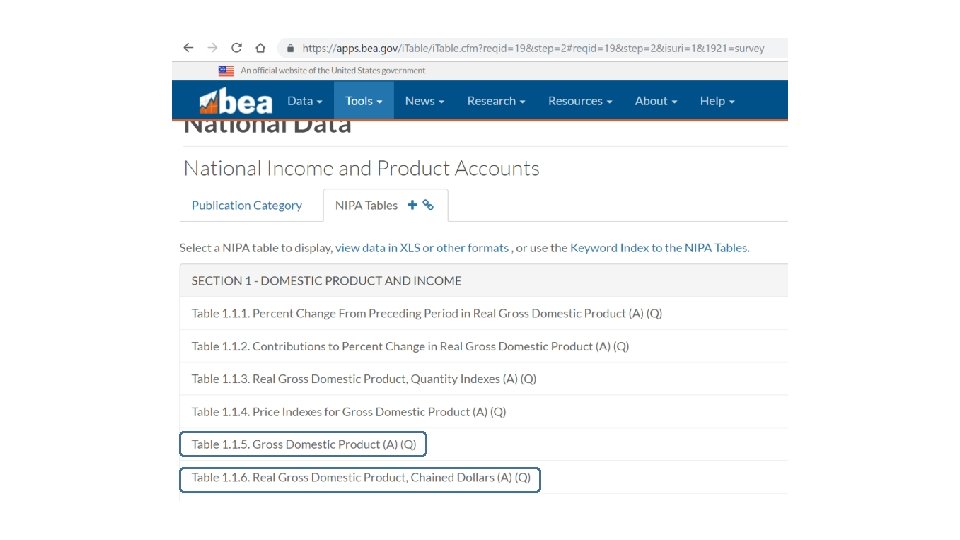
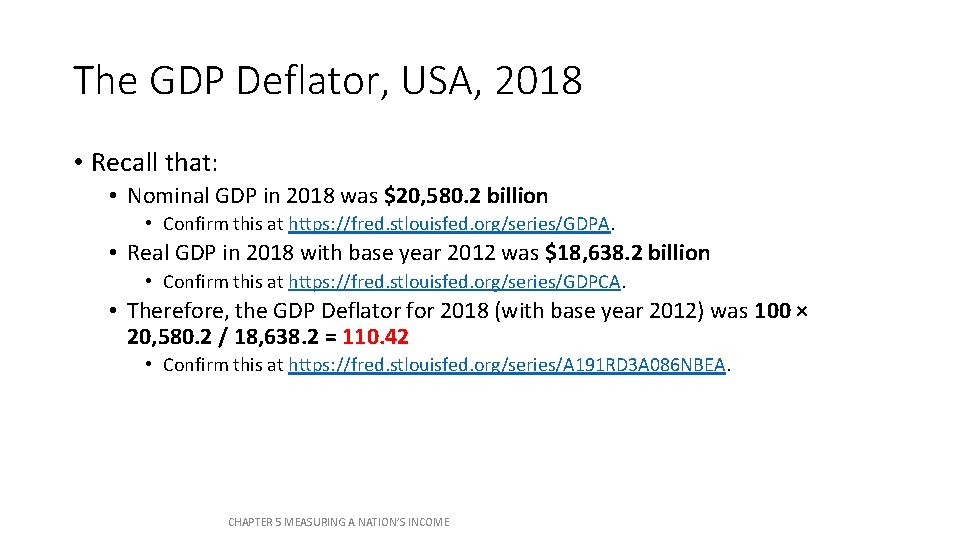
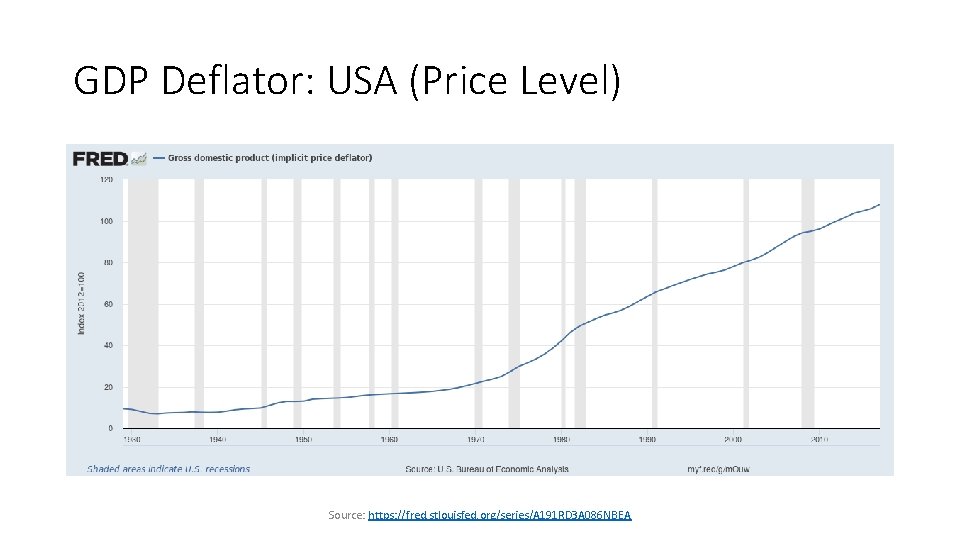
The GDP Deflator, USA, 2018 • Recall that: • Nominal GDP in 2018 was $20, 580. 2 billion • Confirm this at https: //fred. stlouisfed. org/series/GDPA. • Real GDP in 2018 with base year 2012 was $18, 638. 2 billion • Confirm this at https: //fred. stlouisfed. org/series/GDPCA. • Therefore, the GDP Deflator for 2018 (with base year 2012) was 100 × 20, 580. 2 / 18, 638. 2 = 110. 42 • Confirm this at https: //fred. stlouisfed. org/series/A 191 RD 3 A 086 NBEA. CHAPTER 5 MEASURING A NATION’S INCOME
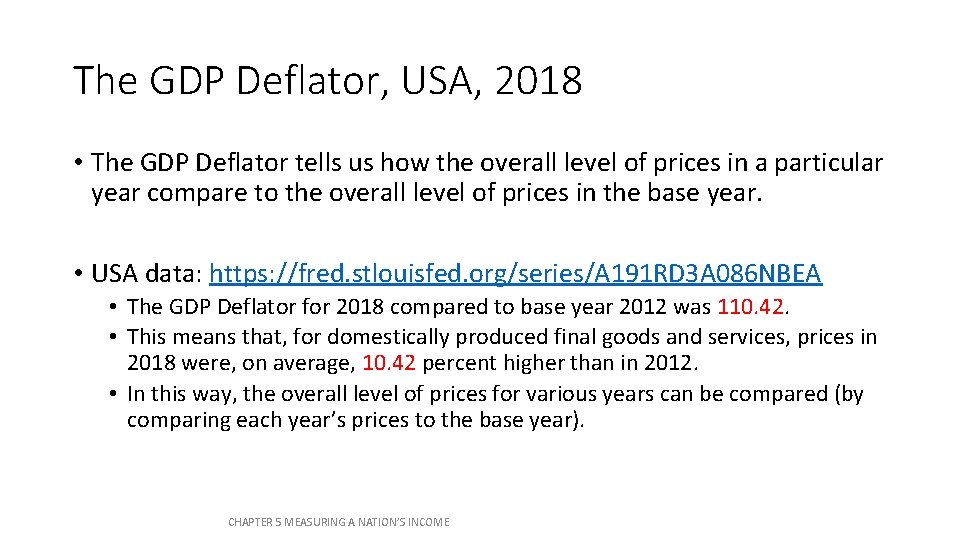
The GDP Deflator, USA, 2018 • The GDP Deflator tells us how the overall level of prices in a particular year compare to the overall level of prices in the base year. • USA data: https: //fred. stlouisfed. org/series/A 191 RD 3 A 086 NBEA • The GDP Deflator for 2018 compared to base year 2012 was 110. 42. • This means that, for domestically produced final goods and services, prices in 2018 were, on average, 10. 42 percent higher than in 2012. • In this way, the overall level of prices for various years can be compared (by comparing each year’s prices to the base year). CHAPTER 5 MEASURING A NATION’S INCOME
GDP Deflator: USA (Price Level) Source: https: //fred. stlouisfed. org/series/A 191 RD 3 A 086 NBEA
GDP Deflator: USA (Price Inflation) Source: https: //fred. stlouisfed. org/series/A 191 RI 1 A 225 NBEA
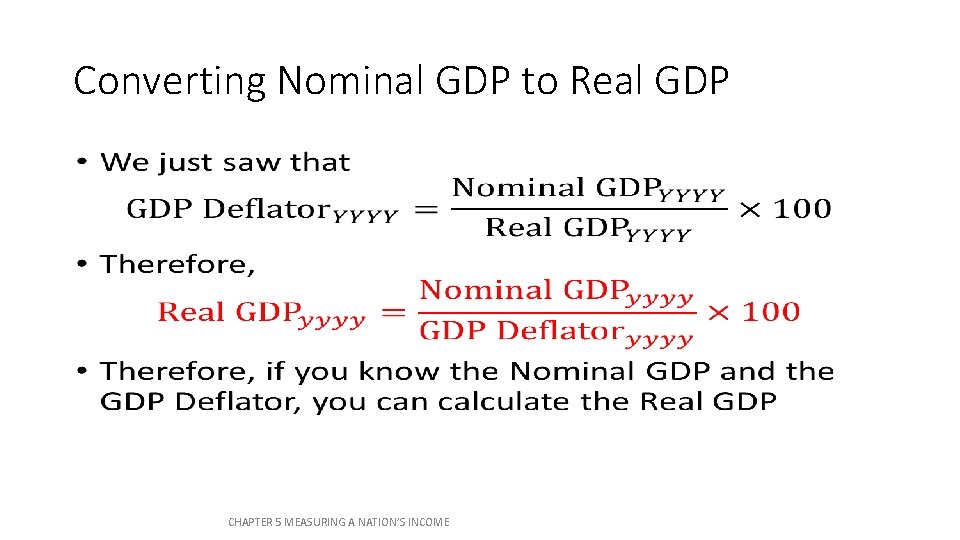
The GDP Deflator • Why call it a deflator? • Nominal GDP changes from one year to the next partly because of inflation • Real GDP, on the other hand, changes because of changes in production alone • The GDP Deflator can convert Nominal GDP to Real GDP by deflating the effect of inflation in Nominal GDP CHAPTER 5 MEASURING A NATION’S INCOME
Converting Nominal GDP to Real GDP • CHAPTER 5 MEASURING A NATION’S INCOME
The Components of GDP CHAPTER 5 MEASURING A NATION’S INCOME
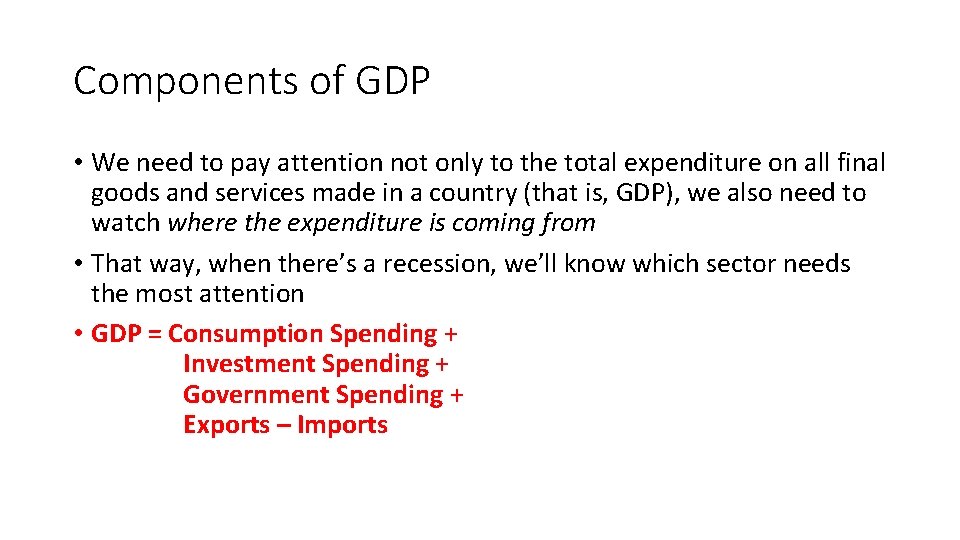
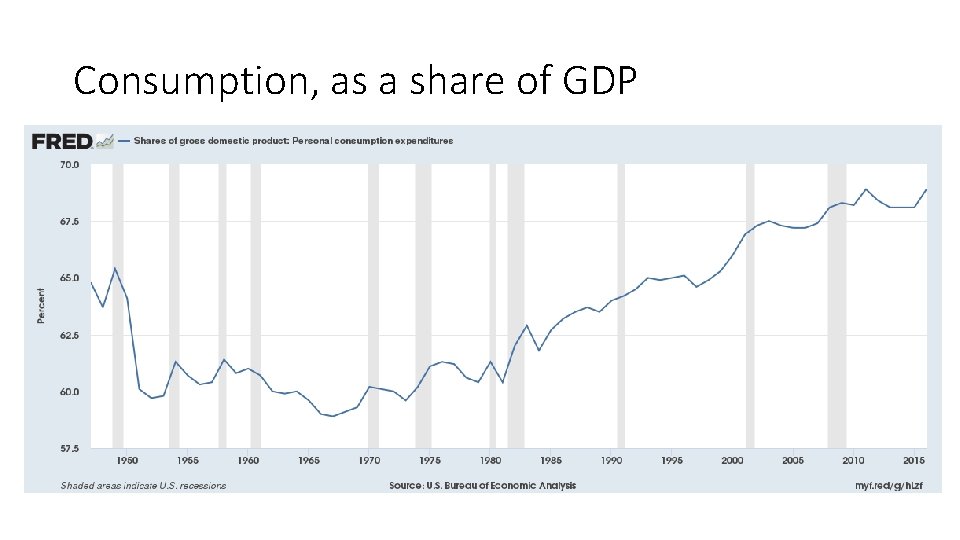
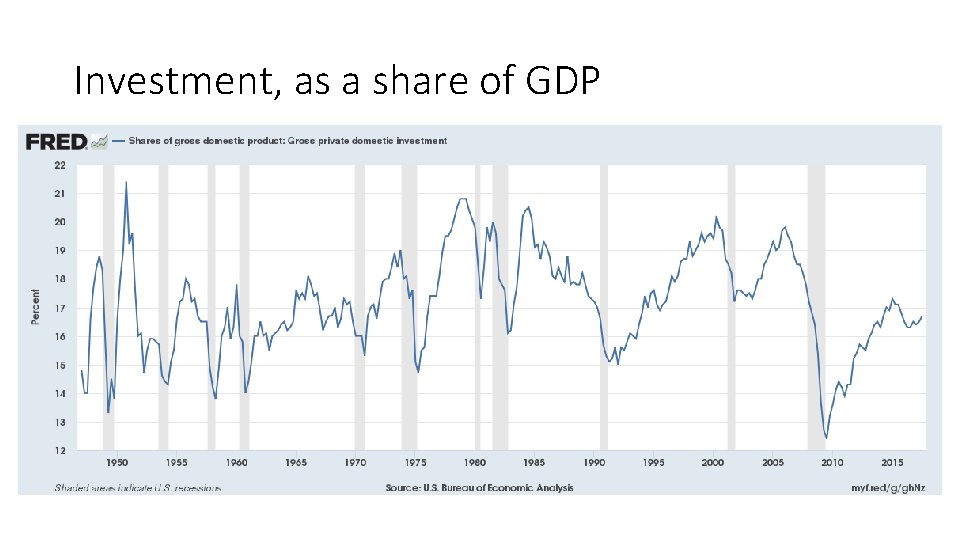
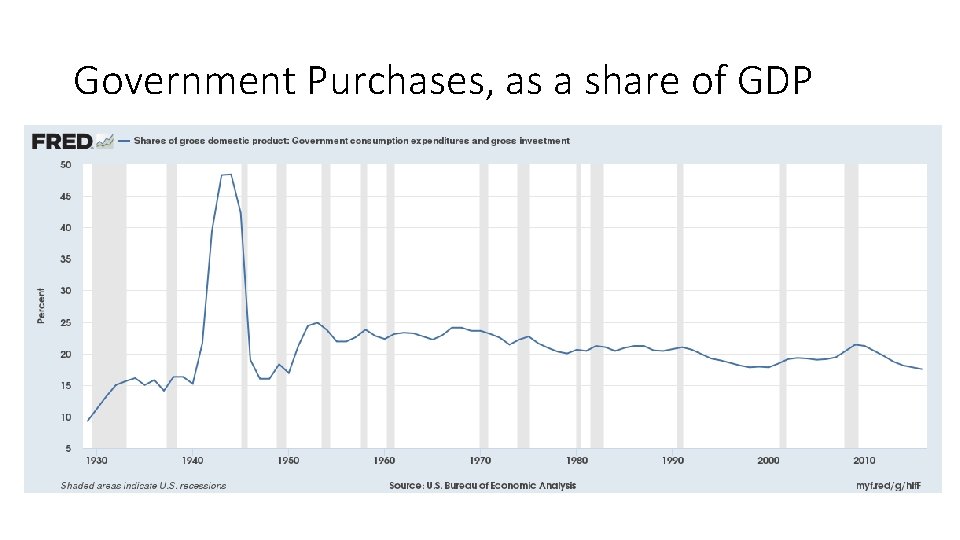
Components of GDP • We need to pay attention not only to the total expenditure on all final goods and services made in a country (that is, GDP), we also need to watch where the expenditure is coming from • That way, when there’s a recession, we’ll know which sector needs the most attention • GDP = Consumption Spending + Investment Spending + Government Spending + Exports – Imports
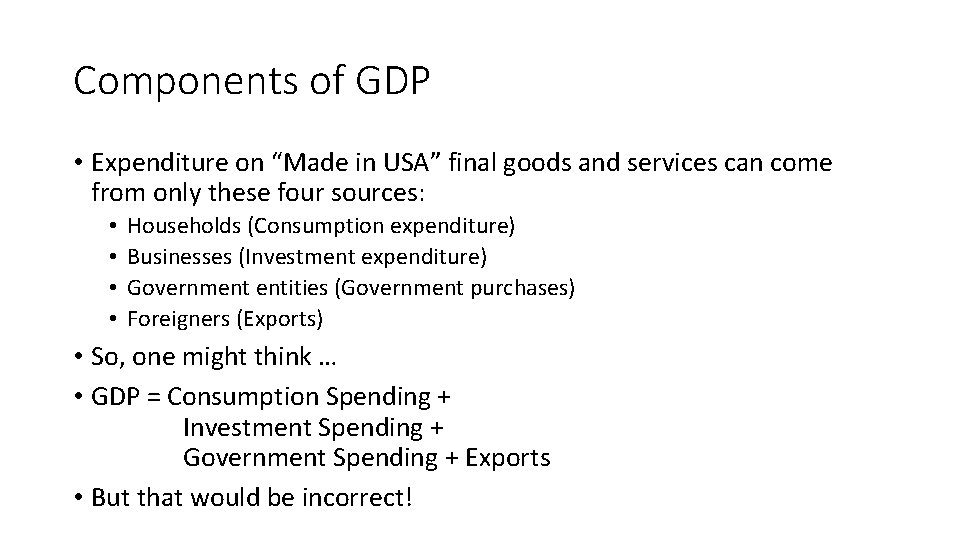
Components of GDP • Expenditure on “Made in USA” final goods and services can come from only these four sources: • • Households (Consumption expenditure) Businesses (Investment expenditure) Government entities (Government purchases) Foreigners (Exports) • So, one might think … • GDP = Consumption Spending + Investment Spending + Government Spending + Exports • But that would be incorrect!
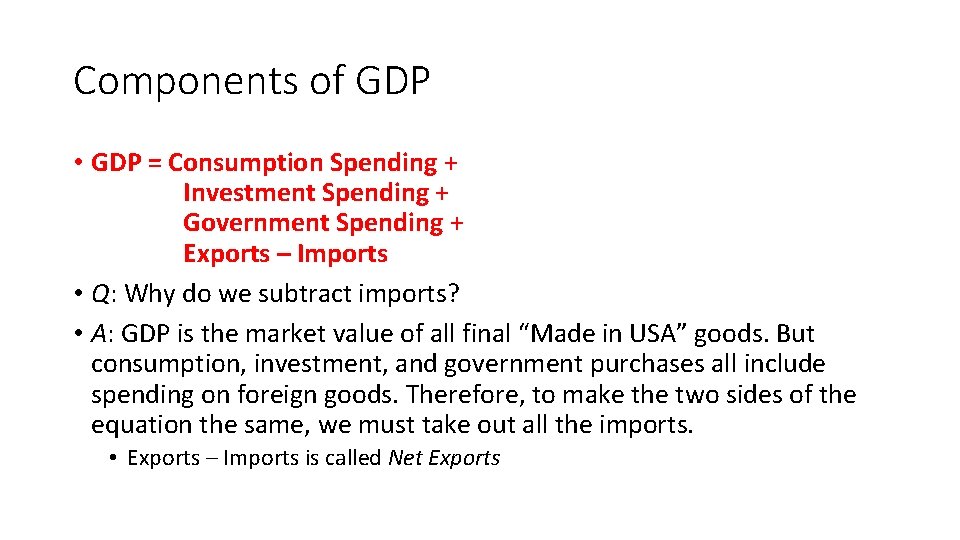
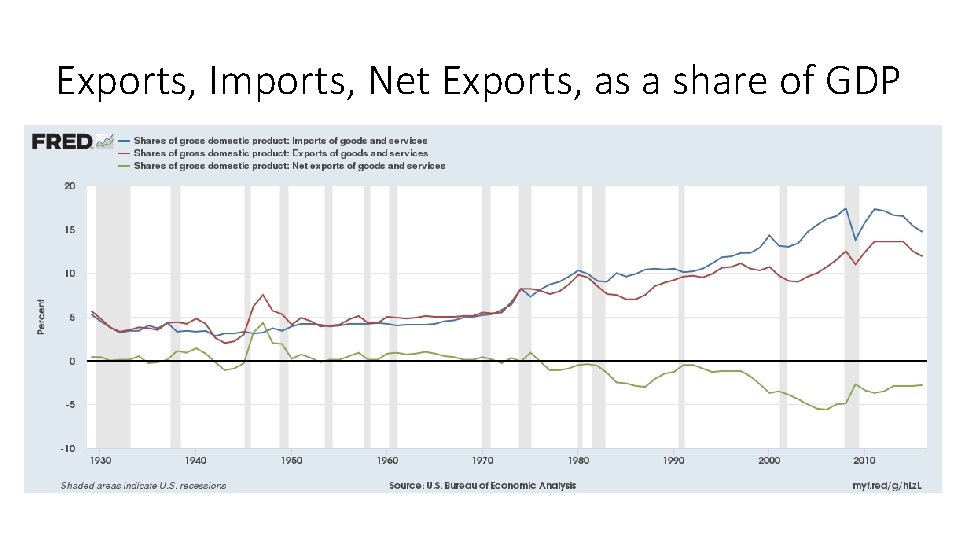
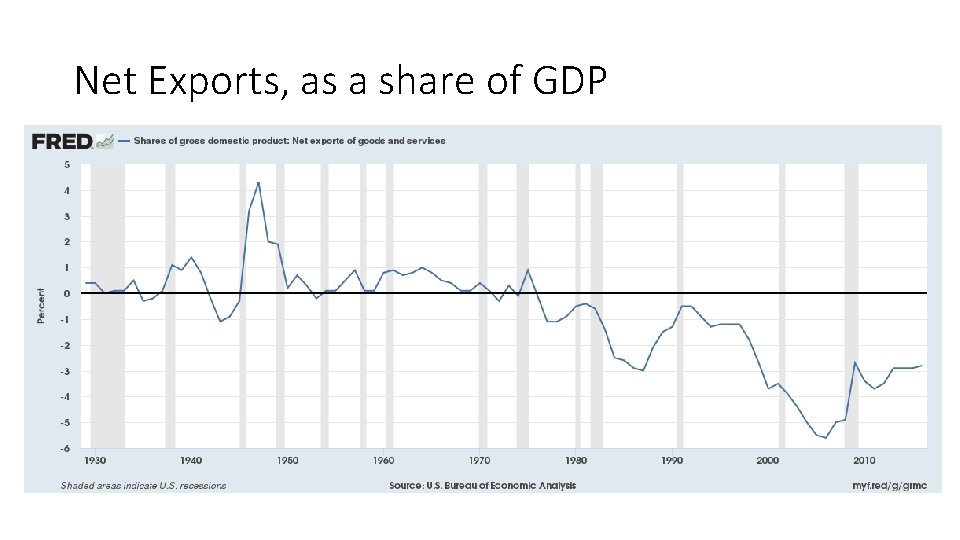
Components of GDP • GDP = Consumption Spending + Investment Spending + Government Spending + Exports – Imports • Q: Why do we subtract imports? • A: GDP is the market value of all final “Made in USA” goods. But consumption, investment, and government purchases all include spending on foreign goods. Therefore, to make the two sides of the equation the same, we must take out all the imports. • Exports – Imports is called Net Exports
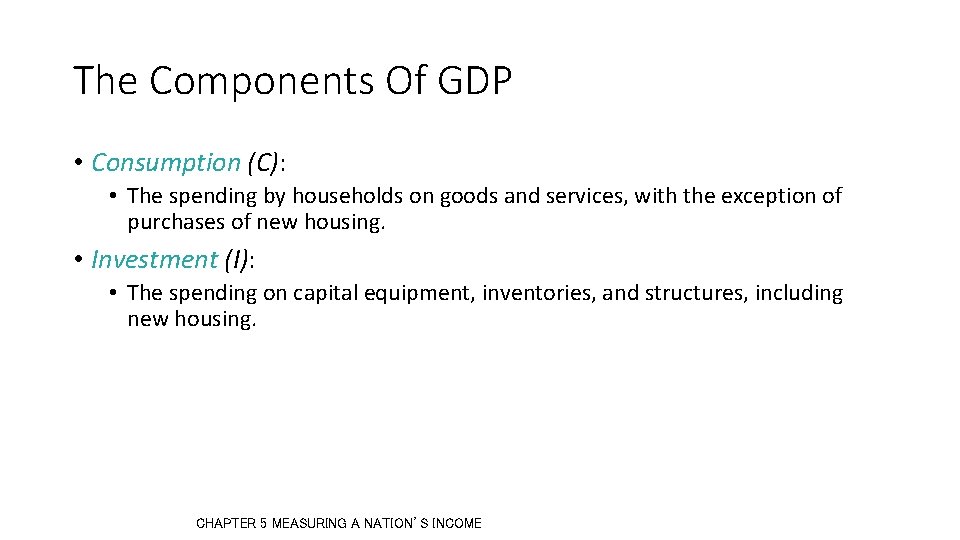
The Components Of GDP • Consumption (C): • The spending by households on goods and services, with the exception of purchases of new housing. • Investment (I): • The spending on capital equipment, inventories, and structures, including new housing. CHAPTER 5 MEASURING A NATION’S INCOME
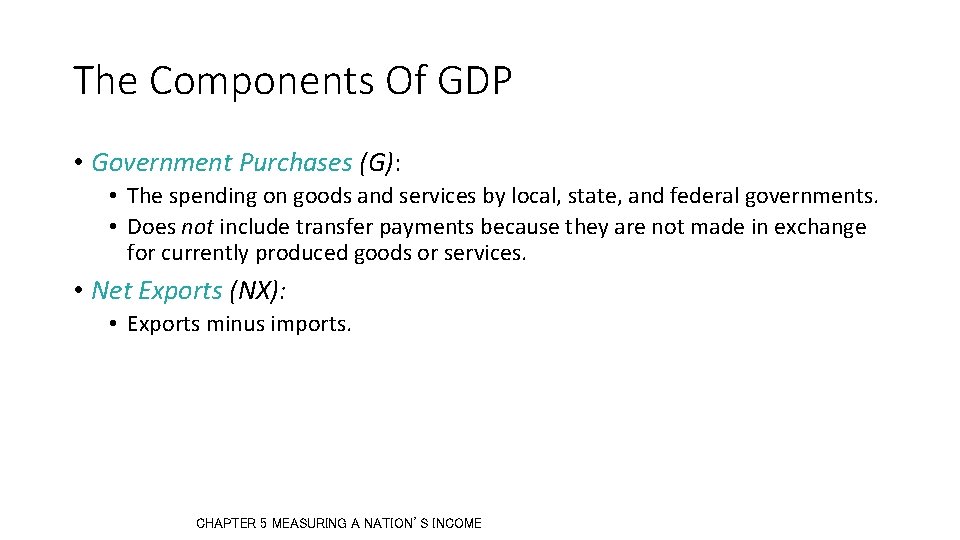
The Components Of GDP • Government Purchases (G): • The spending on goods and services by local, state, and federal governments. • Does not include transfer payments because they are not made in exchange for currently produced goods or services. • Net Exports (NX): • Exports minus imports. CHAPTER 5 MEASURING A NATION’S INCOME
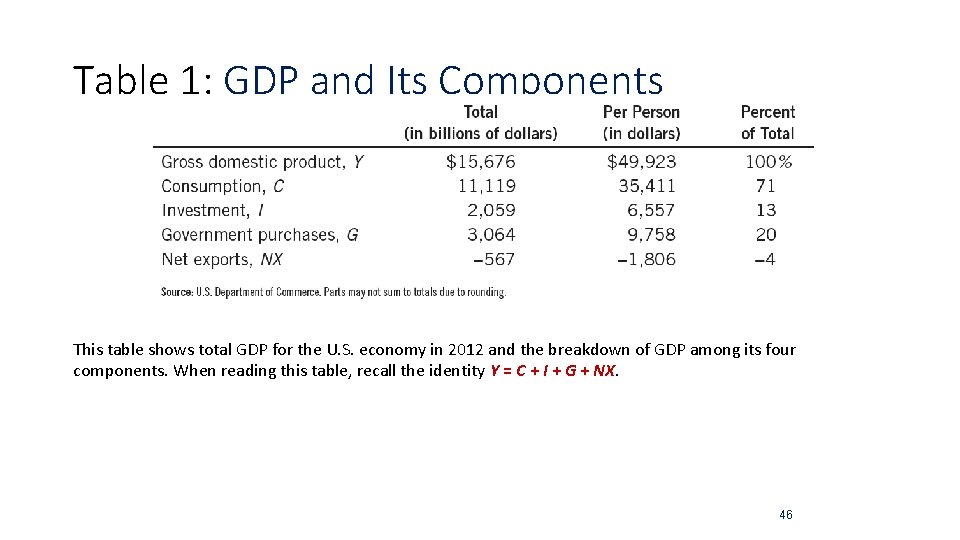
Table 1: GDP and Its Components This table shows total GDP for the U. S. economy in 2012 and the breakdown of GDP among its four components. When reading this table, recall the identity Y = C + I + G + NX. 46
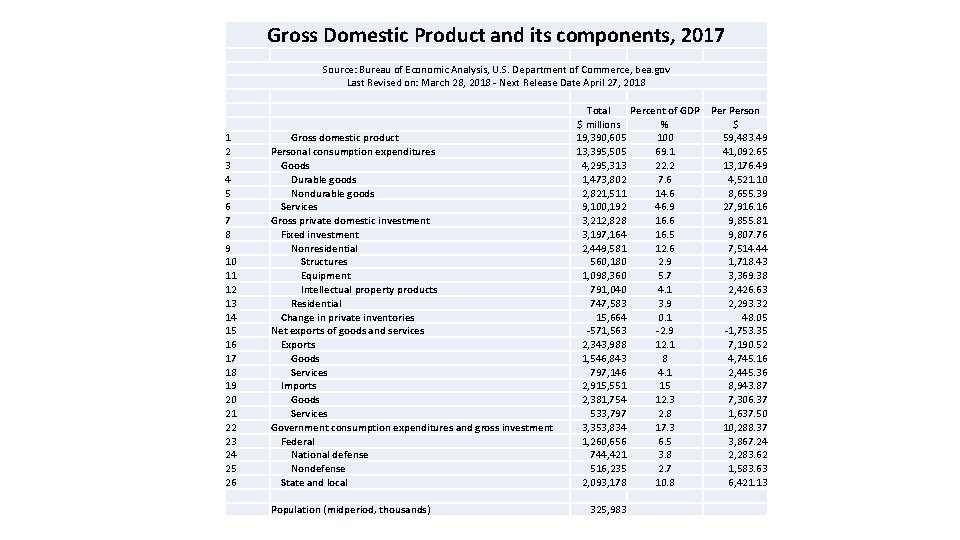
Gross Domestic Product and its components, 2017 1 2 3 4 5 6 7 8 9 10 11 12 13 14 15 16 17 18 19 20 21 22 23 24 25 26 Source: Bureau of Economic Analysis, U. S. Department of Commerce, bea. gov Last Revised on: March 28, 2018 - Next Release Date April 27, 2018 Total Percent of GDP $ millions % Gross domestic product 19, 390, 605 100 Personal consumption expenditures 13, 395, 505 69. 1 Goods 4, 295, 313 22. 2 Durable goods 1, 473, 802 7. 6 Nondurable goods 2, 821, 511 14. 6 Services 9, 100, 192 46. 9 Gross private domestic investment 3, 212, 828 16. 6 Fixed investment 3, 197, 164 16. 5 Nonresidential 2, 449, 581 12. 6 Structures 560, 180 2. 9 Equipment 1, 098, 360 5. 7 Intellectual property products 791, 040 4. 1 Residential 747, 583 3. 9 Change in private inventories 15, 664 0. 1 Net exports of goods and services -571, 563 -2. 9 Exports 2, 343, 988 12. 1 Goods 1, 546, 843 8 Services 797, 146 4. 1 Imports 2, 915, 551 15 Goods 2, 381, 754 12. 3 Services 533, 797 2. 8 Government consumption expenditures and gross investment 3, 353, 834 17. 3 Federal 1, 260, 656 6. 5 National defense 744, 421 3. 8 Nondefense 516, 235 2. 7 State and local 2, 093, 178 10. 8 Population (midperiod, thousands) 325, 983 Person $ 59, 483. 49 41, 092. 65 13, 176. 49 4, 521. 10 8, 655. 39 27, 916. 16 9, 855. 81 9, 807. 76 7, 514. 44 1, 718. 43 3, 369. 38 2, 426. 63 2, 293. 32 48. 05 -1, 753. 35 7, 190. 52 4, 745. 16 2, 445. 36 8, 943. 87 7, 306. 37 1, 637. 50 10, 288. 37 3, 867. 24 2, 283. 62 1, 583. 63 6, 421. 13
Splitting GDP • Video: https: //youtu. be/Chn. Rwedm. O 64 CHAPTER 5 MEASURING A NATION’S INCOME
Consumption, as a share of GDP
Investment, as a share of GDP
Government Purchases, as a share of GDP
Exports, Imports, Net Exports, as a share of GDP
Net Exports, as a share of GDP
Where to find US data • Bureau of Economic Analysis, U. S. Department of Commerce: http: //bea. gov • Federal Reserve Bank of St. Louis: http: //research. stlouisfed. org/fred 2/categories/18 CHAPTER 5 MEASURING A NATION’S INCOME
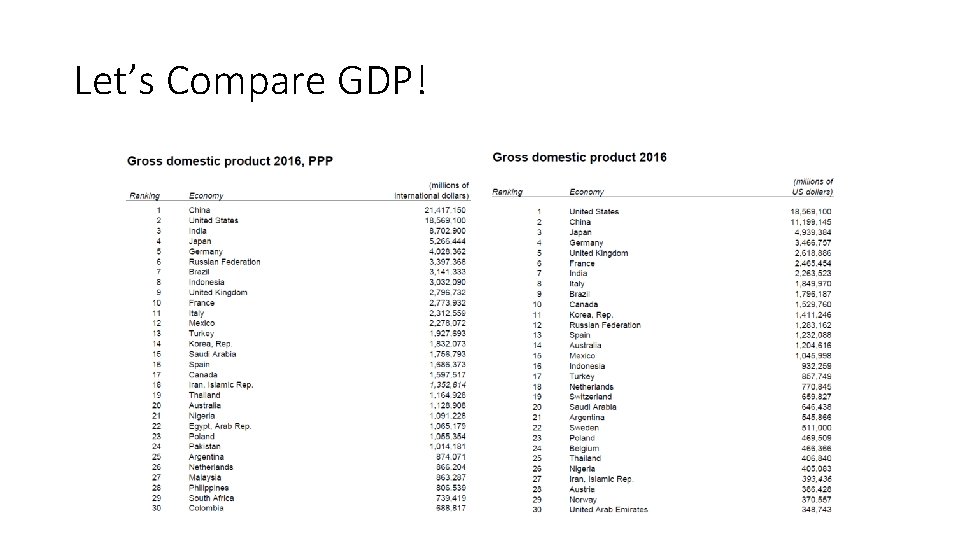
International GDP comparisons How can we measure national productive activity so that the numbers can be compared across nations?
International Comparisons • When the GDP numbers for various countries’ are compared, the same currency units must be used • There are two ways of converting from national currencies to a common currency, such as the US dollar • Use market exchange rates • Use a common set of prices (PPP)
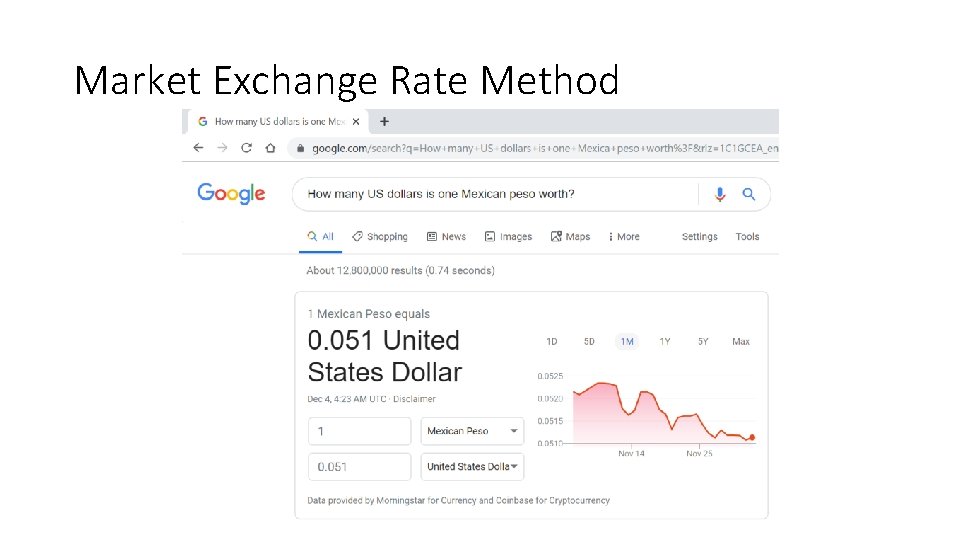
Market Exchange Rate Method • Step 1: Look up Mexico’s GDP in Mexico’s currency, the peso • Step 2: Look up how many US dollars one Mexican peso is worth • Step 3: Multiply the numbers in Steps 1 and 2 • This gives you Mexico’s GDP in US dollars • If the GDPs of two countries are both expressed in US dollars, they can be compared head to head • There’s another way to calculate Mexico’s GDP in US dollars …
Market Exchange Rate Method
Purchasing Power Parity Method • Step 1: Find out the quantities of all the final goods that were produced in Mexico during 2016 • Step 2: Find out the prices of those goods in the United States—not Mexico—in 2016. • These prices are in US dollars • Step 3: Calculate Mexico’s GDP in US dollars, by • Step 3 a: multiplying the quantities in Step 1 by the corresponding prices in Step 2 and • Step 3 b: then adding the results obtained in Step 3 a
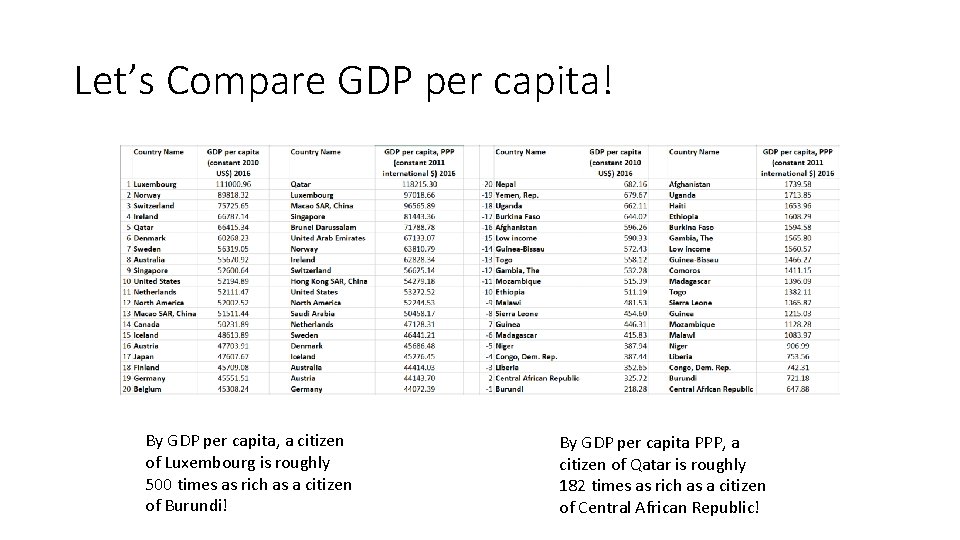
Let’s Compare! • GDP per capita (current US$): https: //data. worldbank. org/indicator/NY. GDP. PCAP. CD • GDP per capita, PPP (current international $): https: //data. worldbank. org/indicator/NY. GDP. PCAP. PP. CD • GDP per capita (constant 2010 US $): https: //data. worldbank. org/indicator/NY. GDP. PCAP. KD • GDP per capita, PPP (constant 2011 international $): https: //data. worldbank. org/indicator/NY. GDP. PCAP. PP. KD
Let’s Compare GDP!
Let’s Compare GDP per capita! By GDP per capita, a citizen of Luxembourg is roughly 500 times as rich as a citizen of Burundi! By GDP per capita PPP, a citizen of Qatar is roughly 182 times as rich as a citizen of Central African Republic!
Basic Facts of Wealth • Video: https: //youtu. be/Pz. Ar_m. L 0 Qd 8 CHAPTER 5 MEASURING A NATION’S INCOME
Is GDP a good measure of economic well-being? No, but it is the best one-number measure we have CHAPTER 5 MEASURING A NATION’S INCOME
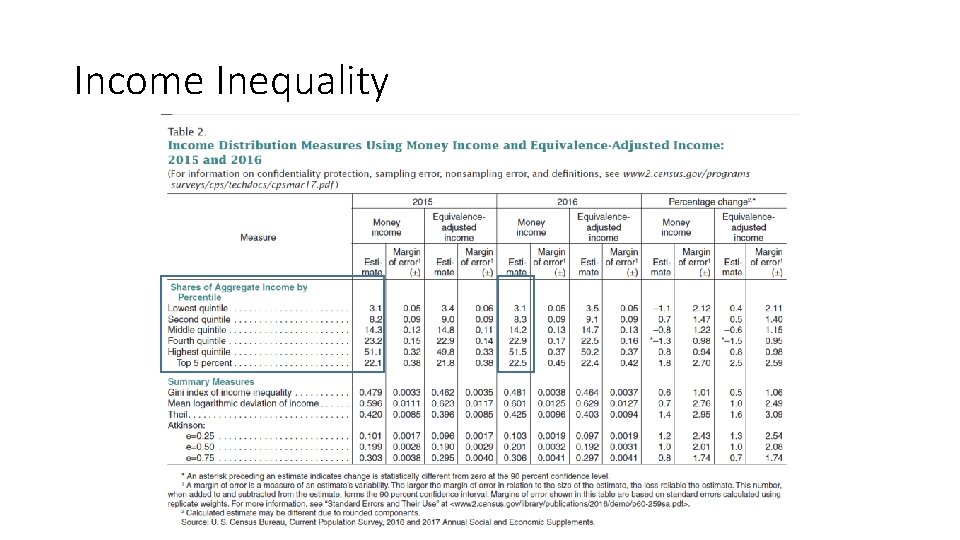
There’s a lot that’s missing in GDP • Where to begin! • Inequality, work done in home, volunteer work, illegal work, leisure, environment, disasters, …
Income Inequality
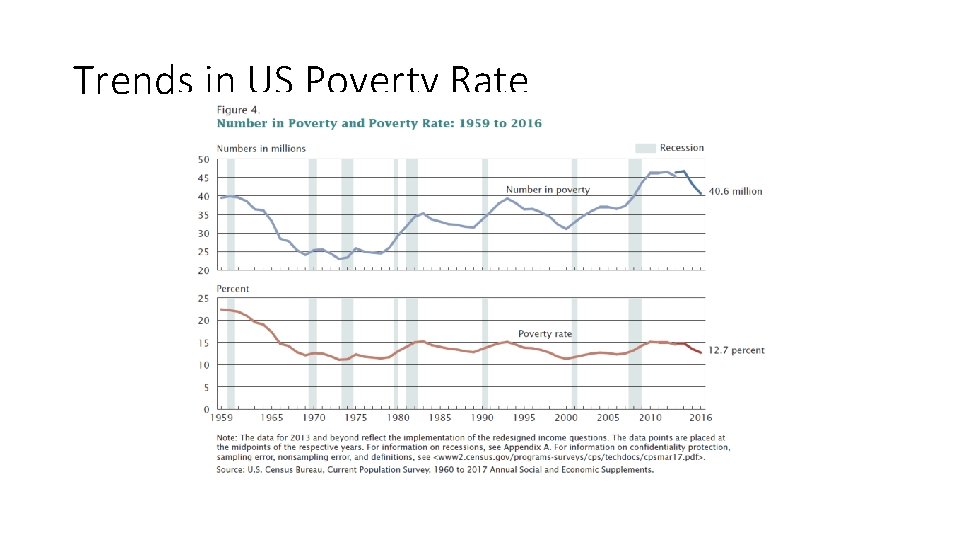
Trends in US Poverty Rate
Leisure Reduces GDP
GDP Doesn’t Count Illegal Work Jesse: “All this hard work, Mr. White! What’s the point? They won’t even count it in GDP!”
GDP Doesn’t Count Work at Home
GDP Doesn’t Count Volunteer Work
GDP Ignores Environmental Damage
GDP Ignores Consumer Surplus • Free digital technology • Free Apps, Google maps, Wikipedia, Open. Office, You. Tube • Freely available education • Khan Academy, Coursera • None of this adds to GDP • Users would be willing to pay but don’t. They get Consumer Surplus CHAPTER 5 MEASURING A NATION’S INCOME
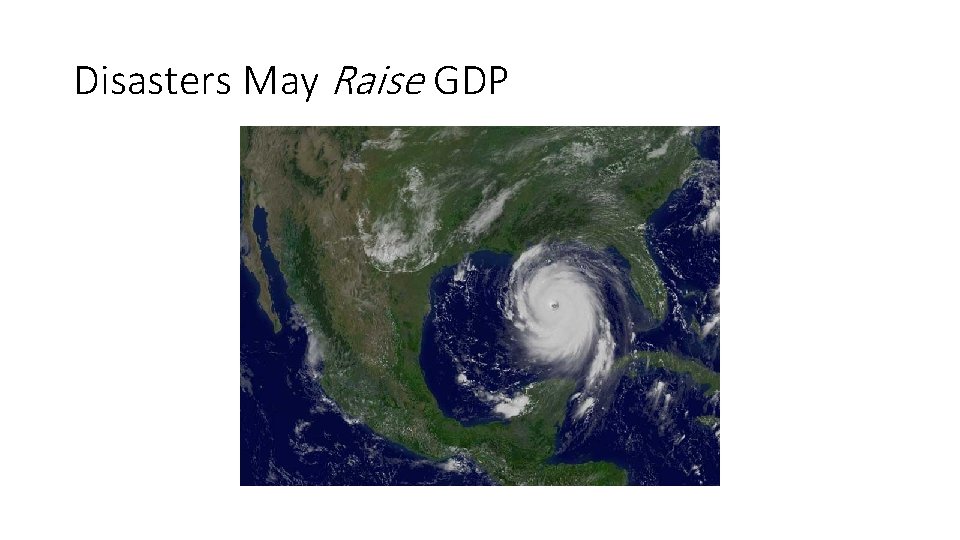
Disasters May Raise GDP
GDP And Economic Well-being • GDP is the best single measure of the economic well-being of a society. • GDP person tells us the income and expenditure of the average person in the economy. CHAPTER 5 MEASURING A NATION’S INCOME
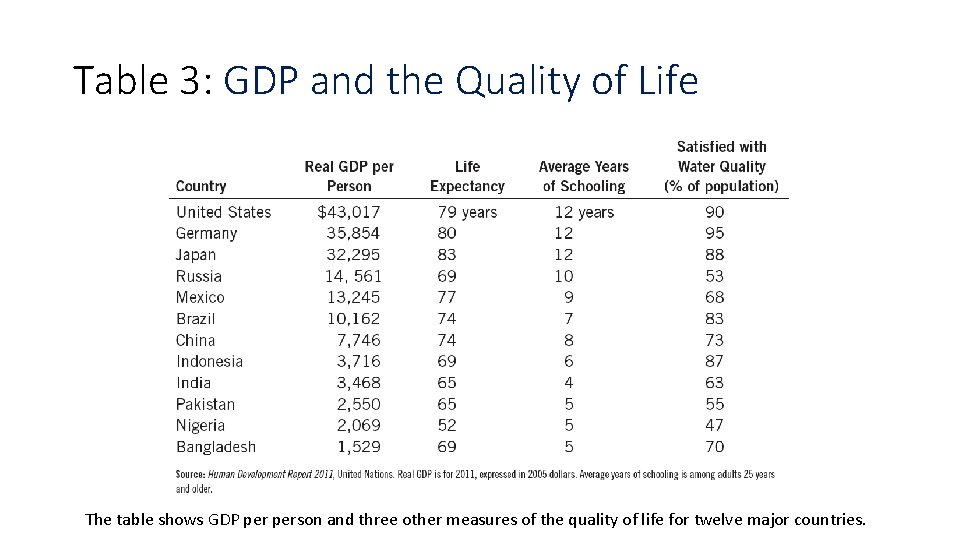
Table 3: GDP and the Quality of Life The table shows GDP person and three other measures of the quality of life for twelve major countries.
Robert Kennedy on GDP • [Gross Domestic Product] does not allow for the health of our children, the quality of their education, or the joy of their play. It does not include the beauty of our poetry or the strength of our marriages, the intelligence of our public debate or the integrity of our public officials. It measures neither our courage, nor our wisdom, nor our devotion to our country. It measures everything, in short, except that which makes life worthwhile, and it can tell us everything about America except why we are proud that we are Americans. CHAPTER 5 MEASURING A NATION’S INCOME
Real GDP Per Capita and the Standard of Living • Video: https: //youtu. be/Z 0 q. HA 93 o. OSc CHAPTER 5 MEASURING A NATION’S INCOME
Any questions? CHAPTER 5 MEASURING A NATION’S INCOME
Summary • Because every transaction has a buyer and a seller, the total expenditure in the economy must equal the total income in the economy. • Gross Domestic Product (GDP) measures an economy’s total expenditure on newly produced goods and services and the total income earned from the production of these goods and services. CHAPTER 5 MEASURING A NATION’S INCOME
Summary • GDP is the market value of all final goods and services produced within a country in a given period of time. • GDP is divided among four components of expenditure: consumption, investment, government purchases, and net exports. CHAPTER 5 MEASURING A NATION’S INCOME
Summary • Nominal GDP uses current prices to value the economy’s production. Real GDP uses constant base-year prices to value the economy’s production of goods and services. • The GDP deflator—calculated from the ratio of nominal to real GDP— measures the level of prices in the economy. CHAPTER 5 MEASURING A NATION’S INCOME
Summary • GDP is a good measure of economic well-being because people prefer higher to lower incomes. • It is not a perfect measure of well-being because some things, such as leisure time and a clean environment, aren’t measured by GDP. CHAPTER 5 MEASURING A NATION’S INCOME