Macroeconomic Data Junhui Qian Intermediate Macroeconomics Content Overview


 is essentially the total value of")

 + (Price of")


 501000.")


 Consumption(C) Government Spending (G) Investment (I) Net Export (NX)")
 • Consumption (C) measures the value of all goods and services bought")
 • Definition: spending on goods bought for future use. • It includes:")


 • Government Spending includes all government spending on goods and services.")

is 39. 7万亿元,约占GDP的 44%。")
 I/Y (%) G/Y (%) Intermediate Macroeconomics NX/Y (%) 2016 2015 2014")
 or GNP (Gross National Product)")
 Country (GNP/GDP-1)*100% U. S.")


 Intermediate Macroeconomics")


 800 700 600 500 CPI 400 GDP Deflator 300")


 Unemployment Rate (%)")

 measures both total income and total expenditure on")
- Slides: 51
Macroeconomic Data Junhui Qian Intermediate Macroeconomics
Content • Overview • GDP – Expenditure – Income • Inflation – CPI – GDP Deflator • Unemployment Intermediate Macroeconomics
The importance of data • Sherlock Holmes: It is a capital mistake to theorize before one has data. Insensibly one begins to twist facts to suit theories, instead of theories to fit facts. • Systematic v. s. casual observations • Economic data or statistics offer a systematic and objective measure of the state of economy. • In this lecture, we focus on three statistics: – GDP: total income or expenditure – CPI: price level – Unemployment: fraction of employment Intermediate Macroeconomics
National Income Accounting • GDP (Gross Domestic Product) is essentially the total value of all transactions in the economy within a time interval (say, a quarter). • Three ways to view GDP: – [production] the total value of final goods and services produced in the economy – [income] the total income generated from transactions of domestically produced goods and services – [expenditure] the total expenditure generated from transactions of domestically produced goods and services • Total income must equal total expenditure, because every transaction generates an income to the seller and an equal amount expenditure to the buyer. Intermediate Macroeconomics
The Circular Flow Income Labor Households Firms Goods and services Expenditure Intermediate Macroeconomics
Computing GDP • GDP = (Price of apples Quantity of apples) + (Price of oranges Quantity of oranges) = (0. 5 4) + (1. 0 3) = 5. 0 RMB Intermediate Macroeconomics
Rule for Computing GDP: Use Market Price • Use market prices, when available, to calculate the value of goods and services. • Imputed price for those goods that are not sold in the marketplace. For example, home ownership and government services. • No imputation is made for goods and services in the underground economy. Intermediate Macroeconomics
Rule for Computing GDP: Final Goods Only • Intermediate goods are not doubly counted in GDP = value of final goods produced = sum of value added at all stages of production • Used goods not included – The treatment of inventories depends on if the goods are spoilable. • If they spoil, GDP remains unchanged. • If the goods do not spoil and they are stored for future sale, their value is included in GDP. When the goods are finally sold out of inventory (possibly next year), they will be treated as used goods (and not counted in GDP). Intermediate Macroeconomics
Rule for Computing GDP: Produced within the Country • Goods and services that are imported for consumption or investment within the country are not counted in GDP. • They are counted in investment or consumption, though. Intermediate Macroeconomics
Nominal and Real GDP • Intermediate Macroeconomics
The Real and Nominal GDP of China Nominal GDP Real GDP (2010 Price) 501000. 0 451000. 0 401000. 0 351000. 0 301000. 0 251000. 0 201000. 0 151000. 0 101000. 0 51000. 0 1978 1979 1980 1981 1982 1983 1984 1985 1986 1987 1988 1989 1990 1991 1992 1993 1994 1995 1996 1997 1998 1999 2000 2001 2002 2003 2004 2005 2006 2007 2008 2009 2010 2011 1000. 0 Intermediate Macroeconomics
53 55 19 57 19 59 19 61 19 63 19 65 19 67 19 69 19 71 19 73 19 75 19 77 19 79 19 81 19 83 19 85 19 87 19 89 19 91 19 93 19 95 19 97 19 99 20 01 20 03 20 05 20 07 20 09 20 11 20 13 20 15 20 17 19 19 Real GDP Growth of China (Annual) China Real GDP Growth (Annual, %) 30 20 10 0 (10) (20) (30) Intermediate Macroeconomics
Intermediate Macroeconomics 3 3 -0 -0 19 20 3 -0 18 20 17 20 16 20 3 -0 15 20 14 20 13 20 3 -0 12 20 3 -0 11 20 3 -0 10 20 3 -0 09 20 3 -0 08 20 3 3 -0 -0 07 20 06 20 3 -0 05 20 3 -0 04 20 3 -0 03 20 3 -0 02 20 3 3 -0 -0 01 20 00 20 3 -0 99 19 3 -0 98 19 3 -0 97 19 3 -0 96 19 95 19 3 -0 94 19 3 -0 93 19 92 19 Real GDP Growth of China (Quarterly, 1992 Q 1 -2019 Q 2) China Real GDP Growth (Quarterly, %) 18 16 14 12 10 8 6 4 2 0
Choice of Base Year • One principle of calculating RGDP is that the base year should not be too far, so that prices will not be too out of date. For example, cell phone was a rare product 20 years ago. • Since 1995, the US has been using chain-weighted measures of real GDP in the calculation of real GDP growth. • The chain weight works as follows: Average prices in 2009 and 2010 are used to measure real growth from 2009 to 2010. Average prices in 2010 and 2011 are used to measure real growth from 2010 to 2011, and so on. • In China, we change base-year every five years. Intermediate Macroeconomics
Components of Expenditure Y = C + I + G + NX Total expenditure (GDP) Investment spending by businesses and households Consumption spending by households Government purchases of goods and services This is the called the national income accounts identity. Intermediate Macroeconomics Net exports or net foreign demand
A More Detailed Decomposition • Intermediate Macroeconomics
Decomposition of Chinese GDP (Expenditure) Consumption(C) Government Spending (G) Investment (I) Net Export (NX) 120% 100% 80% 60% 40% 20% Intermediate Macroeconomics 2014 2013 2012 2011 2010 2009 2008 2007 2006 2005 2004 2003 2002 2001 2000 1999 1998 1997 1996 1995 1994 1993 1992 1991 1990 1989 1988 1987 1986 1985 1984 1983 1982 1981 1980 1979 1978 0%
Consumption (C) • Consumption (C) measures the value of all goods and services bought by households. • It includes – durable goods last a long time e. g. , cars, home appliances – non-durable goods last a short time e. g. , food, clothing – services work done for consumers e. g. , dry cleaning, air travel. Intermediate Macroeconomics
Investment (I) • Definition: spending on goods bought for future use. • It includes: – business fixed investment spending on plant and equipment that firms will use to produce other goods & services – residential fixed investment spending on housing units by consumers and landlords – inventory investment the change in the value of all firms’ inventories Intermediate Macroeconomics
Investment and Capital • Capital is one of the factors of production. At any given moment, the economy has a certain overall stock of capital. • Investment is spending on new capital. • Example: Suppose that on 1/1/2002: An economy has an amount of capital: 500 during 2002: investment = 100, depreciation = -20 1/1/2003: The economy will have capital: 500+100 -20=580 • In a word, investment is “flow”, capital is “stock”. Intermediate Macroeconomics
Housing Issue • A house is a piece of capital which is used to produce a consumer service, which we may call “housing services”. • A consumer’s spending on a new house counts under investment, not consumption. • A tenant’s spending on rent counts under services -- rent is considered spending on “housing services. ” • In national income accounting, (the services category of) consumption includes the imputed rental value of owner-occupied housing. • So what happens if a renter buys the house she had been renting? Conceptually, consumption should remain unchanged: she is no longer paying rent, but she is still consuming the same housing services as before. Intermediate Macroeconomics
Inventory issue • Unsold output goes into inventory, and is counted as “inventory investment”, whether the inventory buildup was intentional or not. • If total inventories are $10 billion at the beginning of the year, and $12 billion at the end, then inventory investment equals $2 billion for the year. • Note that inventory investment can be negative (which means inventories fell over the year). Intermediate Macroeconomics
Government Spending (G) • Government Spending includes all government spending on goods and services. • To avoid double-counting, G excludes transfer payments(转移支付) (e. g. unemployment insurance payments), because they do not represent spending on goods and services. • Transfer payments are included in “government outlays, ” but not in government spending. Intermediate Macroeconomics
Chinese GDP at 2018 • Intermediate Macroeconomics
Investment in China • In 2018, total investment in China(固定资本 形成+存货增加)is 39. 7万亿元,约占GDP的 44%。 • In 1980, the I/Y ratio was 35%. • In US, I/Y has been between 15% and 20% in recent history. Intermediate Macroeconomics
-10 C/Y (%) I/Y (%) G/Y (%) Intermediate Macroeconomics NX/Y (%) 2016 2015 2014 2013 2012 2011 2010 2009 2008 2007 2006 2005 2004 2003 2002 2001 2000 1999 1998 1997 1996 1995 1994 1993 1992 1991 1990 1989 1988 1987 1986 1985 1984 1983 1982 1981 1980 1979 1978 Decomposition of GDP (Expenditure, %) 60 50 40 30 20 10 0
Other measures of income • GNI (Gross National Income) or GNP (Gross National Product) GNI = GDP + net factor payments from abroad • NNP (Net National Product) NNP = GNP – Depreciation – In the national income accounts, depreciation is called the consumption of fixed capital. In US, it equals about 10% of GNP. Because depreciation of capital is a cost of producing the output of the economy, subtracting depreciation shows the net result of economic activity. • NI (National Income) – NI differs from NNP by a small correction called statistical discrepancy. Intermediate Macroeconomics
Difference between GNP and GDP (as percentage of GDP, 1997) Country (GNP/GDP-1)*100% U. S. A. Bangladesh Brazil Canada Chile Ireland Kuwait Mexico Saudi Arabia Singapore 0. 1% 3. 3% -2. 0% -3. 2% -8. 8% -16. 2% 20. 8% -3. 2% 3. 3% 4. 2% Intermediate Macroeconomics
-2. 0% Intermediate Macroeconomics 2019 2018 2017 2016 2015 2014 2013 2012 2011 2010 2009 2008 2007 2006 2005 2004 2003 2002 2001 2000 1999 1998 1997 1996 1995 1994 1993 1992 1991 1990 1989 1988 1987 1986 1985 1984 1983 1982 1981 Case of China (GNP-GDP)/GDP 1. 0% 0. 5% 0. 0% -0. 5% -1. 0% -1. 5%
Personal Income • Personal Income = National Income − Indirect Business Tax − Corporate Profits − Social Insurance Contributions − Net Interest + Dividends + Government Transfers to Individuals + Personal Interest Income. • Disposable Personal Income = Personal Income – Personal Taxes Intermediate Macroeconomics
Content • Overview • GDP – Expenditure – Income • Inflation – CPI – GDP Deflator • Unemployment Intermediate Macroeconomics
CPI • Intermediate Macroeconomics
CPI • Intermediate Macroeconomics
Apple and orange economy • Year Apple Orange 2016 0. 5 1 2015 0. 4 0. 8 Intermediate Macroeconomics
Inflation and Core Inflation • Change in CPI is inflation. • Core CPI is the price index of a consumer basket that excludes food and energy products. • Core inflation measures the increase in the core CPI. • CPI exhibits strong seasonality, hence seasonal adjustment is necessary before any analysis of inflation based on CPI. Intermediate Macroeconomics
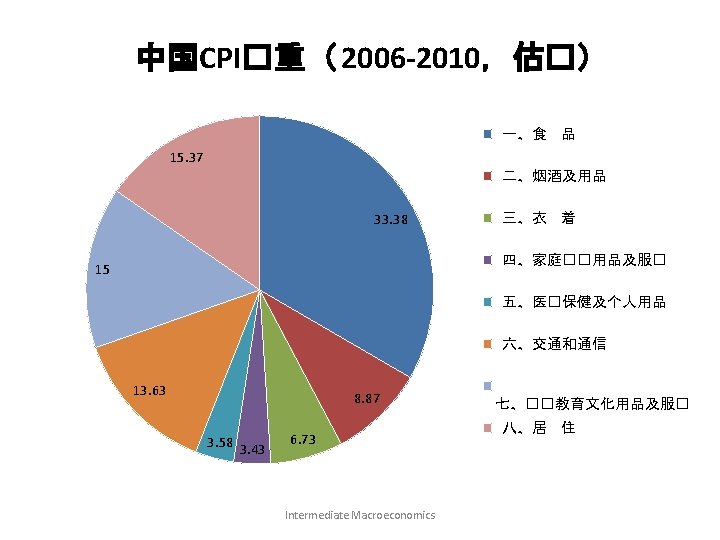
How Chinese Statistics Bureau Calculates inflation • Intermediate Macroeconomics
87 19 01 88 19 01 89 19 01 90 19 01 91 19 01 92 19 01 93 19 01 94 19 01 95 19 01 96 19 01 97 19 01 98 19 01 99 20 01 00 20 01 01 20 01 02 20 01 03 20 01 04 20 01 05 20 01 06 20 01 07 20 01 08 20 01 09 20 01 10 20 01 11 20 01 12 20 01 13 20 01 14 20 01 15 20 01 16 20 01 17 20 01 18 20 01 19 -0 1 19 Inflation in CPI Monthly Inflation (%) 30 25 20 15 10 5 0 (5) Intermediate Macroeconomics
Composition of the CPI’s “basket” (US) Intermediate Macroeconomics
GDP Deflator • Intermediate Macroeconomics
GDP Deflator v. s. CPI • The GDP deflator measures the prices of all goods and services produced, whereas the CPI measures prices of only the goods and services bought by consumers. Thus, an increase in the price of goods bought only by firms or the government will show up in the GDP deflator, but not in the CPI. • Also, another difference is that the GDP deflator includes only those goods and services produced domestically. Imported goods are not a part of GDP and therefore don’t show up in the GDP deflator. • The final difference is the way the two weight the prices in the economy. The CPI assigns fixed weights to the prices of different goods (Laspeyres index), whereas the GDP deflator assigns changing weights (Paasche index). Intermediate Macroeconomics
CPI vs GDP Deflator (China) 800 700 600 500 CPI 400 GDP Deflator 300 200 100 0 1978 1980 1982 1984 1986 1988 1990 1992 1994 1996 1998 2000 2002 2004 2006 2008 2010 2012 2014 Intermediate Macroeconomics
Inflation in CPI and GDP Deflator 30. 00 25. 00 20. 00 15. 00 Inflation in GDP Deflator Inflation in CPI 10. 00 5. 00 0. 00 1979 1981 1983 1985 1987 1989 1991 1993 1995 1997 1999 2001 2003 2005 2007 2009 2011 2013 2015 -5. 00 Intermediate Macroeconomics
Why CPI tends to overstates inflation • Substitution bias – The CPI uses fixed weights, so it cannot reflect consumers’ ability to substitute toward goods whose relative prices have fallen. • Introduction of new goods – The introduction of new goods makes consumers better off and, in effect, increases the real value of money. But it does not reduce the CPI, because the CPI uses fixed weights. • Unmeasured changes in quality – Quality improvements increase the value of the dollar, but are often not fully measured. Intermediate Macroeconomics
Content • Overview • GDP – Expenditure – Income • Inflation – CPI – GDP Deflator • (Un)employment Intermediate Macroeconomics
Measuring Unemployment • Unemployment Rate = Number of Unemployed Labor Force • Labor Force Participation = Labor Force Adult Population • The labor force is defined as the sum of the employed and unemployed, and the unemployment rate is defined as the percentage of the labor force that is unemployed. • The labor-force participation rate is the percentage of the adult population who are in the labor force. Intermediate Macroeconomics
Labor Market in China and the US • In 2018, China’s population and labor statistics are as follows (millions): Population = 248. 6 (Children, Age 0 -15) + 1148. 6 (Adults) = 1395. 4 Labor force = 775. 9 (Employed) + 29. 8 (Unemployed) = 805. 7 Unemployment rate = 29. 8/805. 7 = 3. 7% Labor-force participation rate = 805. 7/1148. 6 = 70. 3% • In Sep 2019, the US labor statistics broke down as follows (millions): Labor Force = 158. 3 (Employed) + 5. 8 (Unemployed) = 164. 1 Unemployment Rate = (5. 8/164. 1) x 100 = 3. 5% Labor-Force Participation Rate = (164. 1/259. 6) x 100 = 63. 1% Intermediate Macroeconomics
Case Study I: Trends in US LFP Intermediate Macroeconomics
Case Study II: LFP and Unemployment Rate in China LFP (%) Unemployment Rate (%) 87. 00 3. 50 85. 00 3. 00 83. 00 2. 50 81. 00 2. 00 79. 00 1. 50 77. 00 1. 00 75. 00 0. 50 73. 00 0. 00 1978 1980 1982 1984 1986 1988 1990 1992 1994 1996 1998 2000 Intermediate Macroeconomics 2002 2004 2006 2008 2010 2012 2014
Case Study III: The Structural Change in Labor Force 120% 100% 80% 第一��就�人� 60% 第二��就�人� 第三��就�人� 40% 20% 0% 1978 1980 1982 1984 1986 1988 1990 1992 1994 1996 1998 2000 2002 2004 2006 2008 2010 2012 2014 Intermediate Macroeconomics
Summary • Gross Domestic Product (GDP) measures both total income and total expenditure on the economy’s output of goods & services. • Nominal GDP values output at current prices; real GDP values output at constant prices. Changes in output affect both measures, but changes in prices only affect nominal GDP. • GDP is the sum of consumption, investment, government purchases, and net exports. • The overall level of prices can be measured by either – the Consumer Price Index (CPI), the price of a fixed basket of goods purchased by the typical consumer – the GDP deflator, the ratio of nominal to real GDP • The unemployment rate is the fraction of the labor force that is not employed. Intermediate Macroeconomics