
21 The Realm of Macroeconomics Where the telescope





- Slides: 40
21 The Realm of Macroeconomics Where the telescope ends, the microscope begins. Which of the two has the grander view? VICTOR HUGO
Contents ● Drawing a Line Between Macroeconomics and Microeconomics ● Supply and Demand in Macroeconomics ● Gross Domestic Product ● The Economy on a Roller Coaster ● The Problem of Macroeconomic Stabilization: A Sneak Preview Copyright © 2003 South-Western/Thomson Learning. All rights reserved.
Drawing a Line Between Macro and Microeconomics ● In macroeconomics, we typically assume that most details of resource allocation and income distribution are of secondary importance to the study of the overall rates of inflation and unemployment. Copyright© 2003 Southwestern/Thomson Learning All rights reserved.
Drawing a Line Between Macro and Microeconomics ● Aggregation and Macroeconomics ♦ An economic aggregate is nothing but an abstraction that people use to describe some important feature of economic life, such as total domestic product. Copyright© 2003 Southwestern/Thomson Learning All rights reserved.
Drawing a Line Between Macro and Microeconomics ● The Foundations of Aggregation ♦ The composition of demand supply in various markets is of little consequence for the economy-wide issues of growth, inflation, and unemployment. ♦ During economic fluctuations, markets tend to move up or down together. Copyright© 2003 Southwestern/Thomson Learning All rights reserved.
Supply and Demand in Macroeconomics ● Moving to Macroeconomic Aggregates ♦ Aggregate supply and aggregate demand relate domestic product (on the horizontal axis) to the price level (on the vertical axis). Copyright© 2003 Southwestern/Thomson Learning All rights reserved.
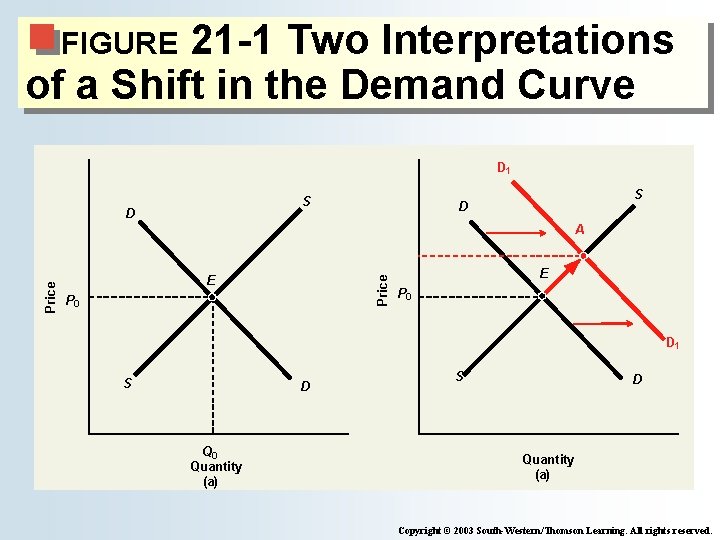
21 -1 Two Interpretations of a Shift in the Demand Curve FIGURE D 1 S D E Price A P 0 E P 0 D 1 S D Q 0 Quantity (a) S D Quantity (a) Copyright © 2003 South-Western/Thomson Learning. All rights reserved.
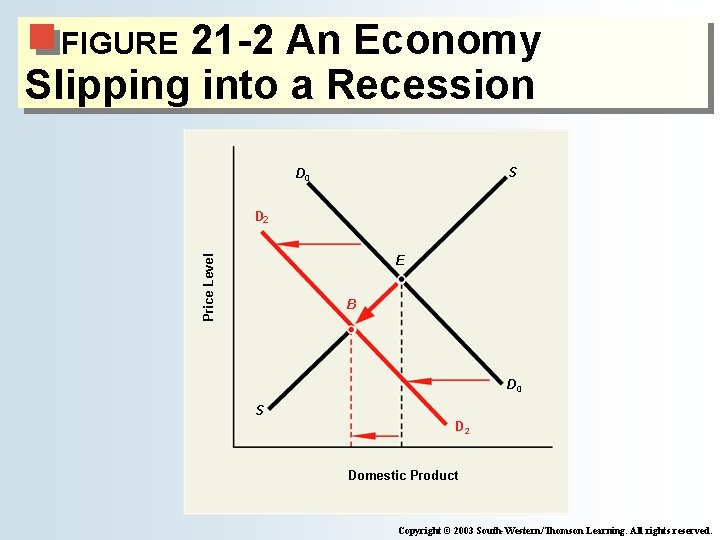
21 -2 An Economy Slipping into a Recession FIGURE S D 0 D 2 Price Level E B D 0 S D 2 Domestic Product Copyright © 2003 South-Western/Thomson Learning. All rights reserved.
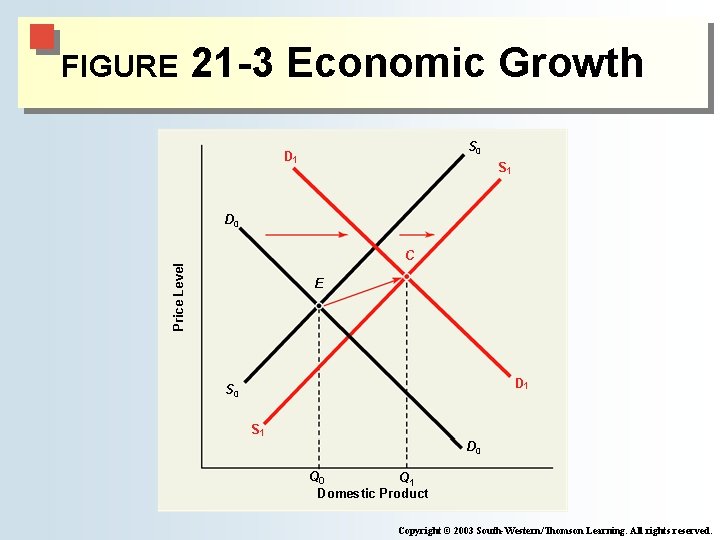
FIGURE 21 -3 Economic Growth S 0 D 1 S 1 D 0 Price Level C E D 1 S 0 S 1 D 0 Q 1 Domestic Product Copyright © 2003 South-Western/Thomson Learning. All rights reserved.
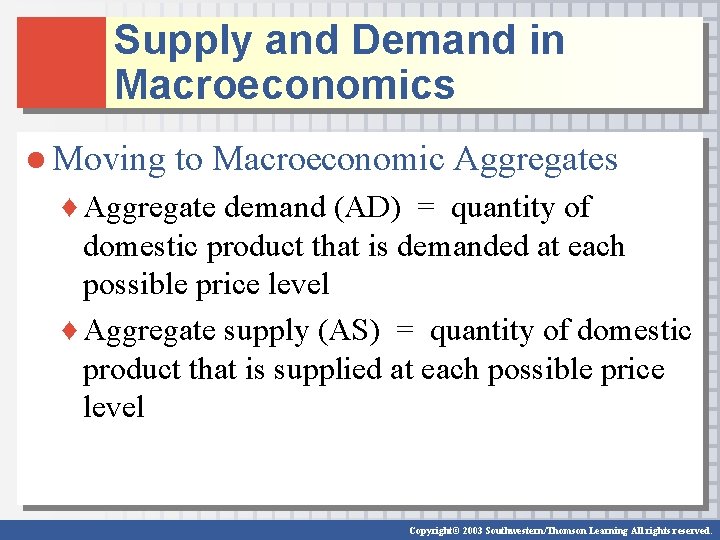
Supply and Demand in Macroeconomics ● Moving to Macroeconomic Aggregates ♦ Aggregate demand (AD) = quantity of domestic product that is demanded at each possible price level ♦ Aggregate supply (AS) = quantity of domestic product that is supplied at each possible price level Copyright© 2003 Southwestern/Thomson Learning All rights reserved.
Supply and Demand in Macroeconomics ● Inflation ♦ Major concerns of macroeconomics ■Inflation ■Unemployment ■Growth ♦ AD price level Copyright© 2003 Southwestern/Thomson Learning All rights reserved.
Supply and Demand in Macroeconomics ● Recession and Unemployment ♦ AD unemployment ♦ Recession = a period of time during which production falls and people lose jobs Copyright© 2003 Southwestern/Thomson Learning All rights reserved.
Supply and Demand in Macroeconomics ● Economic Growth ♦ Economic growth = GDP ♦ AD and/or AS growth Copyright© 2003 Southwestern/Thomson Learning All rights reserved.
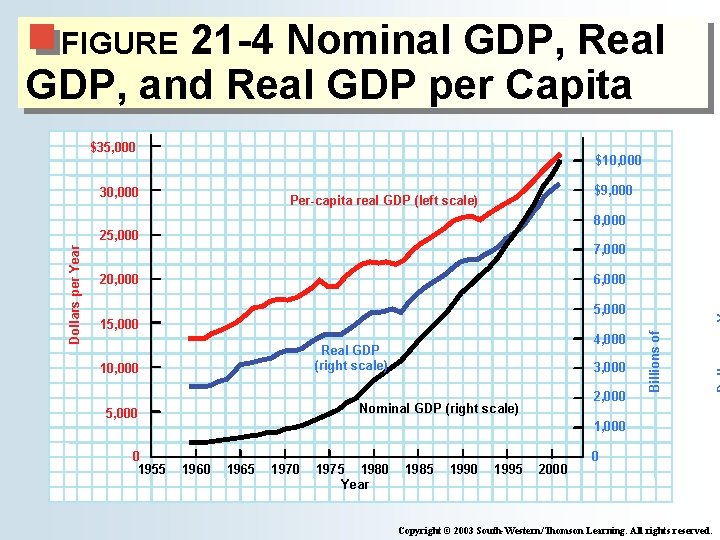
Gross Domestic Product ● Money as the Measuring Rod: Real Versus Nominal GDP ♦ GDP = sum of the money values of all final goods and services produced in the domestic economy within the year ♦ Nominal GDP (GDP in current dollars) values each good and service at the price at which it was actually sold during the year. Copyright© 2003 Southwestern/Thomson Learning All rights reserved.
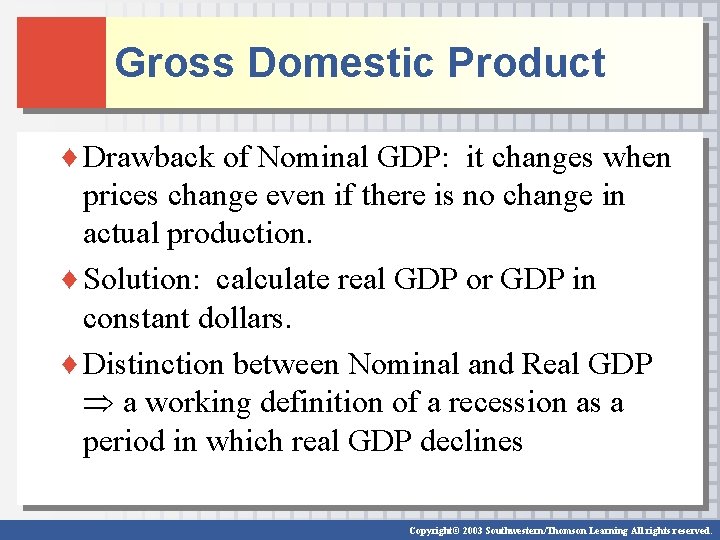
Gross Domestic Product ♦ Drawback of Nominal GDP: it changes when prices change even if there is no change in actual production. ♦ Solution: calculate real GDP or GDP in constant dollars. ♦ Distinction between Nominal and Real GDP a working definition of a recession as a period in which real GDP declines Copyright© 2003 Southwestern/Thomson Learning All rights reserved.
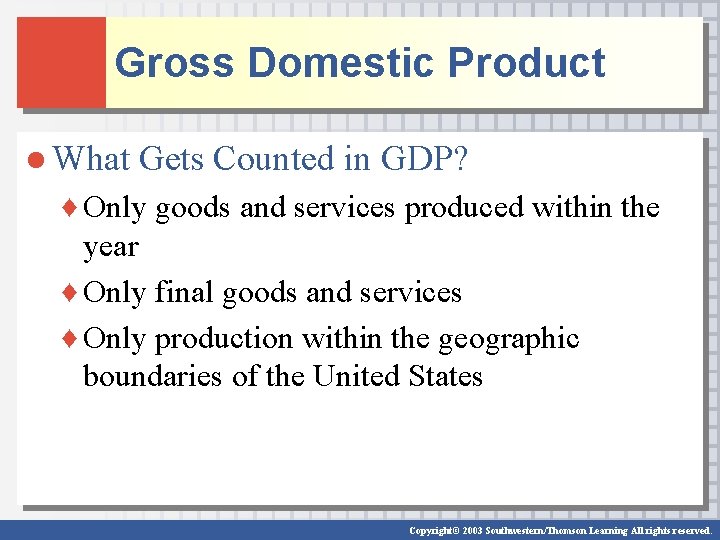
Gross Domestic Product ● What Gets Counted in GDP? ♦ Only goods and services produced within the year ♦ Only final goods and services ♦ Only production within the geographic boundaries of the United States Copyright© 2003 Southwestern/Thomson Learning All rights reserved.
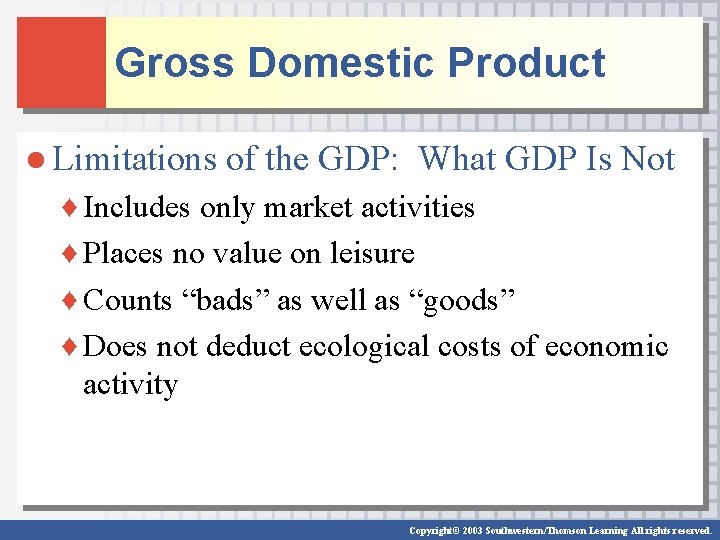
Gross Domestic Product ● Limitations of the GDP: What GDP Is Not ♦ Includes only market activities ♦ Places no value on leisure ♦ Counts “bads” as well as “goods” ♦ Does not deduct ecological costs of economic activity Copyright© 2003 Southwestern/Thomson Learning All rights reserved.
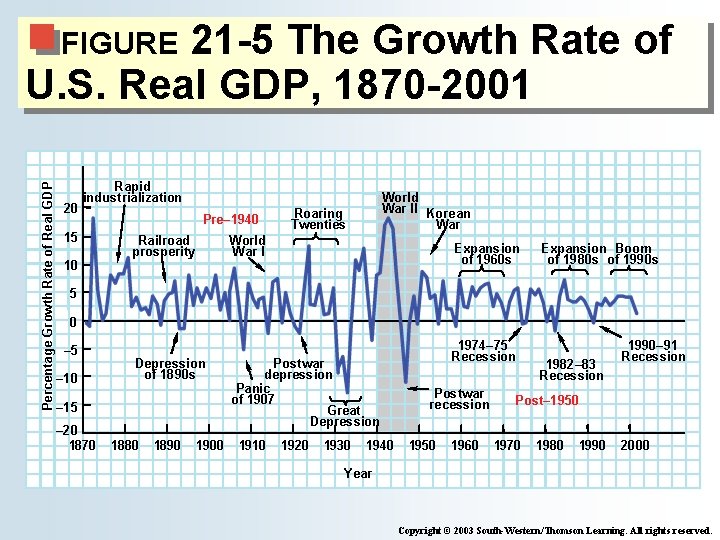
The Economy on a Roller Coaster ● Growth, but with Fluctuations ♦ The U. S. has seen significant fluctuations in economic growth, unemployment, and inflation. ♦ Before WWII, the business cycle was particularly strong, the worst episode being the Great Depression of the 1930 s. Copyright© 2003 Southwestern/Thomson Learning All rights reserved.
21 -4 Nominal GDP, Real GDP, and Real GDP per Capita FIGURE $35, 000 $10, 000 30, 000 $9, 000 Per-capita real GDP (left scale) 8, 000 7, 000 20, 000 6, 000 5, 000 10, 000 3, 000 2, 000 Nominal GDP (right scale) 5, 000 0 1955 4, 000 Real GDP (right scale) Billions of Dollars per Year 25, 000 1960 1965 1970 1975 1980 Year 1985 1990 1995 2000 0 Copyright © 2003 South-Western/Thomson Learning. All rights reserved.
21 -5 The Growth Rate of U. S. Real GDP, 1870 -2001 Percentage Growth Rate of Real GDP FIGURE 20 Rapid industrialization 15 10 Pre– 1940 Railroad prosperity World War II Korean War Roaring Twenties World War I Expansion of 1960 s Expansion Boom of 1980 s of 1990 s 5 0 – 5 – 10 Depression of 1890 s – 15 – 20 1870 1880 1890 1900 Postwar depression Panic of 1907 Great Depression 1910 1920 1930 1940 1974– 75 Recession Postwar recession 1950 1960 1982– 83 Recession 1990– 91 Recession Post– 1950 1970 1980 1990 2000 Year Copyright © 2003 South-Western/Thomson Learning. All rights reserved.
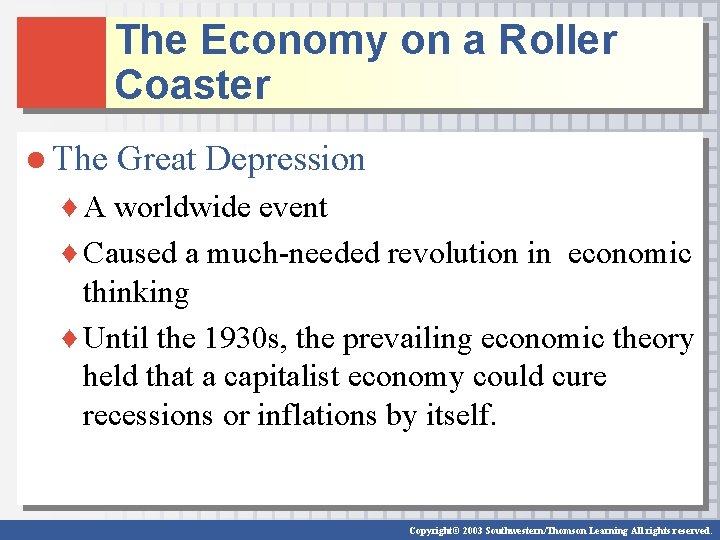
The Economy on a Roller Coaster ● The Great Depression ♦ A worldwide event ♦ Caused a much-needed revolution in economic thinking ♦ Until the 1930 s, the prevailing economic theory held that a capitalist economy could cure recessions or inflations by itself. Copyright© 2003 Southwestern/Thomson Learning All rights reserved.
The Economy on a Roller Coaster ● The Great Depression ♦ The Great Depression led John Maynard Keynes, one of the world’s most renowned economists, to write The General Theory of Employment, Interest, and Money (1936). Copyright© 2003 Southwestern/Thomson Learning All rights reserved.
The Economy on a Roller Coaster ● The Great Depression ♦ Keynes believed that: ■The economy did not naturally gravitate toward smooth growth and high levels of employment ■A pessimistic outlook could lead business firms and consumers to curtail their spending plans ■The economy could then be condemned to years of stagnation Copyright© 2003 Southwestern/Thomson Learning All rights reserved.
The Economy on a Roller Coaster ● The Great Depression ♦ In terms of the AD-AS framework, Keynes suggested that there were times when the AD curve shifted inward by large amounts. ♦ The consequence would be declining output and deflation. Copyright© 2003 Southwestern/Thomson Learning All rights reserved.
The Economy on a Roller Coaster ● The Great Depression ♦ Keynes showed how governments can manage their economies so that recessions will not turn into depressions and depressions will not last as long as the Great Depression. Copyright© 2003 Southwestern/Thomson Learning All rights reserved.
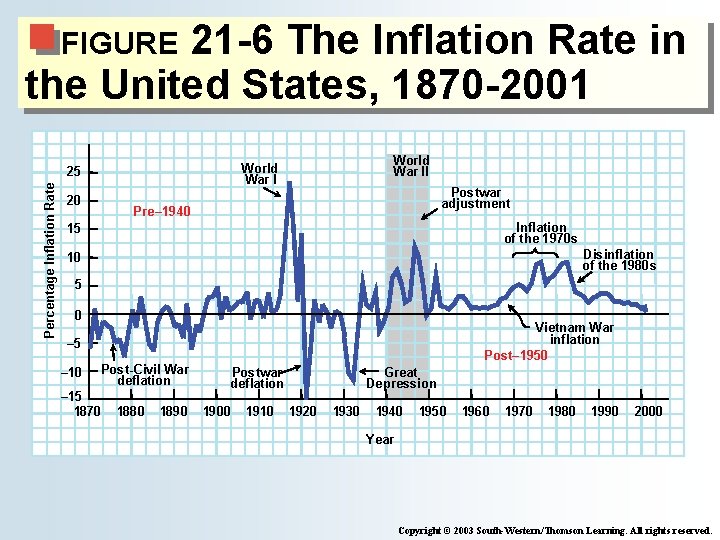
The Economy on a Roller Coaster ● From World War II to 1973 ♦ During this period, the economy experienced some fairly mild business cycles, but grew considerably. ♦ By the end of the period, inflation was rising. Copyright© 2003 Southwestern/Thomson Learning All rights reserved.
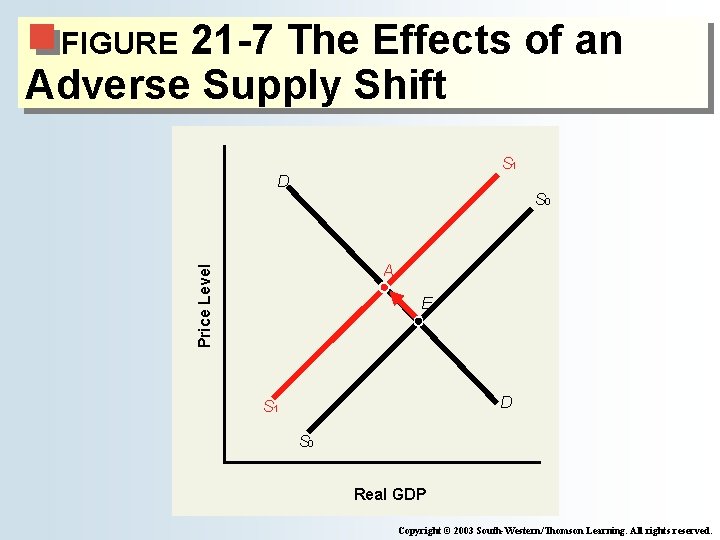
The Economy on a Roller Coaster ● The Great Stagflation, 1973 -1980 ♦ The international price of oil was raised sharply in 1973 and again in 1979. ♦ For that reason and some others, the period saw the emergence of stagflation, both unemployment and inflation increasing together. Copyright© 2003 Southwestern/Thomson Learning All rights reserved.
21 -6 The Inflation Rate in the United States, 1870 -2001 FIGURE Percentage Inflation Rate World War II World War I 25 20 Postwar adjustment Pre– 1940 Inflation of the 1970 s 15 Disinflation of the 1980 s 10 5 0 Vietnam War inflation Post– 1950 – 5 – 10 Post-Civil War deflation – 15 1870 1880 1890 Postwar deflation 1900 1910 Great Depression 1920 1930 1940 1950 1960 1970 1980 1990 2000 Year Copyright © 2003 South-Western/Thomson Learning. All rights reserved.
The Economy on a Roller Coaster ● Reaganomics and its Aftermath ♦ When Reagan assumed office in 1981, the economy went into a sharp tailspin, and soon the rate of inflation fell. ♦ This was followed by a period of steady, noninflationary growth during most of the 1980 s. In 1990 -91, recession hit. Copyright© 2003 Southwestern/Thomson Learning All rights reserved.
The Economy on a Roller Coaster ● Clintonomics: Deficit Reduction and “The Best Economy in 30 Years” ♦ Clinton’s initial objectives were spurring growth and increasing public investment. ♦ Soon, however, the overriding goal in Washington became deficit reduction. Copyright© 2003 Southwestern/Thomson Learning All rights reserved.
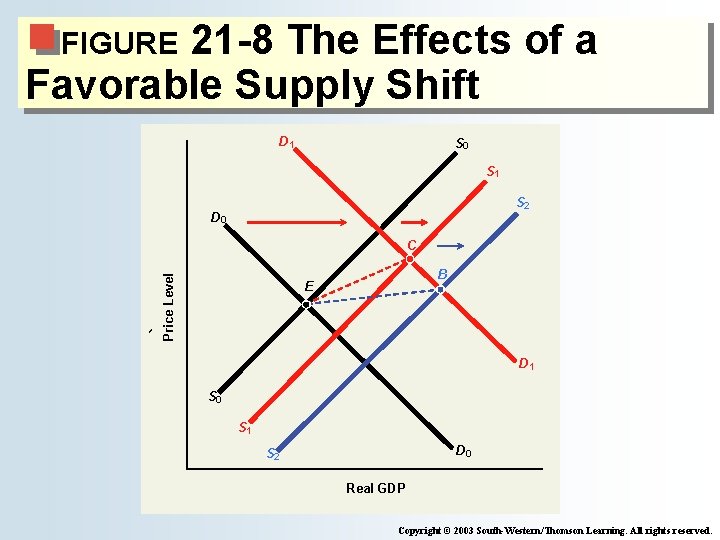
The Economy on a Roller Coaster ● Clintonomics: Deficit Reduction and “The Best Economy in 30 Years” ♦ A variety of transitory factors pushed the economy’s AS curve outward at an unusually rapid pace between 1996 and 1999. ♦ Strong economic growth continued through the late 1990 s. ♦ Inflation remained low. Copyright© 2003 Southwestern/Thomson Learning All rights reserved.
The Economy on a Roller Coaster ● The First Year of the Bush Economy ♦ Real GDP grew very slowly then declined slightly in 2 nd half of 2001 ■ 1 st recession in 10 years Copyright© 2003 Southwestern/Thomson Learning All rights reserved.
The Economy on a Roller Coaster ● The First Year of the Bush Economy ♦ Policies that helped shift AD curve, mitigating recession ■tax cut of 2001 ■war of terrorism, burst of government spending ■consumers spending remained strong, despite Sept 11 ♦ As of 2002, debate rages over whether recession already over Copyright© 2003 Southwestern/Thomson Learning All rights reserved.
21 -7 The Effects of an Adverse Supply Shift FIGURE S 1 D S 0 Price Level A E D S 1 S 0 Real GDP Copyright © 2003 South-Western/Thomson Learning. All rights reserved.
21 -8 The Effects of a Favorable Supply Shift FIGURE D 1 S 0 S 1 S 2 D 0 Price Level C B E D 1 S 0 S 1 D 0 S 2 Real GDP Copyright © 2003 South-Western/Thomson Learning. All rights reserved.
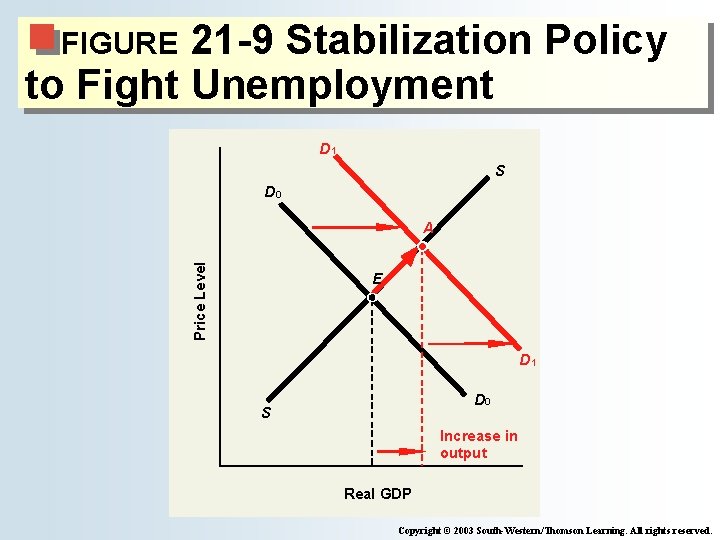
The Problem of Macroeconomic Stabilization ● Combating Unemployment ♦ When recessions are caused by too low aggregate demand, governments can try to stimulate demand. Copyright© 2003 Southwestern/Thomson Learning All rights reserved.
21 -9 Stabilization Policy to Fight Unemployment FIGURE D 1 S D 0 Price Level A E D 1 D 0 S Increase in output Real GDP Copyright © 2003 South-Western/Thomson Learning. All rights reserved.
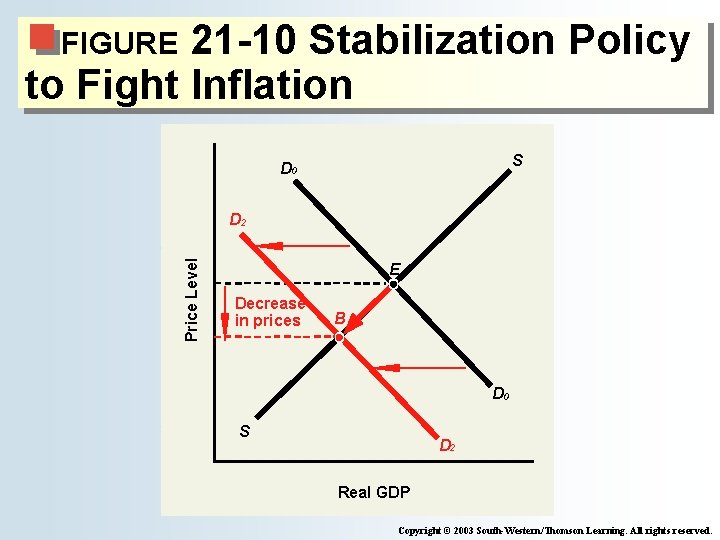
The Problem of Macroeconomic Stabilization ● Combating Inflation ♦ When inflation is caused by too high aggregate demand, governments can try to restrain aggregate demand. Copyright© 2003 Southwestern/Thomson Learning All rights reserved.
21 -10 Stabilization Policy to Fight Inflation FIGURE S D 0 Price Level D 2 E Decrease in prices B D 0 S D 2 Real GDP Copyright © 2003 South-Western/Thomson Learning. All rights reserved.
The Problem of Macroeconomic Stabilization ● Does It Really Work? ♦ Before 1940, the economy endured pronounced business fluctuations and inflation was rare. ♦ Since World War II the business fluctuations have been much less severe, but inflation has been a common occurrence. ♦ How successful government policy can be is a question to be explored throughout the text. Copyright© 2003 Southwestern/Thomson Learning All rights reserved.