GROWTH CHARTS What is growth Growth is a


 • Are not mutually exclusive; on the contrary,")


-for-age • The maximum growth potential of an individual is decided by hereditary factors.")


:")


: • When a child's age is known, measurement o weight enables")

 Wasting (% of weight/height) Normal >95 >90 Mildly")
![Indian Academy of Pediatrics (IAP) Classification(based on weight-forage) [6]: • IAP designates a weight](https://slidetodoc.com/presentation_image_h2/9e03dec39d2a867e28339dc0d58906f3/image-27.jpg "Indian Academy of Pediatrics (IAP) Classification(based on weight-forage) [6]: • IAP designates a weight")

![• Welcome trust Classification [6]: • This is also based on deficit in](https://slidetodoc.com/presentation_image_h2/9e03dec39d2a867e28339dc0d58906f3/image-29.jpg "• Welcome trust Classification [6]: • This is also based on deficit in")

![Age Independent Anthropometric Indeces [6]](https://slidetodoc.com/presentation_image_h2/9e03dec39d2a867e28339dc0d58906f3/image-31.jpg "Age Independent Anthropometric Indeces [6]")

![NCHS 1977 growth charts[Hamill et al 1977, 1979] • Using longitudinal-data from the Fels](https://slidetodoc.com/presentation_image_h2/9e03dec39d2a867e28339dc0d58906f3/image-33.jpg "NCHS 1977 growth charts[Hamill et al 1977, 1979] • Using longitudinal-data from the Fels")

 CDC 2000( Third National Health and Nutrition Examination survey)")
 Infant feeding pattern Nearly all formula fed Anthropometric data")

 undertook a")
 • Between 1997 and 2003 • longitudinal follow-up from")


- Slides: 75
GROWTH CHARTS
What is growth. . ? • Growth is a dynamic process • Defined as an increase in the physical size of the body as a whole or any of its parts Associated with increase in cell number and/or cell size[1]. Children are distinguished from people in other age groups by • physical growth and developmental changes that are ongoing, normative expected.
• A normal healthy child grows at a genetically predetermined rate • These changes usually proceed in an orderly progression that allows for individual variation[1]. • Nutritional, family, emotional, sociocultural and community, as well as physical, factors play a role in shaping the child‘s psycho logic and physiologic development
What are these growth charts? Growth charts are visible display of child’s physical growth and development. Also called as “road-to-health" chart. It was first designed by David Morley and was later modified by WHO[2].
Assessment of Growth • The assessment of growth may be longitudinal or cross sectional. • Longitudinal assessment of growth entails measuring the same child at regular intervals. • Cross sectional comparisons involve large number of children of same age. • Basic growth assessment involves measuring a child‘s weight and length or height • comparing these measurements to growth standards.
Purpose of growth assessment • The purpose is to determine whether a child is growing ―normally‖ or has a growth problem or trend towards a growth problem that should be addressed.
Methods of Nutritional Assessment (2, 3) • Are not mutually exclusive; on the contrary, they are complementary to each other Direct methods Indirect methods Clinical methods Assessment of dietary Intake (Diet Survey) Anthropometry Vital statistics Biochemical methods Ecological studies Functional assessment Biophysical and radiological examination
Anthropometry • Can reflect changes in morphological variation due to inappropriate food intake or malnutrition • There is no single permanent standard. -Uniform growth pattern is not seen to occur equally all over the world and also in subsequent generations
Components of Anthropometric Assessment: Weight-for-age • Normal variation in weight at a given age is wide. • Ideally what is important is careful measurements at repeated intervals: - Every month, from birth to 1 year Every 2 months during the second year Every 3 months thereafter upto 5 years of age. • This age group is at the greatest risk from growth faltering. • By comparing the measurements with reference standards of weight of children of the same age, the trend of growth becomes obvious. • This is best done on growth chart. Serial weighing is also useful to interpret the progress of growth when the age of the child is not known.
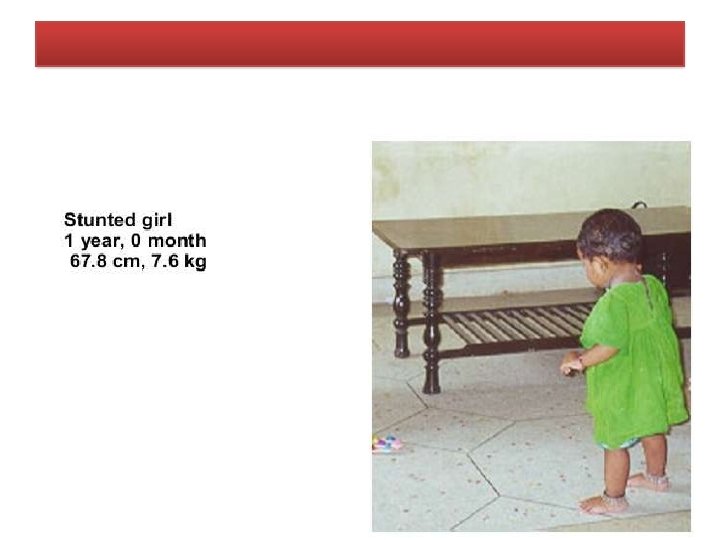
Height(Length)-for-age • The maximum growth potential of an individual is decided by hereditary factors. • Among the environmental factors, the most important being nutrition and morbidity. • Is considered an index of chronic or long duration malnutrition (3). Weight-for-height • Weight-for-height is now considered more important than weight alone. • It helps to determine whether a child is within range of "normal" weight for his height (2)
Mid-arm Circumference • Yields a relatively reliable estimation of the body's muscle mass, • The reduction of which is one of the most striking mechanisms by which the body adjusts to inadequate energy intakes (2). • Arm circumference cannot be used before the age of one year • between ages one and five years, it hardly varies (2).
Scales of Measurements • Z scores • Percentiles • Percent of median
Z- Score or standard deviation score • The deviation of the value for an individual from the median value of the reference population, divided by the standard Deviation for the reference population (Observed value) - (Median reference value) Z- Score = ----------------------------Standard deviation of reference population • A fixed Z score interval implies a fixed height or weight difference for children of a given age. • Advantage: - Allows mean and SD calculation for a group of Z score in population based applications
Percentile • The rank position of an individual on a given reference distribution, stated in terms of what percentage of the group the individual equals or exceeds. Eg. A child of a given age whose weight falls in the 10 th percentile weighs the same or more than 10% of the reference population of children of same age • Summary statistics not possible • Towards the extremes of the reference distribution there is little change in percentile values, when there is infact substantial change in weight or height • Commonly used -3, -2 and -1 Z scores are respectively the 0. 13 th , 2. 28 th and 15. 8 th percentiles and the 1 st , 3 rd and 10 th percentiles correspond to, respectively, the -2. 33, -1. 88, and -1. 29 Z scores.
Percent of median • Ratio of a measured value in the individual, for instance weight , to the median value of the reference data for the same age or height, expressed as a percentage. Main disadvantagelack of exact correspondence with a fixed point of distribution across age and wt status Eg. Depending on the child‘s age, 80% of the median weight for age might be above or below -2 Z score; in terms of health, it reflects in different classification of risk. • • Cut off points for percent of median are different for the different anthropometric indices.
Comparison of the characteristic of three measures of scale Characteristic Z score Percentile Adherence to reference population Summary statistics Possible Uniform Criteria across indices Useful for detecting changes at extreme of distribution Yes Percent of median No Yes Yes No Yes
Various indices and cut-off points for defining malnutrition Indices Cut-off points for defining malnutrition Indicators for malnutrition Percentile of reference median < 3 rd Wt-for-ht Wasting Ht-for-age Stunting Wt-for-age Underweight < 3 rd % of reference median < 80% < 90% < 80% Z or SD from reference median # <-2 < -2 “Moderate‖ malnutrition classified as the percent falling between – 2 to – 3 SD and ―severe‖ as the percent falls below – 3 SD from the reference median
Interpretation of different indicators Indicator Acute Malnutrition Chronic Malnutrition Wt-for-age Ht-for-Age Wt-for-Ht Normal
WHAT IS MALNUTRITION? Malnutrition is: • poor nutrition due to an insufficient, poorly balanced diet, faulty digestion or poor utilization of foods. (This can result in the inability to absorb foods. ) • Malnutrition is not only insufficient intake of nutrients. It can occur when an individual is getting excessive nutrients as well.
Classifications for assessment of Nutritional Status using the aforementioned parameters: • Gomez' classification (2): • Gomez' classification is based on weight retardation. • The "normal" reference child is in the 50 th centile of the Boston standards
Grade Weight-for-age Normal nutritional status Between 90 & 110% 1 st*, mild malnutrition Between 75 and 89% 2 nd*, moderate malnutrition Between 60 and 74% 3 rd*, severe malnutrition Under 60%
• The disadvantages are : • A cut-off-point of 90 per cent of reference is high and thus some normal children may be classified as 1 st degree malnourished. • By measuring only weight for age it is difficult to know if the low weight is due to a sudden acute episode of malnutrition or to long-standing chronic undernutrition (2).
Waterlow's classification (2): • When a child's age is known, measurement o weight enables almost instant monitoring of growth. • Measurement of height shows the effect of nutritional status on long-term growth.
• Waterlow's classification defines two groups for protein energy malnutrition: malnutrition with retarded growth, in which a drop in the height/age ratio points to a chronic condition— shortness, or stunting. malnutrition with a low weight for a normal height, in which the weight for height ratio is indicative of an acute condition of rapid weight loss, or wasting.
Nutritional status Stunting (% of height/age) Wasting (% of weight/height) Normal >95 >90 Mildly impaired 87. 5 - 95 80 – 90 Moderately impaired 80 - 87. 5 70 – 80 Severely impaired <80 <70
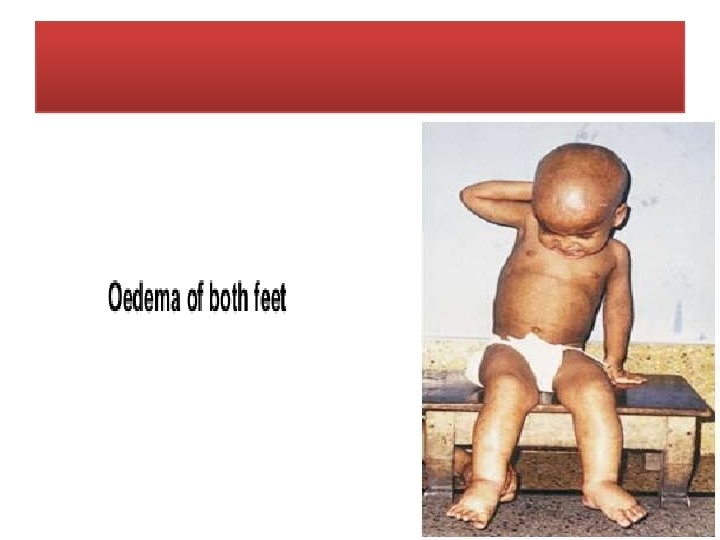
Indian Academy of Pediatrics (IAP) Classification(based on weight-forage) [6]: • IAP designates a weight of more than 80 percent of expected for age as normal. Grades of malnutrition are : • Grade I (71 -80%) • Grade II (61 -70%) • Grade III (51 -60%) • Grade IV (≤ 50%) of expected weight(50 th percentile of reference standard) for that age. (Alphabet K is postfixed in presence of edema)
• Disadvantage is that it does not take in account the child's height. • The weight is also dependent on height besides the built; • Thus children who are short statured (not necessarily because of nutritional deprivation) are also misclassified as PEM by this classification [6].
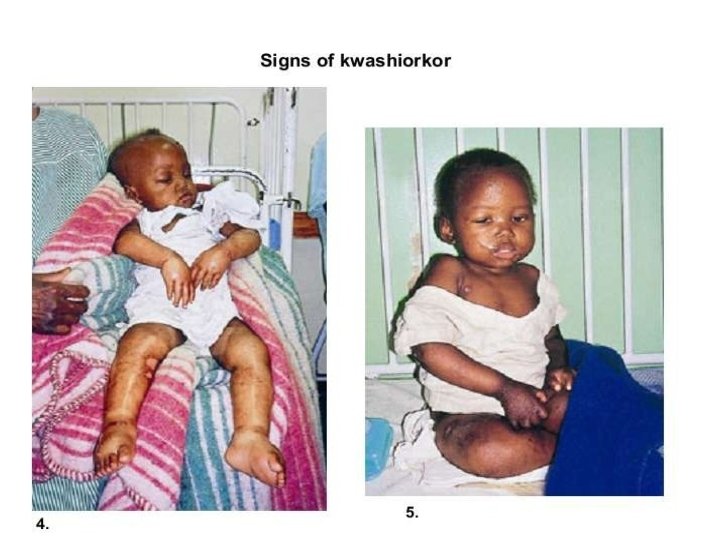
• Welcome trust Classification [6]: • This is also based on deficit in body weight for age and presence or absence of edema 1. Children weighing between 60 -80 per cent of their expected weight for age with edema are classified as kwashiorkor.
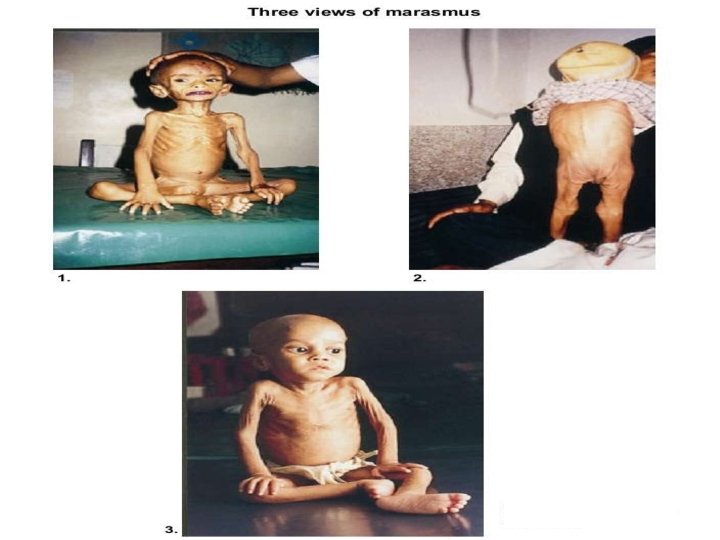
2. Those weighing between 60 -80 per cent of expected without edema are known as having undernutrition. 3. Those without edema and weighing less than 60 per cent of their expected weight for age are considered to be having marasmus.
Age Independent Anthropometric Indeces [6]
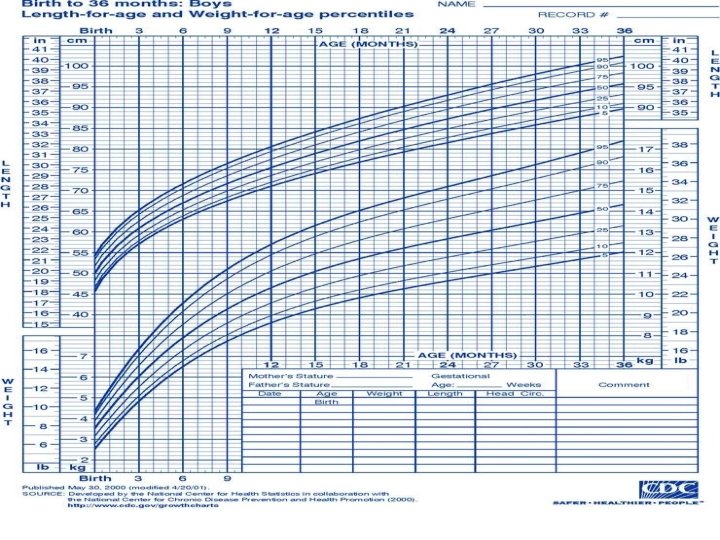
THE GROWTH CHARTS • These growth charts are primariy designed for longitudinal follow up of a child(growth monitoring), to interpret the changes over time[2]. NCHS 1977 growth charts CDC 2000 growth charts WHO Growth Charts (2006)
NCHS 1977 growth charts[Hamill et al 1977, 1979] • Using longitudinal-data from the Fels Research Institute, collected in Yellow Springs, Ohio between 1929 and 1975 • Its sample was acknowledged to be quite limited in geographic, cultural, socioeconomic and genetic variability. CDC 2000 growth charts 1. National Health and Nutrition Examination Surveys (NHANES), 2. National Natality Files 3. Natality. Files in Wisconsin and-Missouri, 4. The CDC Pediatric Nutrition Surveillance System, 5. The Fels Research Institute child growth study The primary source of data for the infant charts up to age 6 months was NHANES III.
Table-1 Characteristics of the Fels Research Institute data used for construction of the NCHS 1977 growth charts and the third National Health and Nutrition Examination Survey use for construction of the CDC 2000 growth charts characteristic NCHS 1977(Fels research institute) Location Study design Within a convenient distance of Yellow Springs, Ohio Longitudinal follow up CDC 2000( Third National Health and Nutrition Examination survey) U. S. nationwide, noninstitutionalized population Cross sectional survey Years of data collection 1929 -1975 1988 -1994 Exclusion criteria Triplets excluded VLBW(<1500 g) excluded
characteristic NCHS 1977(Fels research institute) CDC 2000( Third National Health and Nutrition Examination survey) Socio-economic background Middle class Representative of US Racial/ethnic background Caucasian Representative of U. S. matches census distribution for non. Hispanic white, non. Hispanic black, and Mexican American, Other racial groups subject to random variation. Ages Measurements made at Birth, 1, 3 and 6 month Cross-section of population spanning 2 to 6 months of age.
characteristic NCHS 1977(Fels research institute) Infant feeding pattern Nearly all formula fed Anthropometric data quality CDC 2000( Third National Health and Nutrition Examination survey) Currently breastfed (%) Exclusively breast fed(%) 2 mos 56. 3 32. 2 4 mos 37. 3 19. 4 6 mos 27. 9 9. 5 All measurements well-standardized [Lohman et al. 1988] Data quality considered standardized. Data high quality considered high. Large discrepancies between length and stature data have raised questions about the quality of the recumbent length data
Advantages of CDC 2000 Growth Charts • Most importantly the 2000 charts were representative, of all (non-VLBW) infants in the U. S. , not a select group of middle-class. white infants in a, small US community • Extent of breastfeeding in the NHANES III. sample was certainly greater than was the case for the Fels study sample Disadvantage of CDC 2000 Growth Charts • pooling of multiple datasets to construct the curves. • Though great care to ensure the comparability of the datasets being pooled, we cannot rule out, the possibility that the shape of the curves was affected by using different datasets at different ages.
WHO Growth Charts 2006 • In 1993 the World Health Organization (WHO) undertook a comprehensive review of the uses and interpretation of anthropometric references • Did not adequately represent early childhood growth and that new growth curves were necessary. • The World Health Assembly endorsed this recommendation in 1994. • In response WHO undertook the Multicentre Growth Reference Study (MGRS) between 1997 and 2003 to generate new curves for assessing the growth and development of children the world over.
Multicentre Growth Reference Study (MGRS) • Between 1997 and 2003 • longitudinal follow-up from birth to 24 months + cross-sectional survey of children aged 18 to 71 months • Primary growth data and related information were gathered from 8440 healthy breastfed infants and young children from widely diverse ethnic backgrounds and cultural settings
• Healthy children • Living under conditions likely to favor the achievement of their full genetic growth potential • Mothers engaged in fundamental health-promoting practices, namely breastfeeding and not smoking[4]. • The new standards show that growth can be achieved with recommended feeding and health care (e. g. immunizations, care during illness) • The standards can be used anywhere in the world • study also showed that children everywhere grow in similar patterns when their nutrition, health, and care needs are met
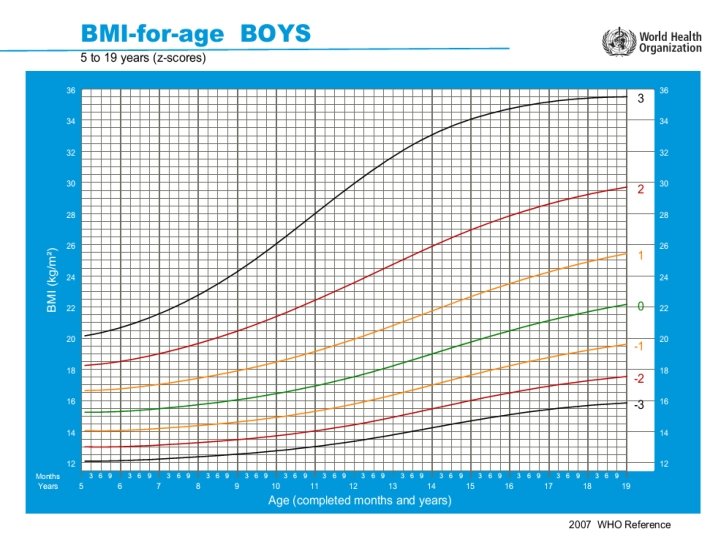
Additional benefits of the new growth standards include the following • The new standards establish breastfed infants as the model for normal growth and development. As a result, health policies and public support for breastfeeding will be strengthened. • The new standards will help better identify stunted and overweight/obese children • New standards such as BMI (body mass index) are useful for measuring the increasing worldwide epidemic of obesity. • Charts that show standard patterns of the expected growth rate over time enable health care providers to identify children at risk of becoming undernourished or overweight early, rather than waiting until a problem level is reached
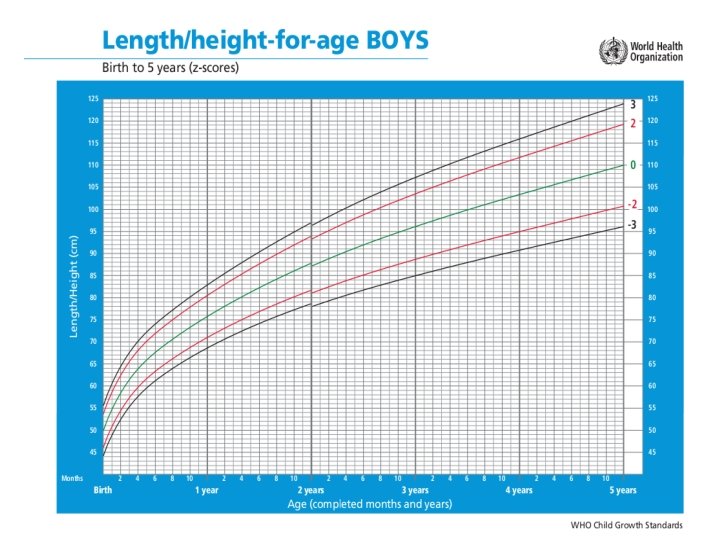
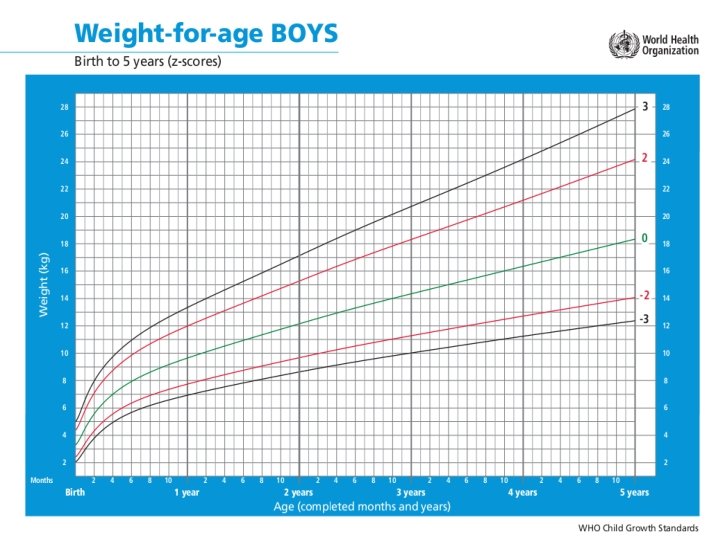
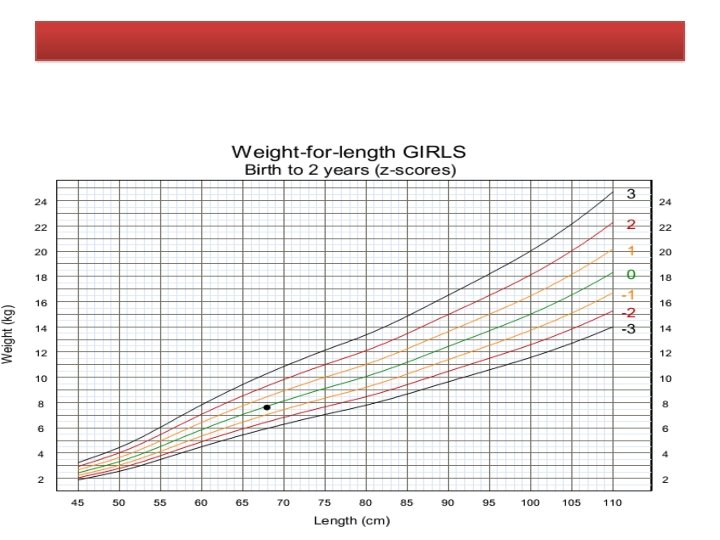
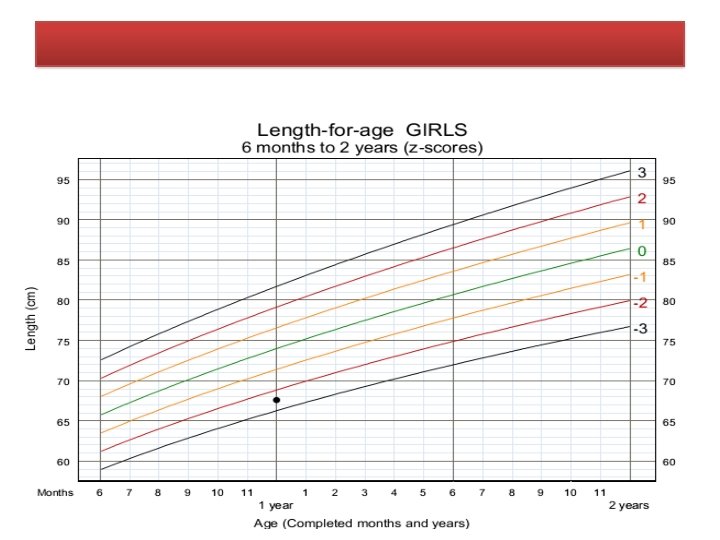
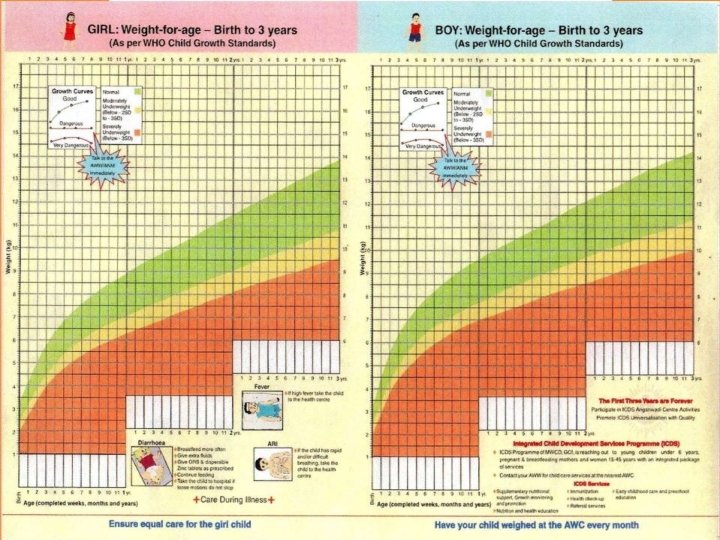
• For the assessment WHO has provided charts for both boys and girls. • Growth indicators are used to assess growth considering a child‘s age and measurements together. length/height-for-age weight-for-length/height BMI (body mass index)-for-age
To plot in Growth charts • x-axis: • In the Growth Record graphs, some x-axes show age and some show length/height. Plot points on vertical lines corresponding to completed age (in weeks, months, or years and months), or to length or height rounded to the nearest whole centimetre. • y-axis: • In the Growth Record graphs, the y-axes show length/height, weight, or BMI. Plot points on or between horizontal lines corresponding to length/height, weight or BMI as precisely as possible • plotted point– the point on a graph where a line extended from a measurement on the x-axis (e. g. age) intersects with a line extended from a measurement on the yaxis (e. g. weight)
To interpret the plotted graph Measurements in the shaded boxes are in the normal range.
• Notes: 1. A child in this range is very tall. Tallness is rarely a problem, unless it is so excessive that it may indicate an endocrine disorder such as a growth-hormone-producing tumor. Refer a child in this range for assessment if you suspect an endocrine disorder (e. g. if parents of normal height have a child who is excessively tall for his or her age). 2. A child whose weight-for-age falls in this range may have a growth problem, but this is better assessed from weight-for-length/height or BMI-for-age. 3. A plotted point above 1 shows possible risk. A trend towards the 2 z-score line shows definite risk. 4. It is possible for a stunted or severely stunted child to become overweight. 5. This is referred to as very low weight in IMCI training modules. (Integrated Management of Childhood Illness, In-service training. WHO, Geneva, 1997).
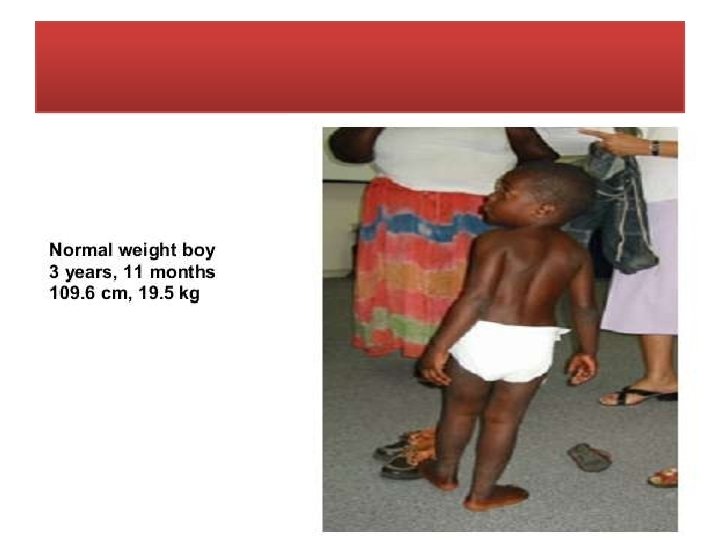
Example 1 Interpretation – A boy Aged 3 years and 11 months. He weighs 19. 5 kg and is 109. 6 cm tall. His weight-for-age is above the 1 z-score line, and his height-for-age is above the 1 z-score line. His weight-for-height, shown on the chart , is in the normal range.
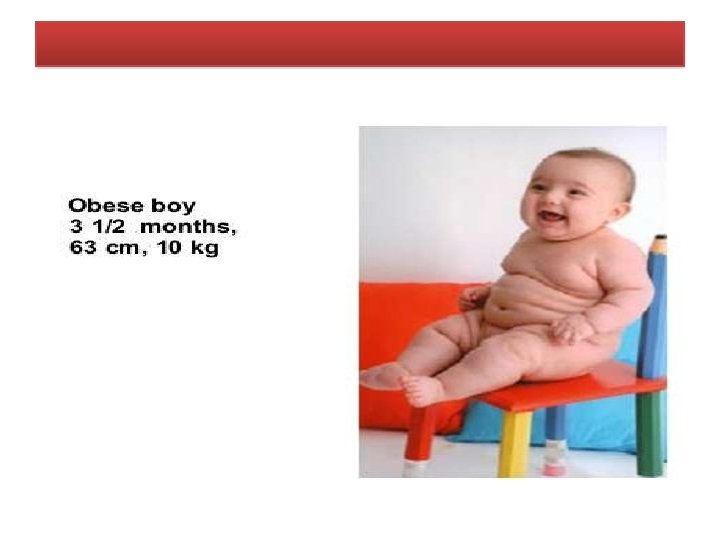
Example 2
Example-3
Example 4
Interpret trends on growth charts When interpreting growth charts, be alert for the following situations, which may indicate a problem or suggest risk: • A child‘s growth line crosses a z-score line. • There is a sharp incline or decline in the child‘s growth line. • • The child‘s growth line remains flat (stagnant); i. e. there is no gain in weight or length/height.
Growth chart used in India • India has adopted the new WHO Child Growth Standards (2006) in February 2009 • These standards are available for both boys and girls below 5 years of age [2]. • A joint "Mother and Child Protection Card" has been developed which provides space for recording [2]: o o o o o family identification and registration Birth record Pregnancy record Institutional identification Care during pregnancy Preparation for delivery Registration under Janani Suraksha Yojana Details about immunization procedures Breast-feeding and introduction of supplementary food Milestones of the baby
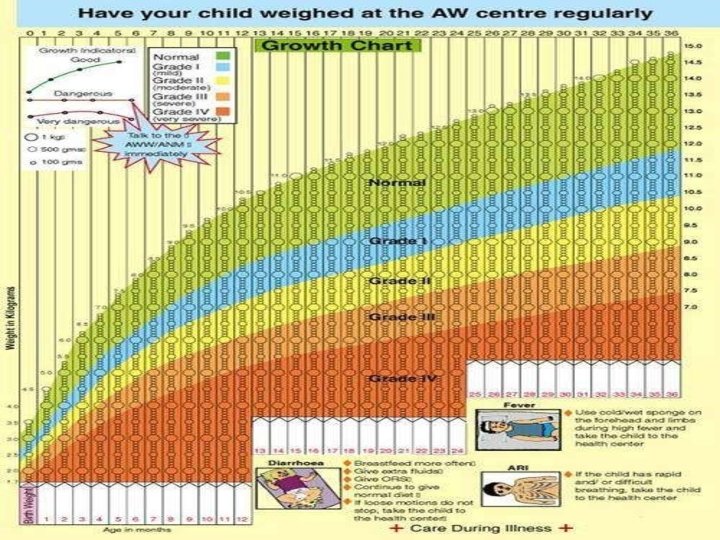
Management • Weight b/w curves 1 & 3 -undernourished, require supplementary feeding at home • • Weight below curve 3 -consult the doctor and follow his advice. • Weight below curve 4 -hospitalized for treatment
Uses of growth charts • Growth monitoring • Diagnostic tool • Planning and policy making • Educational tool • Tool for action • Evaluation • Tool for teaching
WHO Growth charts benefits: • Seen as ‗gold standard‘ of growth charts in terms of promoting good health outcomes, including across cultures. • Establishes breastfeeding as the biological norm. • More suitable to the aboriginal population as the infants, especially in remote communities, are predominantly brestfed • Have greater capacity to assist the early identification of development of overweight
Limitations • Donot reflect current feeding practices. • The rapid weight gain demonstrated in the breastfed infants first six months may not be appropriate for all breastfed babies May inadvertently discourage exclusive breastfeeding • Slower than expected growth rates may be interpreted as neglect especially in aboriginal communities
Implications for diagnosing over or underweight children The CDC 2000 charts and the WHO 2006 charts produce slightly different curves for children at different age points • More children could be assessed as underweight prior to six months of age and less after six months of age by using the WHO 2006 charts compared to the CDC 2000 charts. • Breast fed infants may track well against the CDC reference for the fisrt four to six months of life but poorly after the first four to six months • Mothers of breast fed babies who do not show the rapid growth rates in the WHO 2006 model in the first two to four months may also be at greater risk of introducing complimentary feeding at an early age.
Considerations Reference versus standard • Previous growth charts were established as reference points to which health professionals and parents could compare the growth of individual children. This distinction is important in the assessment of which growth chart is the most appropriate to a given population • A growth reference describes the growth of a sample of individuals who are representative of the genereal population, without making any association with health(CDC charts) • A standard, on the other hand, describes the growth of a healthy population and provides a reference to which all populations can aspire. (WHO charts)
Considerations Effectiveness of growth charts: • To what exatent does growth monitoring results in positive health out comes for children. -systematic review of studies in developing countries which compared the health outcomes of children whose growth was monitores using standardized charts to those of children not monitored in this way, found no difference in outcomes for the two groups. • Growth is an individual process. Individual do not grow according to statistical distributions of size and age • The wide range with in normal growth patterns is not always well understood by health professionals or parents leading to unnecessary anxiety for parents and the possibility of ceasing breastfeeding too soon, or of overfeeding
Considerations Maternal perceptions • The effectiveness of using growth depends on the knowledge and understanding that mothers have pf growth charts and the value that mothers place on them. • Researchers have found that mothers do not always define their childrens growth patterns according to the standards set by growth charts or by the health professionals who use them • Parents perceptions of the ideal weight for their children is culturally embedded.
Conclusion • No existing Growth chart is a perfect match in Indian context • The CDC 2000 and WHO 2006 growth charts both have their benefits and Limitations – Indian breast feeding practices, birth weight, multicultural population mix. • CDC recommends The WHO growth standard charts should be used for children younger than 2. The CDC 2000 growth reference charts should be used for children aged 2 through 19 years, because these charts can be used continuously up to age 20 • Growth assessments that are not supported by appropriate response programmes are not effective in improving child health.