Pie Charts Foundation GCSE Questions These questions are


- Slides: 15
Pie Charts – Foundation – GCSE Questions These questions are the same format as previous GCSE exams. COPY means they use the exact same numbers as the original GCSE question. Otherwise, they are clone questions using different numbers. The worksheets are provided in a variety of sizes.
Printing To print handouts from slides Select the slide from the left. Then click: File > Print > ‘Print Current Slide’ To print multiple slides Click on a section title to highlight all those slides, or press ‘Ctrl’ at the same time as selecting slides to highlight more than one. Then click: File > Print > ‘Print Selection’ To print double-sided handouts Highlight both slides before using ‘Print Selection’. Choose ‘Print on Both Sides’ and ‘Flip on Short Edge’.
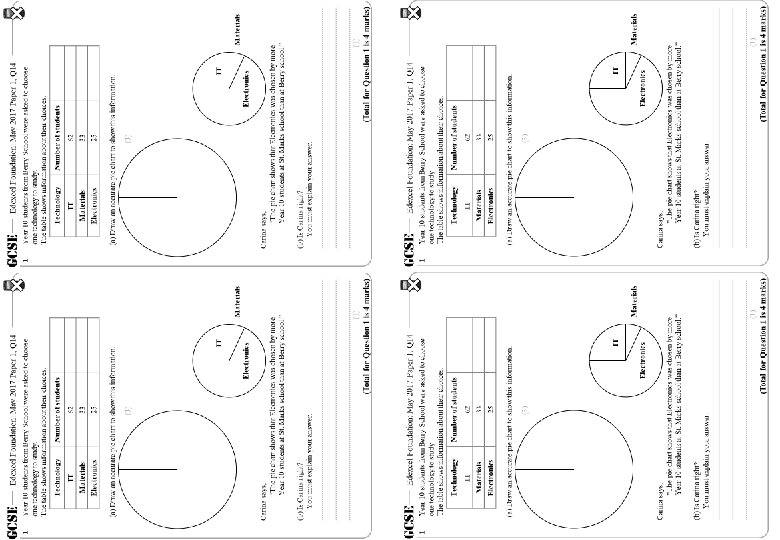
GCSE 1 GCSE Edexcel Foundation: May 2017 Paper 1, Q 14 1 Year 10 students from Berry School were asked to choose one technology to study. The table shows information about their choices. Edexcel Foundation: May 2017 Paper 1, Q 14 Year 10 students from Berry School were asked to choose one technology to study. The table shows information about their choices. Technology Number of students IT 62 Materials 33 Electronics 25 (a) Draw an accurate pie chart to show this information. (3) Year 10 students from St Marks school were also asked to choose one technology to study. This accurate pie chart shows information about their choices. IT IT Materials Electronics Carina says, “The pie chart shows that Electronics was chosen by more Year 10 students at St. Marks school than at Berry school. ” (b) Is Carina right? You must explain your answer. (1) (Total for Question 1 is 4 marks)
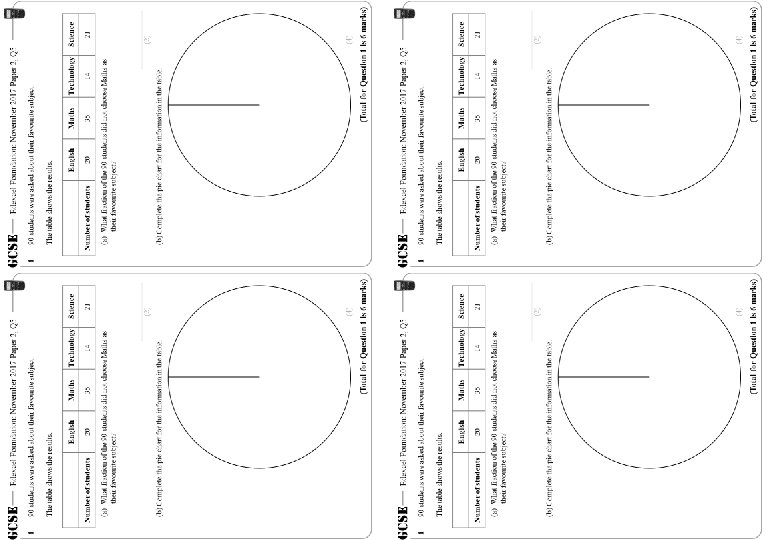
GCSE 1 GCSE Edexcel Foundation: November 2017 Paper 2, Q 5 90 students were asked about their favourite subject. 1 The table shows the results. Number of students Edexcel Foundation: November 2017 Paper 2, Q 5 90 students were asked about their favourite subject. The table shows the results. English Maths Technology Science 20 35 14 21 (a) What fraction of the 90 students did not choose Maths as their favourite subject? Number of students English Maths Technology Science 20 35 14 21 (a) What fraction of the 90 students did not choose Maths as their favourite subject? (2) (b) Complete the pie chart for the information in the table. (4) (Total for Question 1 is 6 marks)
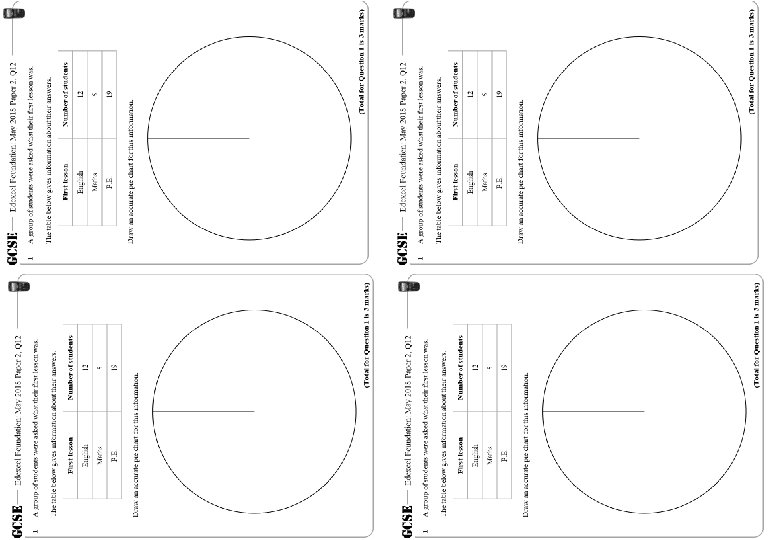
GCSE 1 Edexcel Foundation: May 2018 Paper 2, Q 12 A group of students were asked what their first lesson was. The table below gives information about their answers. First lesson Number of students English 12 Maths 5 P. E. 19 Draw an accurate pie chart for this information. (Total for Question 1 is 3 marks)
GCSE 1 Edexcel Foundation: May 2017 Paper 1, Q 14 Year 10 students from Berry School were asked to choose one technology to study. The table shows information about their choices. Technology Number of students IT 62 Materials 33 Electronics 25 (a) Draw an accurate pie chart to show this information. (3) Year 10 students from St Marks school were also asked to choose one technology to study. This accurate pie chart shows information about their choices. IT Materials Electronics Carina says, “The pie chart shows that Electronics was chosen by more Year 10 students at St. Marks school than at Berry school. ” (b) Is Carina right? You must explain your answer. (1) (Total for Question 1 is 4 marks)
GCSE 1 Edexcel Foundation: November 2017 Paper 2, Q 5 90 students were asked about their favourite subject. The table shows the results. Number of students English Maths Technology Science 20 35 14 21 (a) What fraction of the 90 students did not choose Maths as their favourite subject? (2) (b) Complete the pie chart for the information in the table. (4) (Total for Question 1 is 6 marks)
GCSE 1 Edexcel Foundation: May 2018 Paper 2, Q 12 A group of students were asked what their first lesson was. The table below gives information about their answers. First lesson Number of students English 12 Maths 5 P. E. 19 Draw an accurate pie chart for this information. (Total for Question 1 is 3 marks)
GCSE 1 Edexcel Foundation: May 2017 Paper 1, Q 14 Year 10 students from Berry School were asked to choose one technology to study. The table shows information about their choices. Technology Number of students Angle Size IT 62 62 × 3 = 186° Materials 33 33 × 3 = 99° Electronics 25 25 × 3 = 75° 120 (a) Draw an accurate pie chart to show this information. (3) Electronics 25 students Materials 33 students IT 62 students Year 10 students from St Marks school were also asked to choose one technology to study. This accurate pie chart shows information about their choices. IT Materials Electronics Carina says, “The pie chart shows that Electronics was chosen by more Year 10 students at St. Marks school than at Berry school. ” (b) Is Carina right? You must explain your answer. The pie chart only shows the proportion that chose electronics, not the actual number. She is incorrect because you do not have the information. (1) (Total for Question 1 is 4 marks)
GCSE 1 Edexcel Foundation: November 2017 Paper 2, Q 5 90 students were asked about their favourite subject. The table shows the results. Number of students English Maths Technology Science 20 35 14 21 (a) What fraction of the 90 students did not choose Maths as their favourite subject? 90 – 35 = 55 did not choose maths. 90 English: 20 x 4° = 80° (2) (b) Complete the pie chart for the information in the table. Science 21 students Technology 14 students English 20 students Maths 35 students (4) (Total for Question 1 is 6 marks) Maths: 35 x 4° = 140° Tech: 14 x 4° = 56° Science: 21 x 4° = 84°
GCSE 1 Edexcel Foundation: May 2018 Paper 2, Q 12 A group of students were asked what their first lesson was. The table below gives information about their answers. First lesson Number of students English 12 12 x 10° = 120° 5 5 x 10° = 50° 19 19 x 10° = 190° Maths P. E. 36 in total Draw an accurate pie chart for this information. 360 ÷ 36 = 10°, so 1 person = 10° P. E. 19 students English 12 students Maths 5 students (Total for Question 1 is 3 marks)
Questions? Comments? Suggestions? …or have you found a mistake!? Any feedback would be appreciated . Please feel free to email: tom@goteachmaths. co. uk