Pie Charts Foundation GCSE Questions AQA These questions


- Slides: 15
Pie Charts – Foundation – GCSE Questions – AQA These questions are the same format as previous GCSE exams. COPY means they use the exact same numbers as the original GCSE question. Otherwise, they are clone questions using different numbers. The worksheets are provided in 2 sizes.
Printing To print handouts from slides Select the slide from the left. Then click: File > Print > ‘Print Current Slide’ To print multiple slides Click on a section title to highlight all those slides, or press ‘Ctrl’ at the same time as selecting slides to highlight more than one. Then click: File > Print > ‘Print Selection’ To print double-sided handouts Highlight both slides before using ‘Print Selection’. Choose ‘Print on Both Sides’ and ‘Flip on Short Edge’.
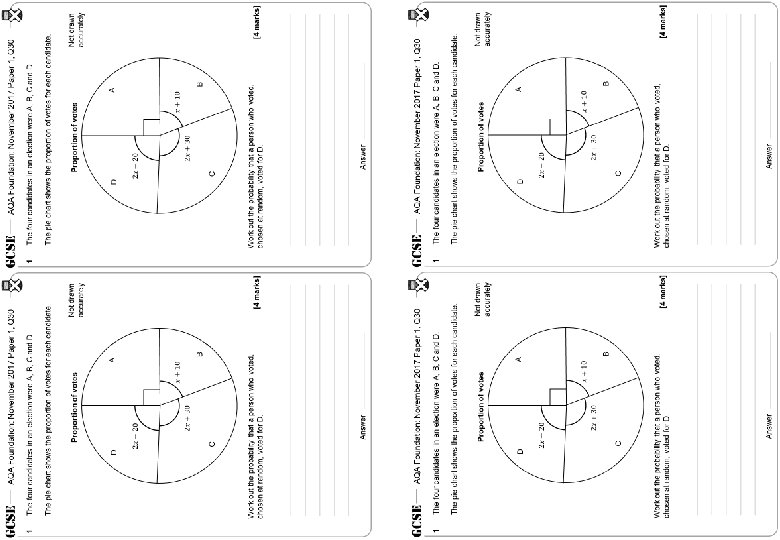
AQA Foundation: November 2017 Paper 1, Q 30 1 The four candidates in an election were A, B, C and D. 1 The pie chart shows the proportion of votes for each candidate. The four candidates in an election were A, B, C and D. The pie chart shows the proportion of votes for each candidate. Not drawn accurately Proportion of votes A D AQA Foundation: November 2017 Paper 1, Q 30 A D Not drawn accurately Proportion of votes B C Work out the probability that a person who voted, chosen at random, voted for D. Answer [4 marks]
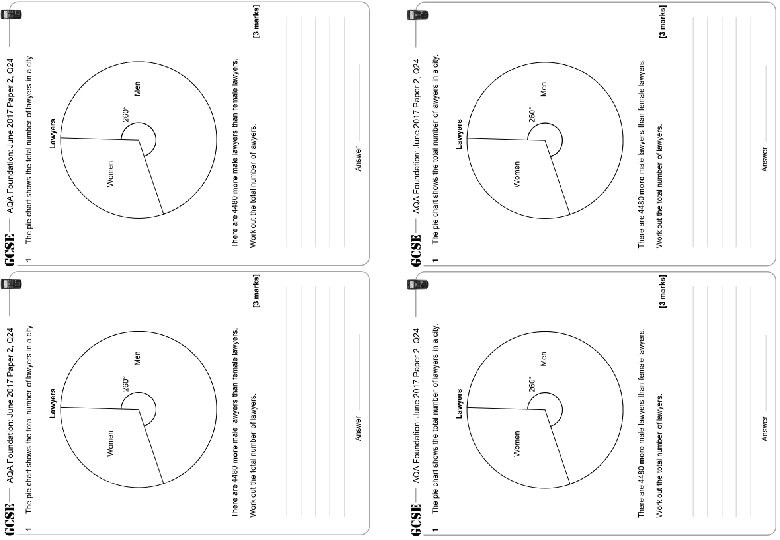
AQA Foundation: June 2017 Paper 2, Q 24 1 AQA Foundation: June 2017 Paper 2, Q 24 The pie chart shows the total number of lawyers in a city. 1 The pie chart shows the total number of lawyers in a city. Lawyers Women 260° Men There are 4480 more male lawyers than female lawyers. Work out the total number of lawyers. Answer There are 4480 more male lawyers than female lawyers. [3 marks] Work out the total number of lawyers. Answer [3 marks]
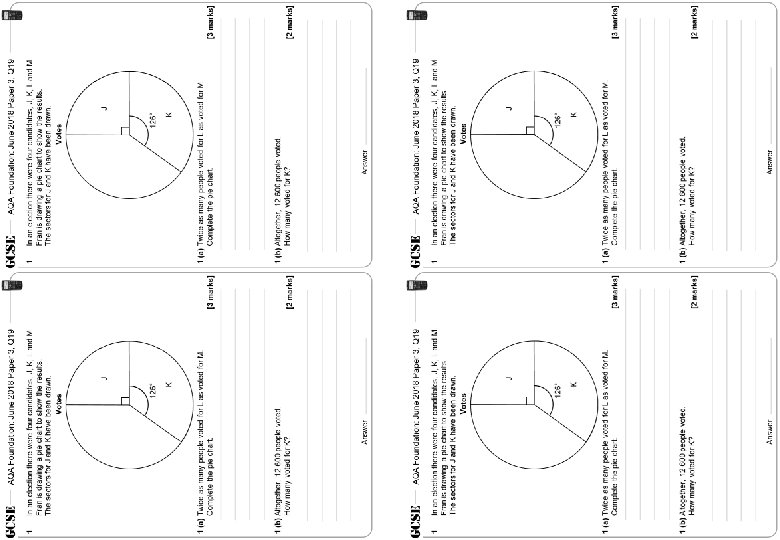
AQA Foundation: June 2018 Paper 3, Q 19 1 AQA Foundation: June 2018 Paper 3, Q 19 In an election there were four candidates, J, K, L and M. Fran is drawing a pie chart to show the results. The sectors for J and K have been drawn. Votes 1 In an election there were four candidates, J, K, L and M. Fran is drawing a pie chart to show the results. The sectors for J and K have been drawn. Votes J J # # 126° K K 1 (a) Twice as many people voted for L as voted for M. Complete the pie chart. 1 (b) Altogether, 12 600 people voted. How many voted for K? Answer [3 marks] 1 (a) Twice as many people voted for L as voted for M. Complete the pie chart. [3 marks] [2 marks] 1 (b) Altogether, 12 600 people voted. How many voted for K? [2 marks] Answer
AQA Foundation: November 2017 Paper 1, Q 30 1 The four candidates in an election were A, B, C and D. The pie chart shows the proportion of votes for each candidate. Not drawn accurately Proportion of votes A D B C Work out the probability that a person who voted, chosen at random, voted for D. Answer [4 marks]
AQA Foundation: June 2017 Paper 2, Q 24 1 The pie chart shows the total number of lawyers in a city. Lawyers Women 260° Men There are 4480 more male lawyers than female lawyers. Work out the total number of lawyers. Answer [3 marks]
AQA Foundation: June 2018 Paper 3, Q 19 1 In an election there were four candidates, J, K, L and M. Fran is drawing a pie chart to show the results. The sectors for J and K have been drawn. Votes J # 126° K 1 (a) Twice as many people voted for L as voted for M. Complete the pie chart. [3 marks] 1 (b) Altogether, 12 600 people voted. How many voted for K? [2 marks] Answer
AQA Foundation: November 2017 Paper 1, Q 30 1 The four candidates in an election were A, B, C and D. The pie chart shows the proportion of votes for each candidate. Not drawn accurately Proportion of votes A D B C Work out the probability that a person who voted, chosen at random, voted for D. [4 marks] Answer
AQA Foundation: June 2017 Paper 2, Q 24 1 The pie chart shows the total number of lawyers in a city. Lawyers Women 160° 100° 260° Men 100° There are 4480 more male lawyers than female lawyers. Work out the total number of lawyers. [3 marks] 160° = 4480 lawyers Answer 10, 080
AQA Foundation: June 2018 Paper 3, Q 19 1 In an election there were four candidates, J, K, L and M. Fran is drawing a pie chart to show the results. The sectors for J and K have been drawn. Votes M L 48° 96° J # 126° L : M 2 : 1 = 3 1 (a) Twice as many people voted for L as voted for M. K Complete the pie chart. [3 marks] 360 – 90 – 126 = 144 ÷ 3 = 48° per part 1 (b) Altogether, 12 600 people voted. How many voted for K? L : M 96° : 48° [2 marks] 35 people for 1° 35 × 126 = 4410 Answer 4410
Questions? Comments? Suggestions? …or have you found a mistake!? Any feedback would be appreciated . Please feel free to email: tom@goteachmaths. co. uk