Pie Charts Higher GCSE Questions These questions are


- Slides: 9
Pie Charts – Higher – GCSE Questions These questions are the same format as previous GCSE exams. COPY means they use the exact same numbers as the original GCSE question. Otherwise, they are clone questions using different numbers. The worksheets are provided in a variety of sizes. IMPORTANT! This worksheet relies on accurate scales. See next slide for printing instructions.
IMPORTANT! This worksheet relies on accurate scales. When printing, ensure ‘Scale to Fit Paper’ is deselected. Click: ‘Full Page Slides’ > Deselect ‘Scale to Fit Paper’
Printing To print handouts from slides Select the slide from the left. Then click: File > Print > ‘Print Current Slide’ To print multiple slides Click on a section title to highlight all those slides, or press ‘Ctrl’ at the same time as selecting slides to highlight more than one. Then click: File > Print > ‘Print Selection’ To print double-sided handouts Highlight both slides before using ‘Print Selection’. Choose ‘Print on Both Sides’ and ‘Flip on Short Edge’.
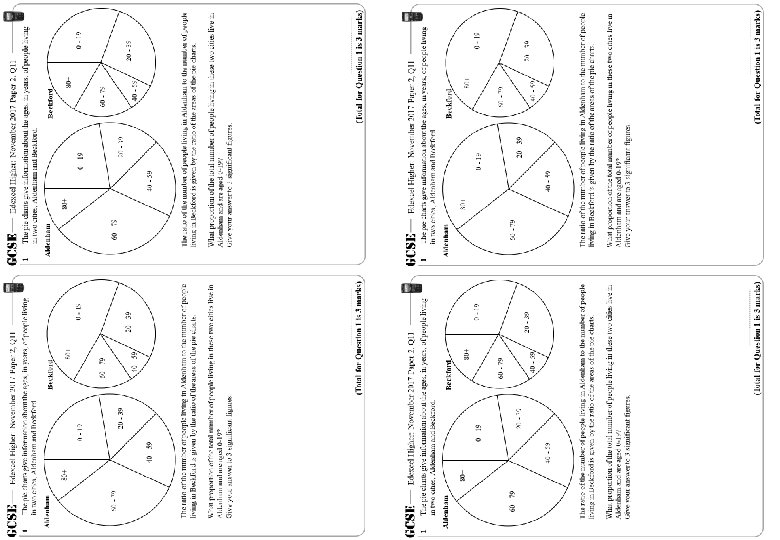
GCSE 1 GCSE Edexcel Higher: November 2017 Paper 2, Q 11 The pie charts give information about the ages, in years, of people living in two cities, Aldenham and Beckford. Aldenham Beckford 80+ 1 Edexcel Higher: November 2017 Paper 2, Q 11 Beckford 80+ 80+ 0 - 19 60 - 79 20 - 39 40 - 59 0 - 19 20 - 39 40 - 59 The ratio of the number of people living in Aldenham to the number of people living in Beckford is given by the ratio of the areas of the pie charts. What proportion of the total number of people living in these two cities live in Aldenham and are aged 0 -19? Give your answer to 3 significant figures. (Total for Question 1 is 3 marks)
GCSE 1 Edexcel Higher: November 2017 Paper 2, Q 11 The pie charts give information about the ages, in years, of people living in two cities, Aldenham and Beckford. Aldenham Beckford 80+ 0 - 19 60 - 79 20 - 39 40 - 59 The ratio of the number of people living in Aldenham to the number of people living in Beckford is given by the ratio of the areas of the pie charts. What proportion of the total number of people living in these two cities live in Aldenham and are aged 0 -19? Give your answer to 3 significant figures. (Total for Question 1 is 3 marks)
GCSE 1 Edexcel Higher: November 2017 Paper 2, Q 11 The pie charts give information about the ages, in years, of people living in two cities, Aldenham and Beckford. Aldenham Radius = 3. 4 Beckford 80+ 0 - 19 80° 60 - 79 20 - 39 40 - 59 Radius = 2. 8 The ratio of the number of people living in Aldenham to the number of people living in Beckford is given by the ratio of the areas of the pie charts. What proportion of the total number of people living in these two cities live in Aldenham and are aged 0 -19? Give your answer to 3 significant figures. Aldenham Area = π x 3. 42 = 36. 3168… Beckford Area = π x 2. 82 = 24. 63008… Total Area = 60. 94687 13. 2% (Total for Question 1 is 3 marks) Standard
GCSE 1 Edexcel Higher: November 2017 Paper 2, Q 11 The pie charts give information about the ages, in years, of people living in two cities, Aldenham and Beckford. Aldenham Radius = 2. 3 Beckford 80+ 0 - 19 80° 60 - 79 20 - 39 40 - 59 Radius = 1. 9 The ratio of the number of people living in Aldenham to the number of people living in Beckford is given by the ratio of the areas of the pie charts. What proportion of the total number of people living in these two cities live in Aldenham and are aged 0 -19? Give your answer to 3 significant figures. Aldenham Area = π x 2. 32 = 16. 619… Beckford Area = π x 1. 92 = 11. 3411… Total Area = 27. 960… 13. 2% (Total for Question 1 is 3 marks) Small
Questions? Comments? Suggestions? …or have you found a mistake!? Any feedback would be appreciated . Please feel free to email: tom@goteachmaths. co. uk