Chapter 6 Part 2 SPC Attribute Control Charts

Chapter 6 - Part 2 SPC – Attribute Control Charts

Types of Control Charts · Attribute charts Monitor fraction of defective units · Monitor number of defects · Difference between “defective unit” and a “defect? ” · · · A defective unit is a unit that is either defective. A defect is flaw on a given unit of a product. A unit can have many defects. A defective unit may be defined as, for example, a unit that has 3 or more defects.

Types of Control Charts · Variables charts Monitors continuous quality characteristics. · Continuous values (variables data) can theoretically assume an infinite number of values in some interval. · · · Time Weight Ounces Diameter

Types of Control Chart Attribute control charts Monitors p chart Process fraction defective c chart number of defects per unit u chart Variables control charts X-bar chart Process mean R chart (Range Chart) Process variability

Use of p-Charts · When observations can be placed into two categories. · Good or bad · Pass or fail · Operate or doesn’t operate

p-chart A company that makes light bulbs wants to monitor the fraction of defective bulbs. · The company decides to select a random sample of 100 bulbs in each day over a 5 day period · Each of the 100 bulbs are tested to determine if they light up. ·

p-chart If a bulb does not light up, the bulb is defective. · The company wants to · Estimate the percentage of defective bulbs and · Determine if the percentage of defective bulbs is increasing over time. · · A p chart is the appropriate tool for providing the company with this information.
 =")
Notation · Sample size = n = 100 · Number of samples (subgroups) = k = 5 · X = number of defective bulbs in a sample · p = sample fraction defective = ? ? ? · p-bar = estimated process fraction defective · P = process fraction defective (unknown) · p-bar is an estimate of P

Inspection Results

Compute p and p-bar
")
p-bar (Estimated Process Fraction Defective)

p-Chart Control Limits

p-Chart - Control Limits
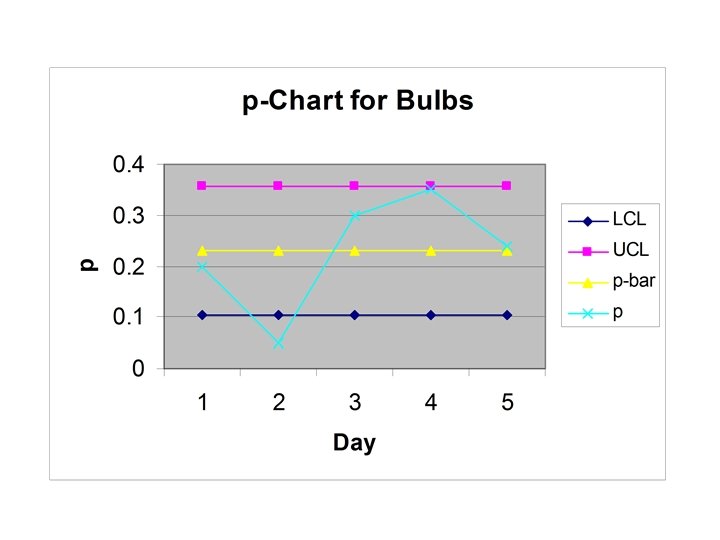

Interpretation The estimated fraction of defective bulbs produced is. 23. · On Day 2, p was below the LCL. · This means that a special cause occurred on that day to cause the process to go out of control. · The special cause shifted the process fraction defective downward. · This special cause was therefore favorable and should be ? ? ? ·

Interpretation After Day 2, the special cause lost its impact because on Day 4, the process appears to be back in control and at old fraction defective of. 23. · Until the special cause is identified and made part of the process, the process will be unstable and unpredictable. · It is therefore impossible to obtain a statistical valid estimate of the process fraction defective because it can change from day to day. ·
 upward P Sampling Distribution")
Trend Within Control Limits Process fractions defective is shifting (trending) upward P Sampling Distribution P UCL p-Chart LCL P P P = process fraction defective

Applications · Think of an application of a p-chart in: · Sales · Shipping · Law department

Use of c-Charts · When we are interested in monitoring number of defects on a given unit of product or service. Scratches, chips, dents on an airplane wing · Errors on an invoice · Pot holes on a 5 -mile section of highway · Complaints received per day · · Opportunity for a defect must be infinite. · Probability of a defect on any one location or any one point in time must be small.

c-Chart c-chart notation: c = number of defects k = number of samples

c-Chart A car company wants to monitor the number of paint defects on a certain new model of one of its cars. • Each day one car in inspected. • The results after 5 days are shown on the next slide. ·

c-Chart

c-Chart - Mean

c-Chart – Control Limits

c-Chart – Control Limits
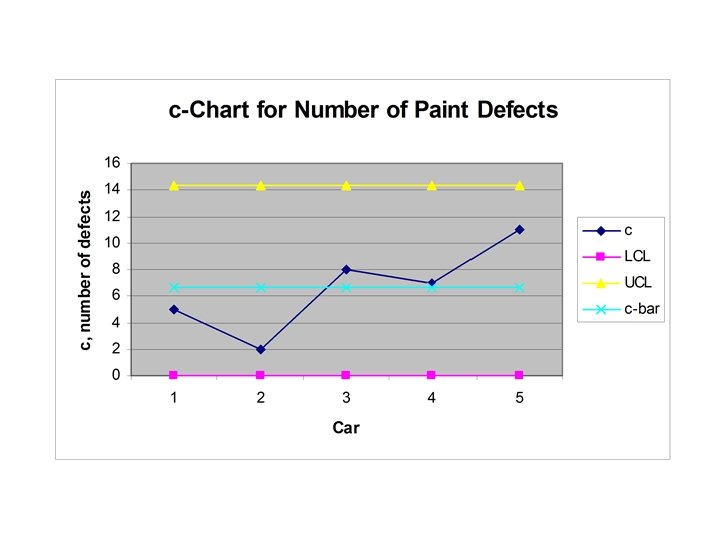

Conclusion Process shows upward trend. · Even though trend is within the control limits, the process is out of control. · Mean is shifting upward · This is due to an unfavorable special cause. · Must identify special cause and eliminate it from process. · Who is responsible for finding and eliminating special cause? ·

Mini Case · Think of an application of a c-chart bank.

u-Chart · With a c chart, the sample size is one unit. · A u-chart is like a c-chart, except that the sample size is greater than one unit. · As a result, a u-chart tracks the number of defects per unit. · A c-chart monitors the number of defects on one unit.

u-Chart ·A car company monitors the number of paint defects per car by taking a sample of 5 cars each day over the next 6 days. · The results are shown on next side.

u-Chart

u-Chart

u-Chart

u-Chart

u-Chart

Conclusion The process appears stable. · We can therefore get a statistically valid estimate the process mean number of defects per car. · Our estimate of the mean number of paint defects per car is 10. 5, the center line on the control chart. · Thus, we expect each car to have, on average, 10. 5 paint defects. ·

Conclusion Although the process is stable, the number of defects per car is too high. · Deming calls this a stable process for the production of defective product. · Important take away: · A stable process (process in control) is not necessarily a good process because it can be in control at the wrong level. · A stable process is predictable, but this doesn’t mean that what is being predicted is favorable. ·

Mini Case · Who is responsible for improving this process? · What is required to improve the process?

u-Chart vs. c-Chart If n = 1, u = c and Control limits of the two chart will therefore be the same.

Sample Size Control Chart When To Use Sample Size p-Chart Monitor the proportion of defectives in a process At least 50 c-Chart Monitor the number of defects 1 u-chart Monitor the number of defects per unit >1

In Practice You need 25 to 30 samples before computing initial control limits. · When a special cause occurs, you should eliminate that sample and re-compute control limits if · Special cause is identified · Eliminated or made part of process · To identify special causes, workers must keep log sheet, where they record any changes they make to the process. ·

Tracking Improvements UCL LCL Process centered Process not centered and stable and not stable UCL LCL Additional improvements made to the process
- Slides: 42