OSDI 12 Graph Chi LargeScale Graph Computation on





- Slides: 50
OSDI’ 12 Graph. Chi: Large-Scale Graph Computation on Just a PC Aapo Kyrölä (CMU) Guy Blelloch (CMU) Carlos Guestrin (UW) In co-operation with the Graph. Lab team.
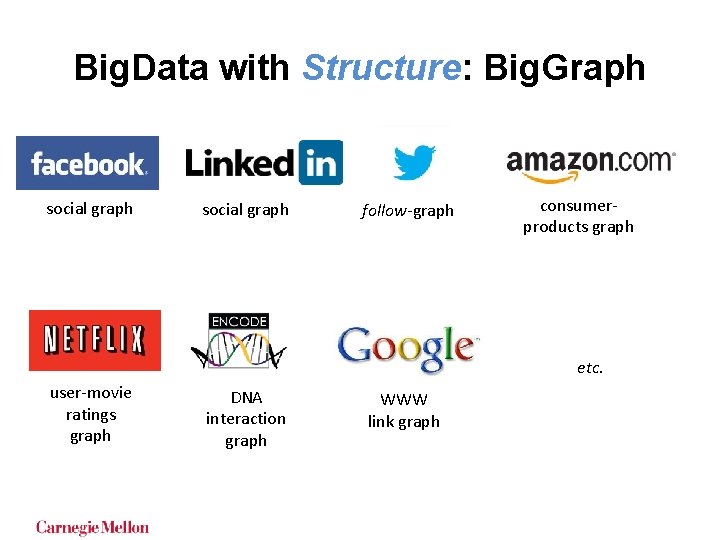
Big. Data with Structure: Big. Graph social graph follow-graph consumerproducts graph etc. user-movie ratings graph DNA interaction graph WWW link graph
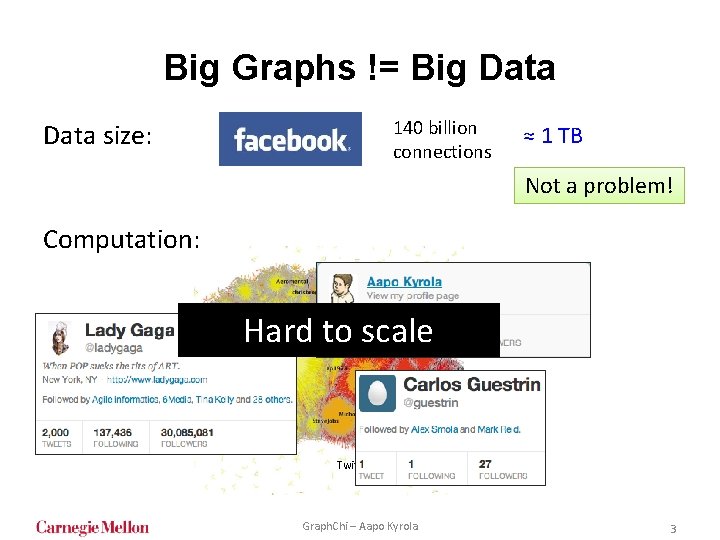
Big Graphs != Big Data size: 140 billion connections ≈ 1 TB Not a problem! Computation: Hard to scale Twitter network visualization, by Akshay Java, 2009 Graph. Chi – Aapo Kyrola 3
Could we compute Big Graphs on a single machine? Disk-based Graph Computation Can’t we just use the Cloud?
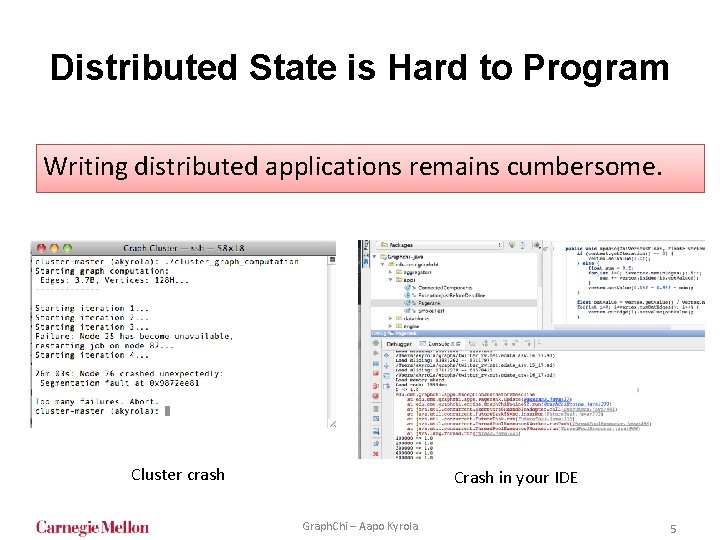
Distributed State is Hard to Program Writing distributed applications remains cumbersome. Cluster crash Crash in your IDE Graph. Chi – Aapo Kyrola 5
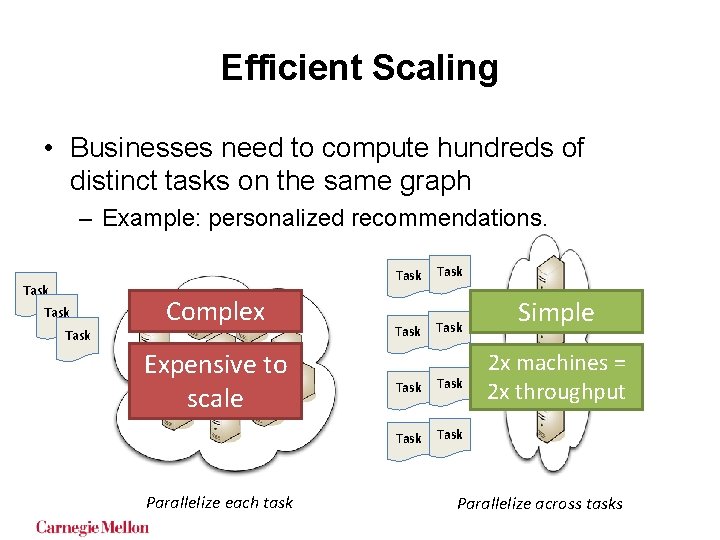
Efficient Scaling • Businesses need to compute hundreds of distinct tasks on the same graph – Example: personalized recommendations. Task Complex Expensive to scale Parallelize each task Task Task Simple 2 x machines = 2 x throughput Parallelize across tasks
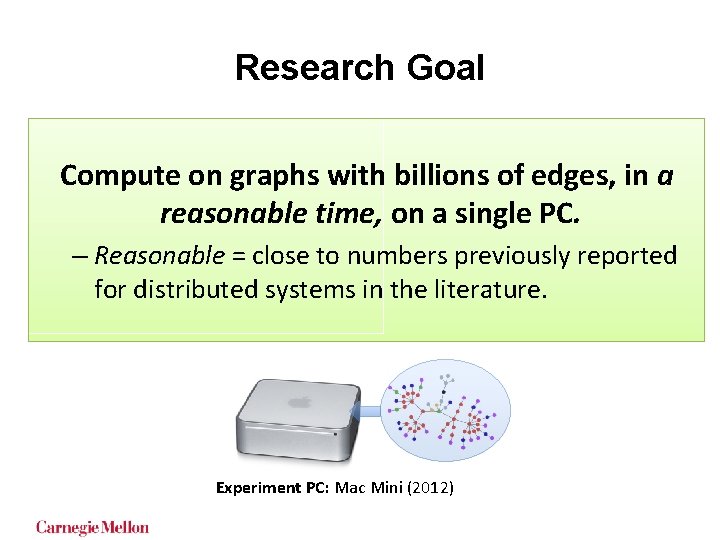
Research Goal Compute on graphs with billions of edges, in a reasonable time, on a single PC. – Reasonable = close to numbers previously reported for distributed systems in the literature. Experiment PC: Mac Mini (2012)
Computational Model Graph. Chi – Aapo Kyrola 9
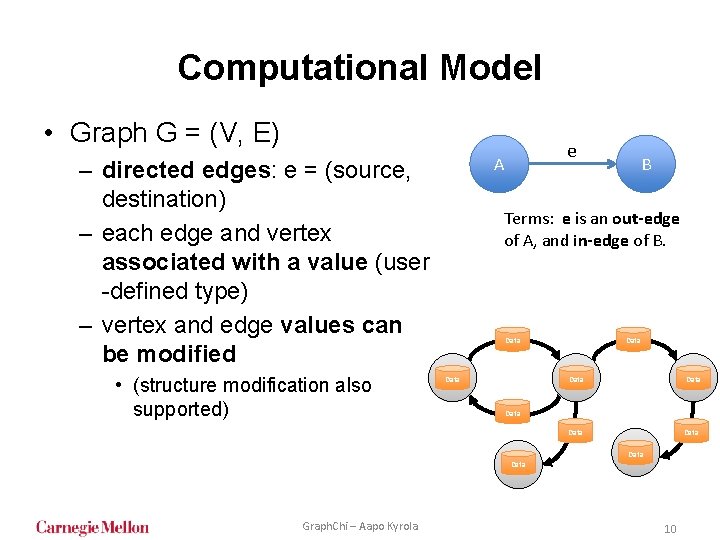
Computational Model • Graph G = (V, E) – directed edges: e = (source, destination) – each edge and vertex associated with a value (user -defined type) – vertex and edge values can be modified • (structure modification also supported) e A B Terms: e is an out-edge of A, and in-edge of B. Data Data Data Graph. Chi – Aapo Kyrola 10
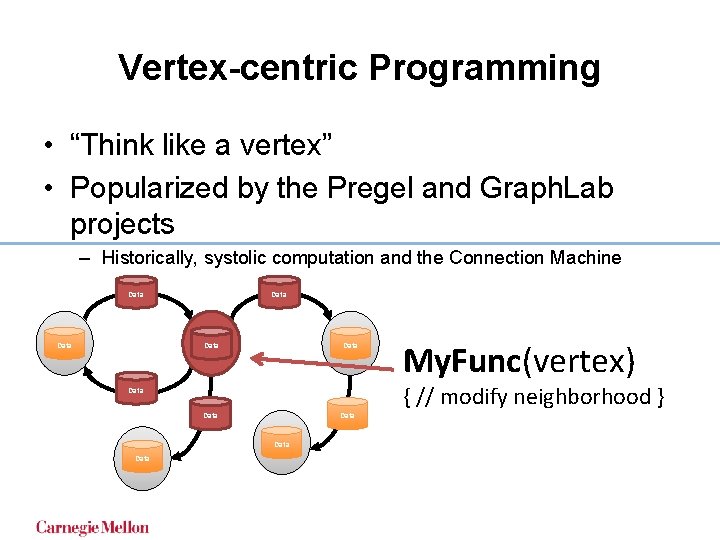
Vertex-centric Programming • “Think like a vertex” • Popularized by the Pregel and Graph. Lab projects – Historically, systolic computation and the Connection Machine Data Data { // modify neighborhood } Data Data My. Func(vertex)
The Main Challenge of Disk-based Graph Computation: Random Access
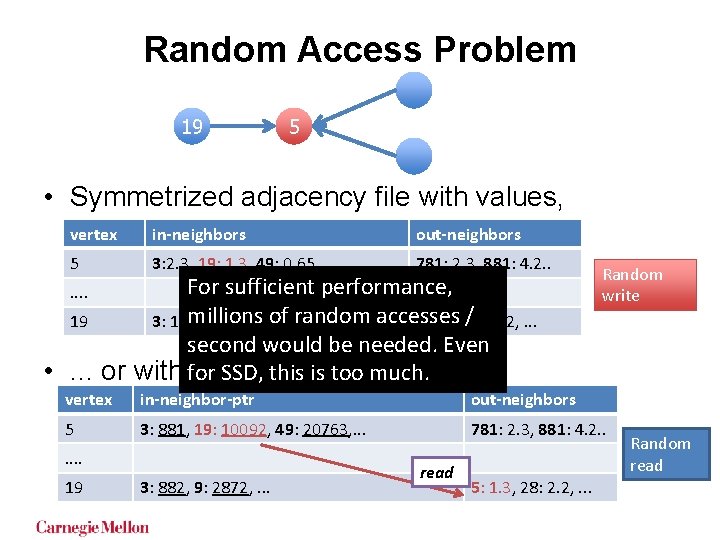
Random Access Problem 19 5 • Symmetrized adjacency file with values, vertex in-neighbors out-neighbors 5 3: 2. 3, 19: 1. 3, 49: 0. 65, . . . 781: 2. 3, 881: 4. 2. . For sufficient performance, synchronize millions / 2. 2, . . . 19 3: 1. 4, 9: 12. 1, . . . of random accesses 5: 1. 3, 28: second would be needed. Even • . . . or with for file. SSD, index this pointers is too much. . . Random write vertex in-neighbor-ptr out-neighbors 5 3: 881, 19: 10092, 49: 20763, . . . 781: 2. 3, 881: 4. 2. . . 19 3: 882, 9: 2872, . . . read 5: 1. 3, 28: 2. 2, . . . Random read
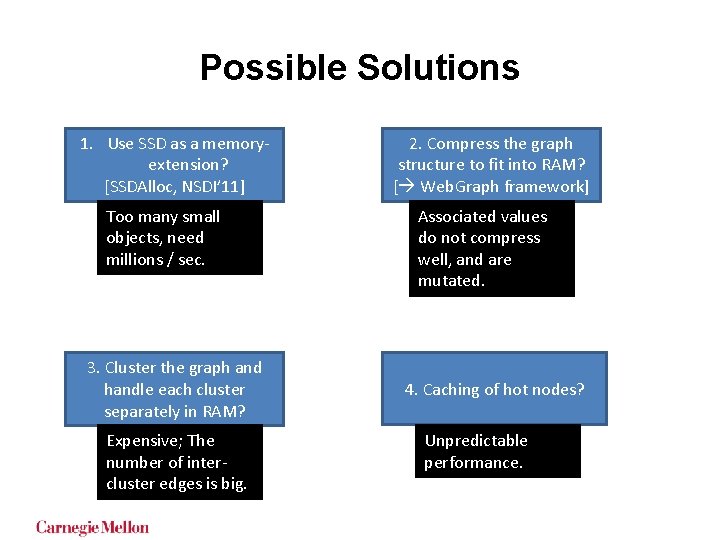
Possible Solutions 1. Use SSD as a memoryextension? [SSDAlloc, NSDI’ 11] Too many small objects, need millions / sec. 3. Cluster the graph and handle each cluster separately in RAM? Expensive; The number of intercluster edges is big. 2. Compress the graph structure to fit into RAM? [ Web. Graph framework] Associated values do not compress well, and are mutated. 4. Caching of hot nodes? Unpredictable performance.
Our Solution Parallel Sliding Windows (PSW)
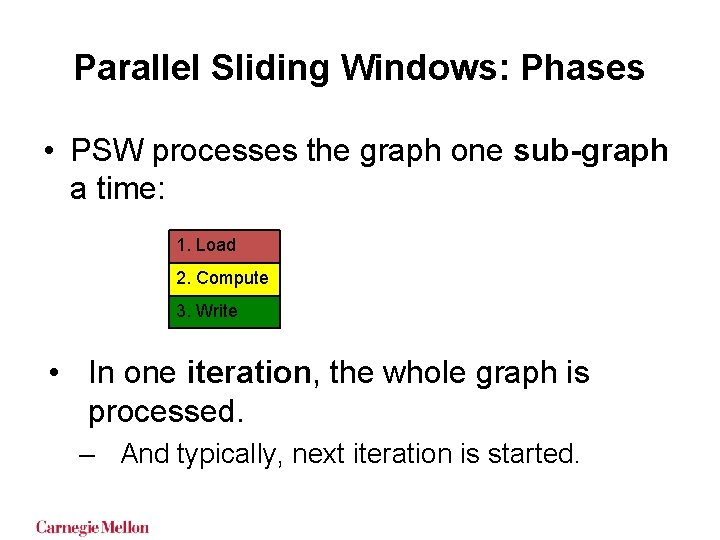
Parallel Sliding Windows: Phases • PSW processes the graph one sub-graph a time: 1. Load 2. Compute 3. Write • In one iteration, the whole graph is processed. – And typically, next iteration is started.
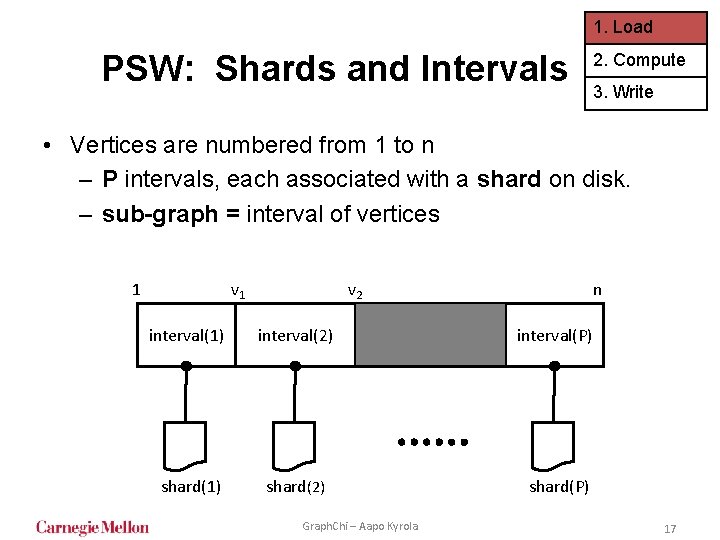
1. Load PSW: Shards and Intervals 2. Compute 3. Write • Vertices are numbered from 1 to n – P intervals, each associated with a shard on disk. – sub-graph = interval of vertices 1 v 2 n interval(1) interval(2) interval(P) shard(1) shard(2) shard(P) Graph. Chi – Aapo Kyrola 17
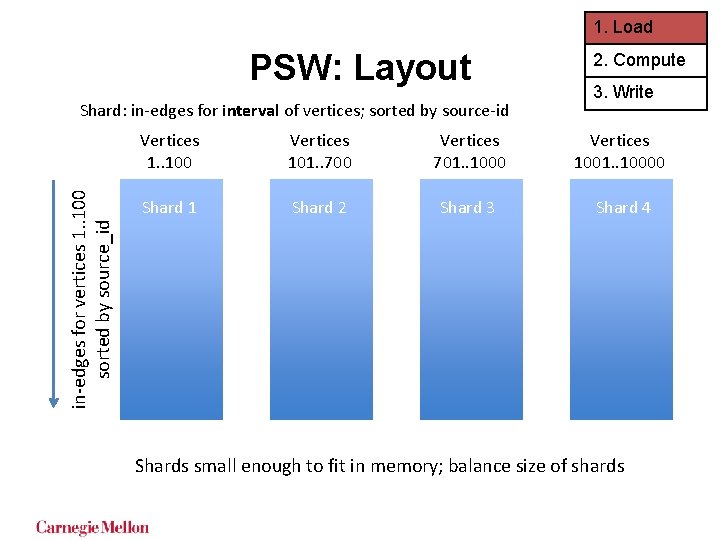
1. Load PSW: Layout in-edges for vertices 1. . 100 sorted by source_id Shard: in-edges for interval of vertices; sorted by source-id 2. Compute 3. Write Vertices 1. . 100 Vertices 101. . 700 Vertices 701. . 1000 Vertices 1001. . 10000 Shard 11 Shard 2 Shard 3 Shard 4 Shards small enough to fit in memory; balance size of shards
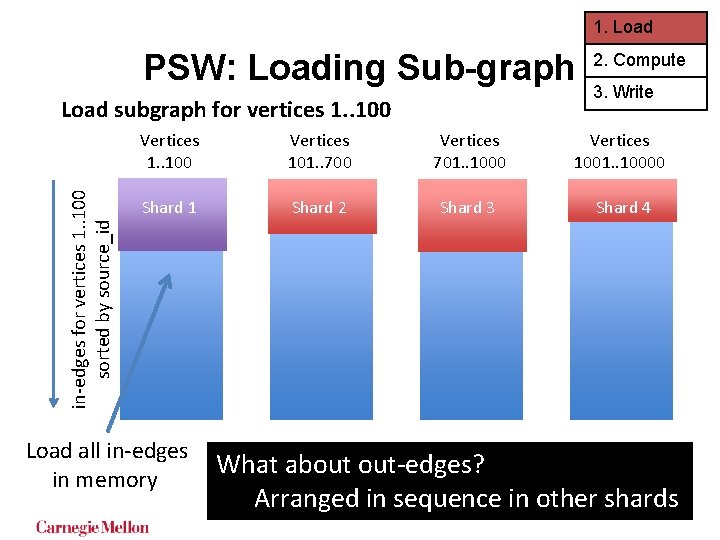
1. Load PSW: Loading Sub-graph in-edges for vertices 1. . 100 sorted by source_id Load subgraph for vertices 1. . 100 2. Compute 3. Write Vertices 1. . 100 Vertices 101. . 700 Vertices 701. . 1000 Vertices 1001. . 10000 Shard 1 Shard 2 Shard 3 Shard 4 Load all in-edges in memory What about out-edges? Arranged in sequence in other shards
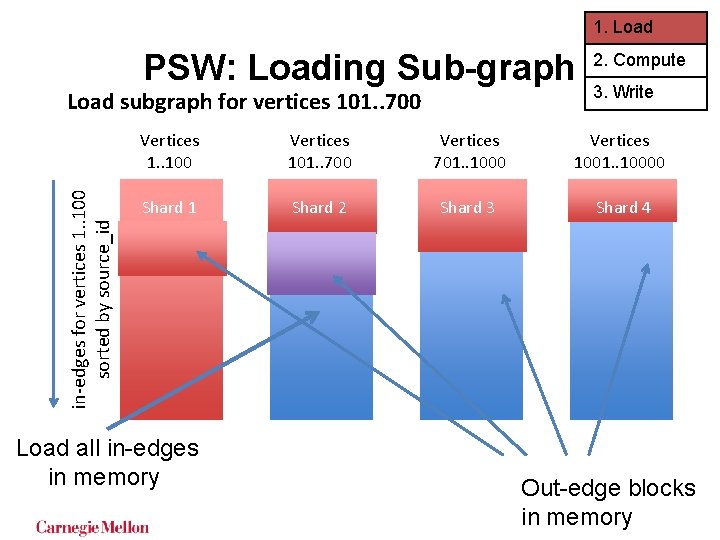
1. Load PSW: Loading Sub-graph in-edges for vertices 1. . 100 sorted by source_id Load subgraph for vertices 101. . 700 2. Compute 3. Write Vertices 1. . 100 Vertices 101. . 700 Vertices 701. . 1000 Vertices 1001. . 10000 Shard 1 Shard 2 Shard 3 Shard 4 Load all in-edges in memory Out-edge blocks in memory
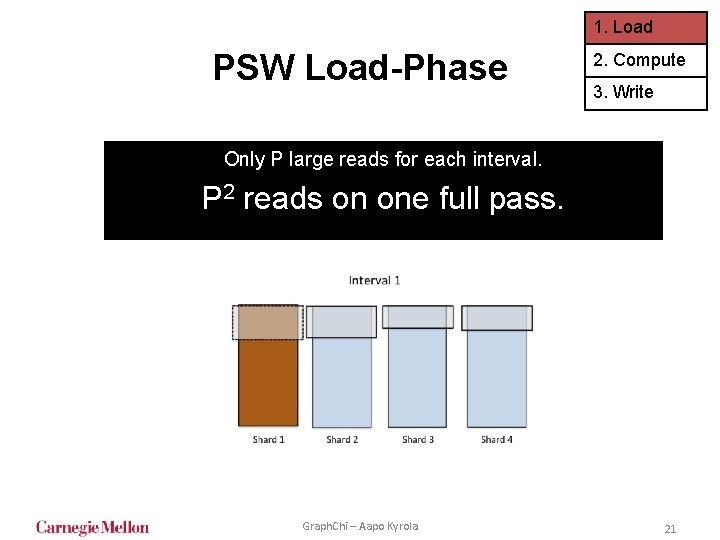
1. Load PSW Load-Phase 2. Compute 3. Write Only P large reads for each interval. P 2 reads on one full pass. Graph. Chi – Aapo Kyrola 21
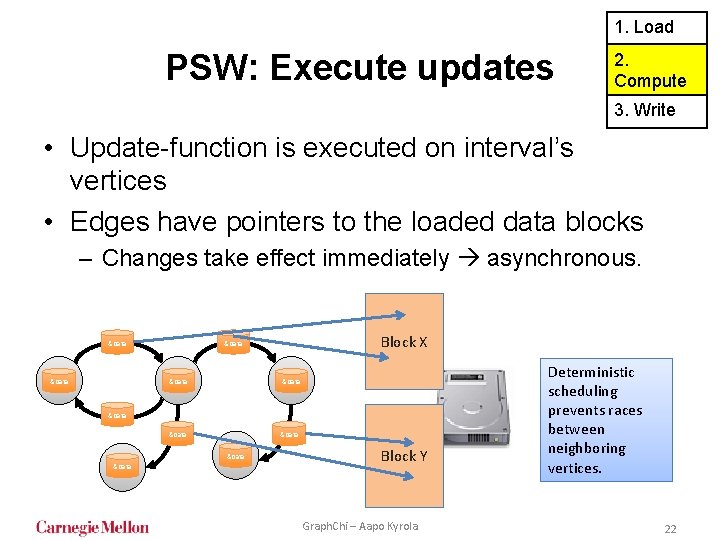
1. Load PSW: Execute updates 2. Compute 3. Write • Update-function is executed on interval’s vertices • Edges have pointers to the loaded data blocks – Changes take effect immediately asynchronous. &Data Block X &Data &Data Block Y Graph. Chi – Aapo Kyrola Deterministic scheduling prevents races between neighboring vertices. 22
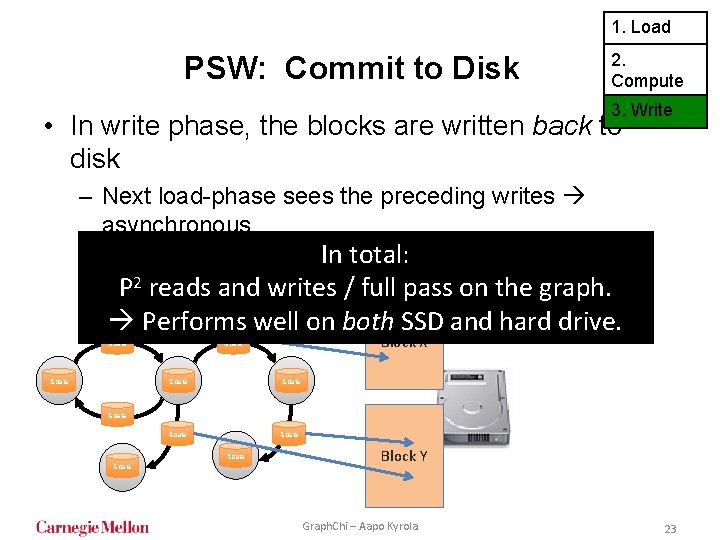
1. Load PSW: Commit to Disk 2. Compute 3. Write • In write phase, the blocks are written back to disk – Next load-phase sees the preceding writes asynchronous. In total: P 2 reads and writes / full pass on the graph. Performs well on both SSD and hard drive. &Data Block X &Data &Data Block Y Graph. Chi – Aapo Kyrola 23
Graph. Chi: Implementation Evaluation & Experiments
Graph. Chi • C++ implementation: 8, 000 lines of code – Java-implementation also available (~ 2 -3 x slower), with a Scala API. • Several optimizations to PSW (see paper). Source code and examples: http: //graphchi. org
EVALUATION: APPLICABILITY
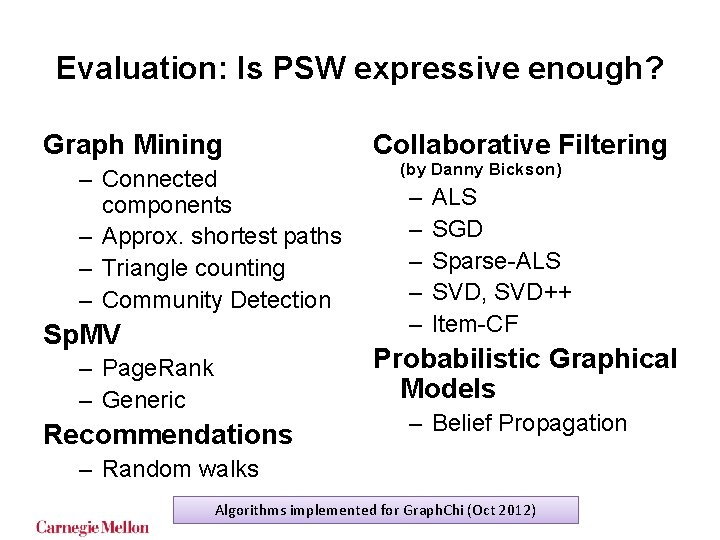
Evaluation: Is PSW expressive enough? Graph Mining – Connected components – Approx. shortest paths – Triangle counting – Community Detection Sp. MV Collaborative Filtering (by Danny Bickson) – – – ALS SGD Sparse-ALS SVD, SVD++ Item-CF Probabilistic Graphical Models – Page. Rank – Generic Recommendations – Belief Propagation – Random walks Algorithms implemented for Graph. Chi (Oct 2012)
Comparisons to existing systems IS GRAPHCHI FAST ENOUGH?
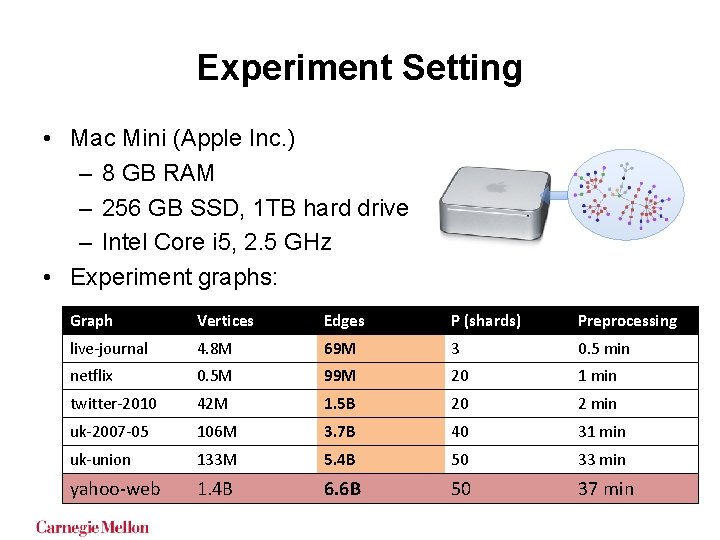
Experiment Setting • Mac Mini (Apple Inc. ) – 8 GB RAM – 256 GB SSD, 1 TB hard drive – Intel Core i 5, 2. 5 GHz • Experiment graphs: Graph Vertices Edges P (shards) Preprocessing live-journal 4. 8 M 69 M 3 0. 5 min netflix 0. 5 M 99 M 20 1 min twitter-2010 42 M 1. 5 B 20 2 min uk-2007 -05 106 M 3. 7 B 40 31 min uk-union 133 M 5. 4 B 50 33 min yahoo-web 1. 4 B 6. 6 B 50 37 min
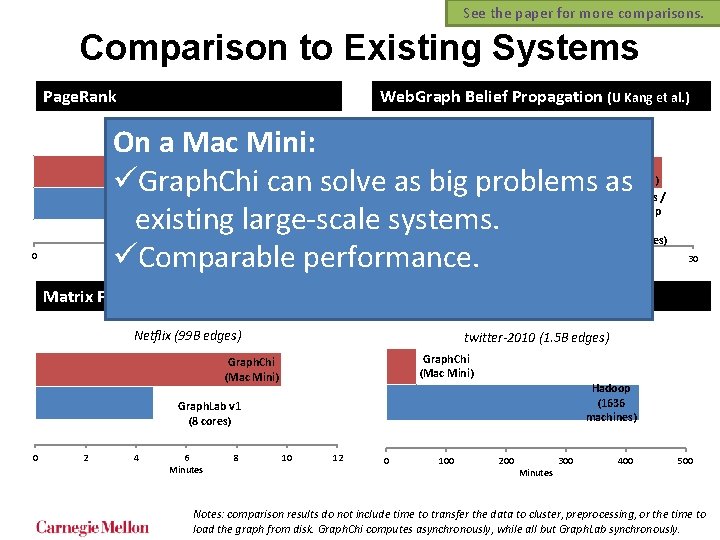
See the paper for more comparisons. Comparison to Existing Systems Page. Rank Web. Graph Belief Propagation (U Kang et al. ) Yahoo-web (6. 7 B edges) On a Mac Mini: üGraph. Chi can solve as big problems as existing large-scale systems. üComparable performance. Twitter-2010 (1. 5 B edges) Graph. Chi (Mac Mini) Pegasus / Hadoop (100 machines) Spark (50 machines) 0 5 Minutes 10 15 0 Matrix Factorization (Alt. Least Sqr. ) 5 10 15 Minutes 20 twitter-2010 (1. 5 B edges) Graph. Chi (Mac Mini) Hadoop (1636 machines) Graph. Lab v 1 (8 cores) 2 4 6 Minutes 8 30 Triangle Counting Netflix (99 B edges) 0 25 10 12 0 100 200 Minutes 300 400 500 Notes: comparison results do not include time to transfer the data to cluster, preprocessing, or the time to load the graph from disk. Graph. Chi computes asynchronously, while all but Graph. Lab synchronously.
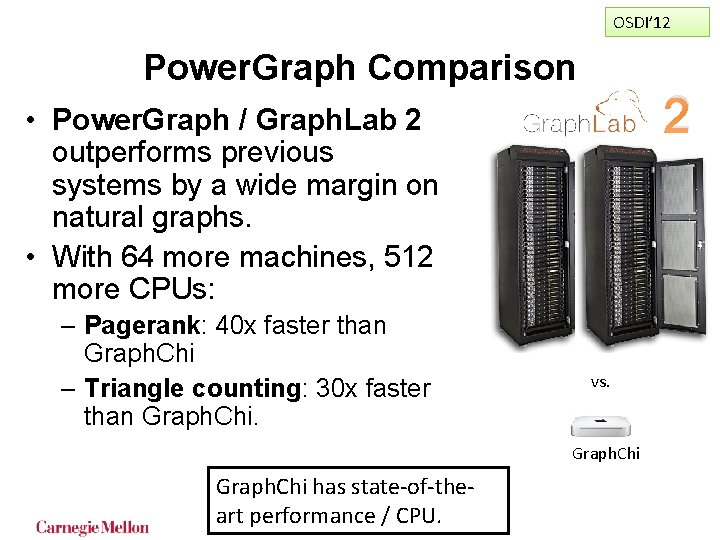
OSDI’ 12 Power. Graph Comparison 2 • Power. Graph / Graph. Lab 2 outperforms previous systems by a wide margin on natural graphs. • With 64 more machines, 512 more CPUs: – Pagerank: 40 x faster than Graph. Chi – Triangle counting: 30 x faster than Graph. Chi. vs. Graph. Chi has state-of-theart performance / CPU.
Consult the paper for a comprehensive evaluation: • HD vs. SSD • Striping data across multiple hard drives • Comparison to an in-memory version • Bottlenecks analysis • Effect of the number of shards • Block size and performance. Sneak peek SYSTEM EVALUATION
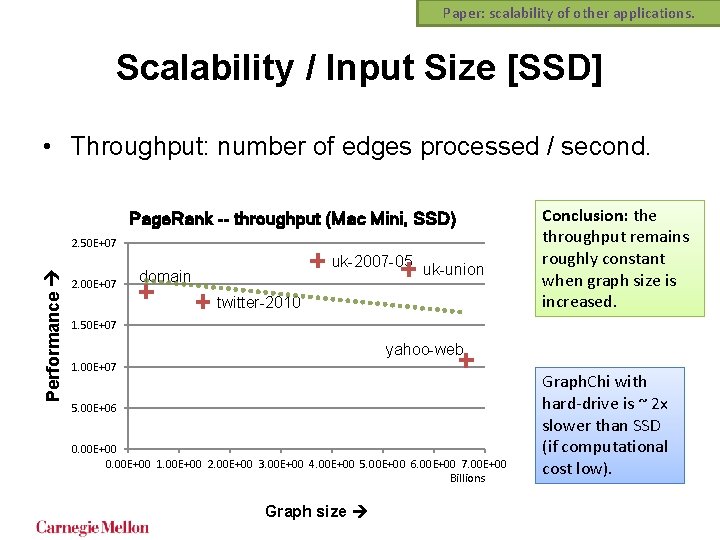
Paper: scalability of other applications. Scalability / Input Size [SSD] • Throughput: number of edges processed / second. Page. Rank -- throughput (Mac Mini, SSD) Performance 2. 50 E+07 2. 00 E+07 uk-2007 -05 domain uk-union twitter-2010 Conclusion: the throughput remains roughly constant when graph size is increased. 1. 50 E+07 yahoo-web 1. 00 E+07 5. 00 E+06 0. 00 E+00 1. 00 E+00 2. 00 E+00 3. 00 E+00 4. 00 E+00 5. 00 E+00 6. 00 E+00 7. 00 E+00 Billions Graph size Graph. Chi with hard-drive is ~ 2 x slower than SSD (if computational cost low).
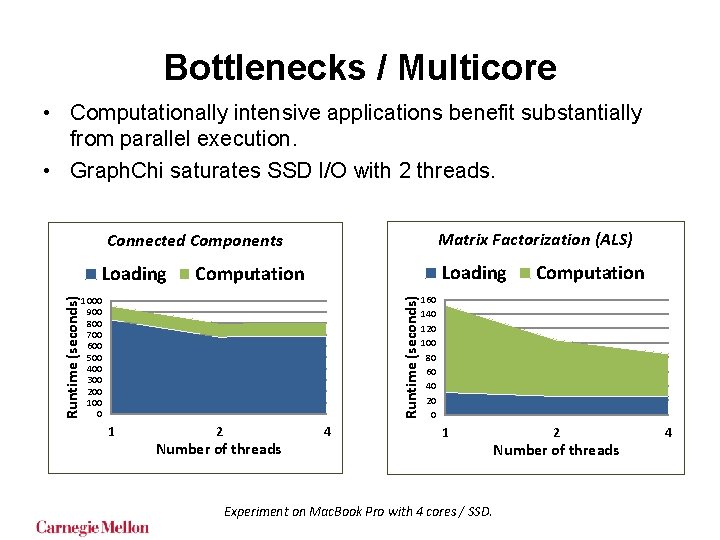
Bottlenecks / Multicore Connected Components Matrix Factorization (ALS) Loading Computation 1000 900 800 700 600 500 400 300 200 100 0 Runtime (seconds) • Computationally intensive applications benefit substantially from parallel execution. • Graph. Chi saturates SSD I/O with 2 threads. 1 2 Number of threads 4 Computation 160 140 120 100 80 60 40 20 0 1 Experiment on Mac. Book Pro with 4 cores / SSD. 2 Number of threads 4
Evolving Graphs whose structure changes over time
Evolving Graphs: Introduction • Most interesting networks grow continuously: – New connections made, some ‘unfriended’. • Desired functionality: – Ability to add and remove edges in streaming fashion; –. . . while continuing computation. • Related work: – Kineograph (Euro. Sys ‘ 12), distributed system for computation on a changing graph.
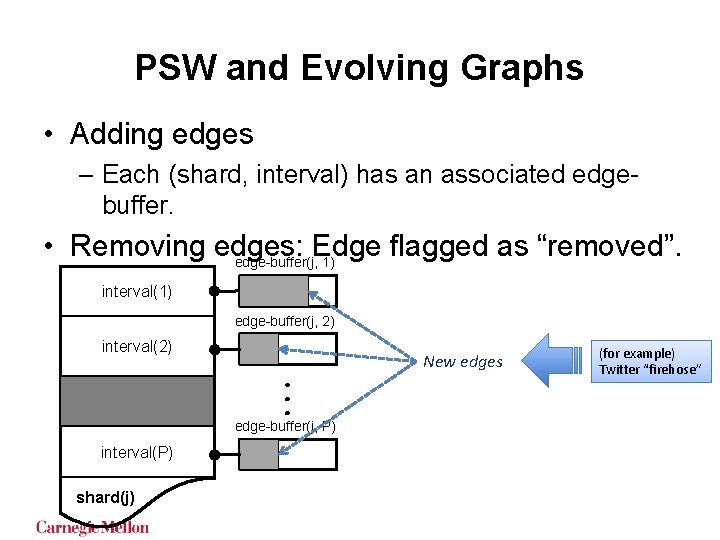
PSW and Evolving Graphs • Adding edges – Each (shard, interval) has an associated edgebuffer. • Removing edges: Edge flagged as “removed”. edge-buffer(j, 1) interval(1) edge-buffer(j, 2) interval(2) New edges edge-buffer(j, P) interval(P) shard(j) (for example) Twitter “firehose”
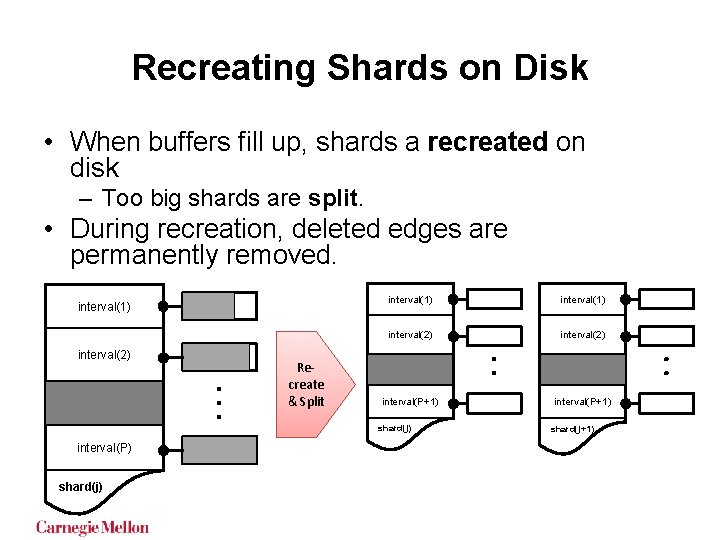
Recreating Shards on Disk • When buffers fill up, shards a recreated on disk – Too big shards are split. • During recreation, deleted edges are permanently removed. interval(1) interval(2) Recreate & Split interval(1) interval(2) interval(P+1) shard(j) interval(P) shard(j+1)
Streaming Graph experiment EVALUATION: EVOLVING GRAPHS
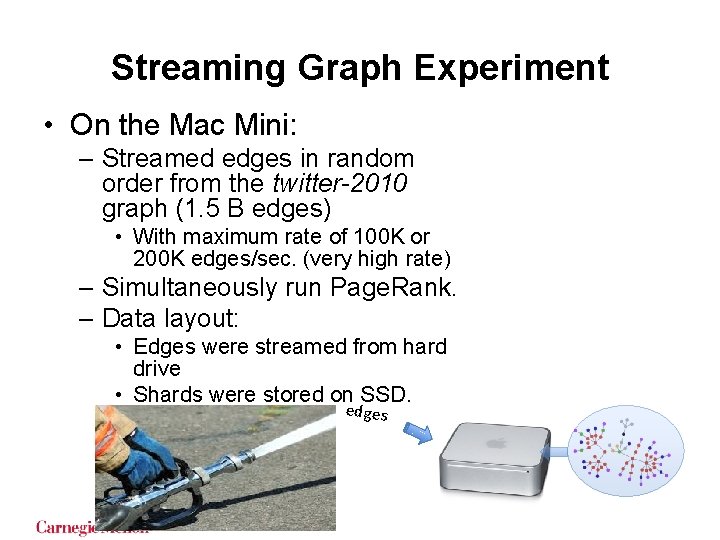
Streaming Graph Experiment • On the Mac Mini: – Streamed edges in random order from the twitter-2010 graph (1. 5 B edges) • With maximum rate of 100 K or 200 K edges/sec. (very high rate) – Simultaneously run Page. Rank. – Data layout: • Edges were streamed from hard drive • Shards were stored on SSD. edges
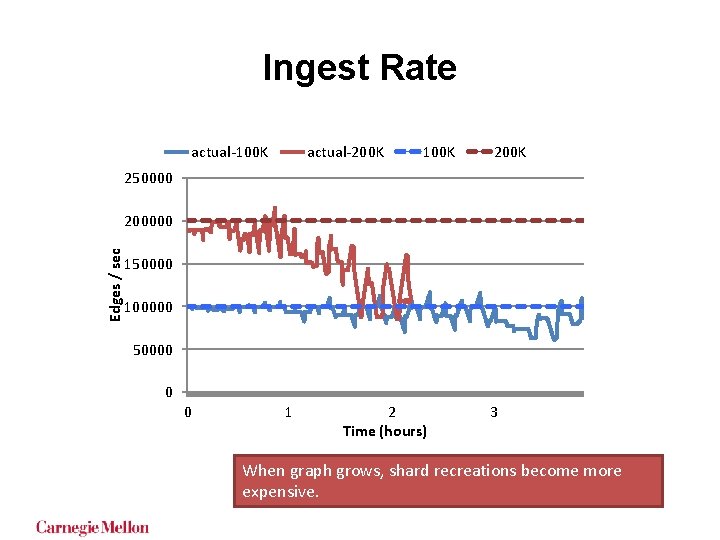
Ingest Rate actual-100 K actual-200 K 100 K 250000 Edges / sec 200000 150000 100000 50000 0 0 1 2 Time (hours) 3 When graph grows, shard recreations become more expensive.
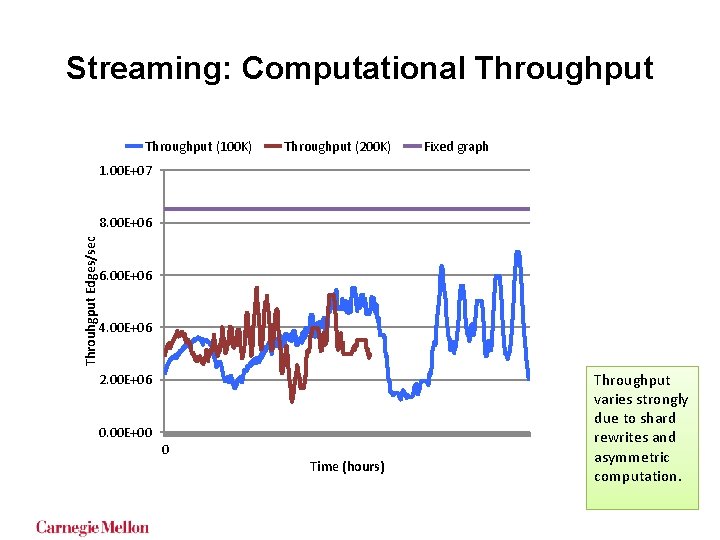
Streaming: Computational Throughput (100 K) Throughput (200 K) Fixed graph 1. 00 E+07 Throuhgput Edges/sec 8. 00 E+06 6. 00 E+06 4. 00 E+06 2. 00 E+06 0. 00 E+00 0 Time (hours) Throughput varies strongly due to shard rewrites and asymmetric computation.
Conclusion
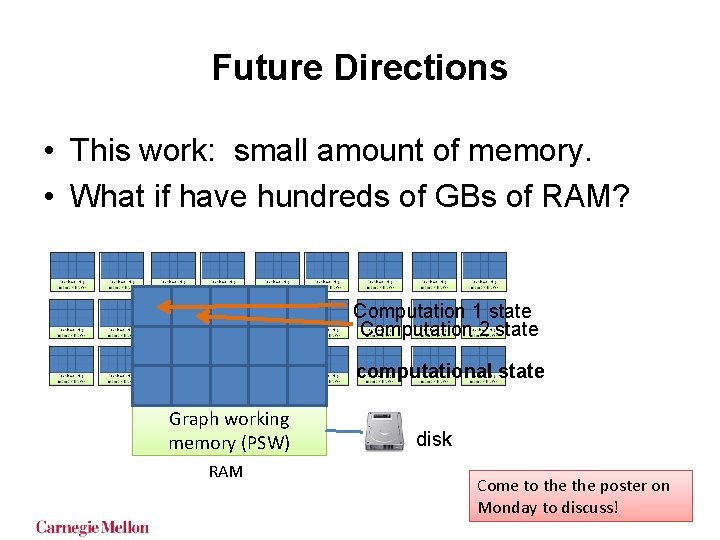
Future Directions • This work: small amount of memory. • What if have hundreds of GBs of RAM? Computation 1 state Computation 2 state computational state Graph working memory (PSW) RAM disk Come to the poster on Monday to discuss!
Conclusion • Parallel Sliding Windows algorithm enables processing of large graphs with very few nonsequential disk accesses. • For the system researchers, Graph. Chi is a solid baseline for system evaluation – It can solve as big problems as distributed systems. • Takeaway: Appropriate data structures as an alternative to scaling up. Source code and examples: http: //graphchi. org License: Apache 2. 0
Extra Slides
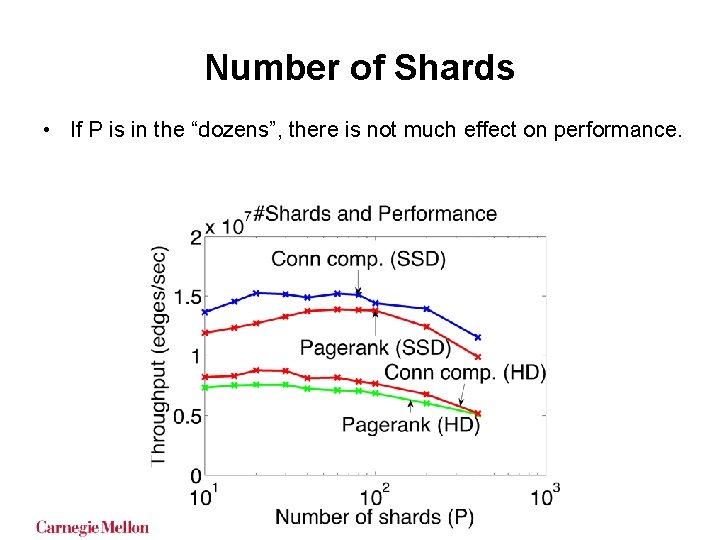
Number of Shards • If P is in the “dozens”, there is not much effect on performance.
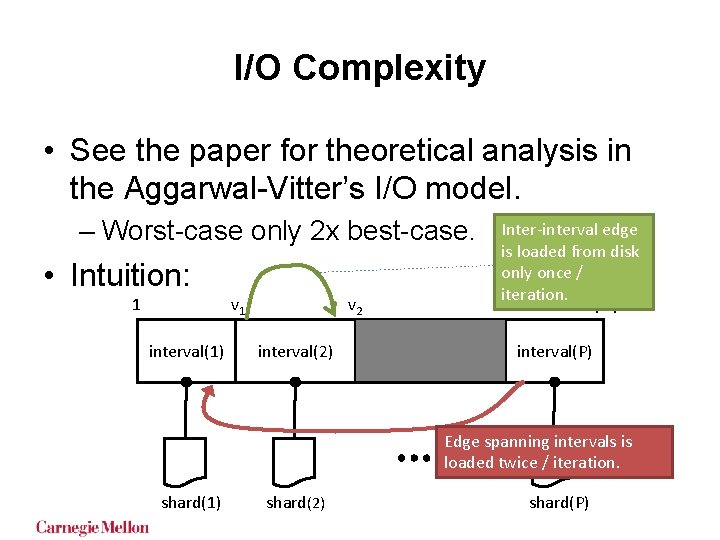
I/O Complexity • See the paper for theoretical analysis in the Aggarwal-Vitter’s I/O model. – Worst-case only 2 x best-case. • Intuition: 1 v 1 interval(1) v 2 interval(2) Inter-interval edge is loaded from disk only once / iteration. |V| interval(P) Edge spanning intervals is loaded twice / iteration. shard(1) shard(2) shard(P)
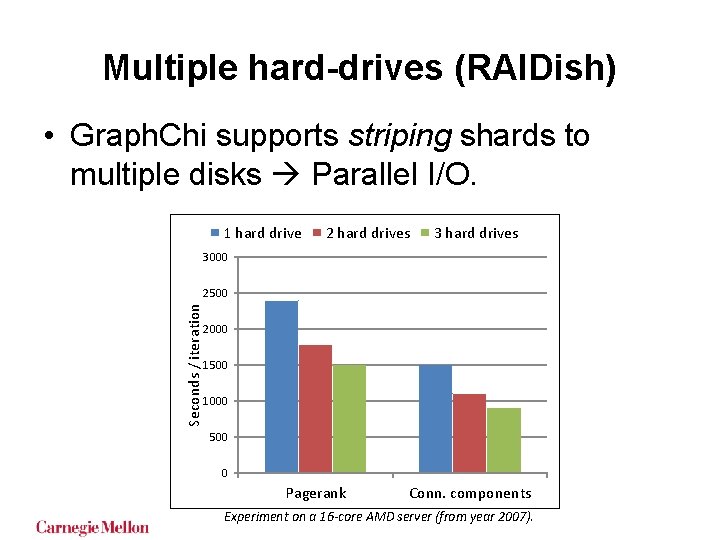
Multiple hard-drives (RAIDish) • Graph. Chi supports striping shards to multiple disks Parallel I/O. 1 hard drive 2 hard drives 3000 Seconds / iteration 2500 2000 1500 1000 500 0 Pagerank Conn. components Experiment on a 16 -core AMD server (from year 2007).
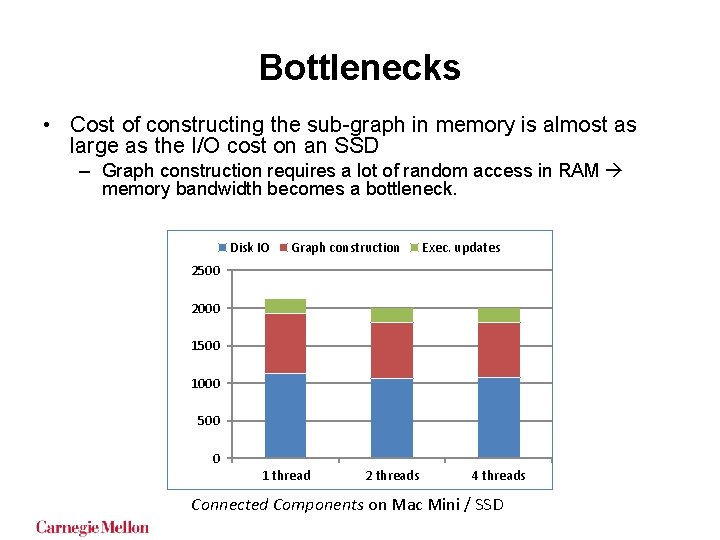
Bottlenecks • Cost of constructing the sub-graph in memory is almost as large as the I/O cost on an SSD – Graph construction requires a lot of random access in RAM memory bandwidth becomes a bottleneck. Disk IO Graph construction Exec. updates 2500 2000 1500 1000 500 0 1 thread 2 threads 4 threads Connected Components on Mac Mini / SSD
Computational Setting • Constraints: A. Not enough memory to store the whole graph in memory, nor all the vertex values. B. Enough memory to store one vertex and its edges w/ associated values. • Largest example graph used in the experiments: – Yahoo-web graph: 6. 7 B edges, 1. 4 B vertices Recently Graph. Chi has been used on a Mac. Book Pro to compute with the most recent Twitter follow-graph (last year: 15 B edges)