Evaluation of Hurricane Forecast Skills of NCEP GFS


 • 2/2009: Flow-dependent weighting of background error variances; Variational Quality")
 -- Atlantic 300 Fcst Hour 0 250 24 48")
-- Atlantic Fcst Hour 0 45 24 48 35")
 -- Eastern Pacific 300 Fcst Hour 0 24 250")
-- Eastern Pacific 45 Fcst Hour 0 24 35 48")
 -- Western Pacific Fcst Hour 0 250 24")

 GFDL UKM HWRF")
 GFS (AVNO),")
 GFS (AVNO)")

 The GDAS/GFS is being upgraded to 4 D-Hybrid En. VAR System")


 GFSX: T")


 – Operational GFS (Control); GFSP (cyan) – Parallel GFS")

")


 fairly quickly figured out that the")


- Slides: 44
Evaluation of Hurricane Forecast Skills of NCEP GFS Retrospective Experiments for the FY 2016 Implementation Fanglin Yang IMSG - Environmental Modeling Center National Centers for Environmental Prediction NCEP EMC MEG Meeting May 5, 2016 Acknowledgments : All NCEP EMC Global Climate and Weather Modeling Branch members are acknowledged for their contributions to the development of the Global Forecast Systems. 1
Outline 1. GFS Forecast Skill of Hurricane Track and Intensity in the Past 15 Years 2. Review of 2015 Performance 3. Upcoming GFS Upgrade in May 2016 4. Evaluation of GFS Retrospective Experiments: 2012 -2015 5. Hurricane Sandy and Hurricane Joaquin 2
Change History of GFS Configurations Mon/Year Leve ls Truncations Z-cor/dyncore Major components upgrade Aug 1980 12 R 30 (375 km) Sigma Eulerian first global spectral model, rhomboidal Oct 1983 12 R 40 (300 km) Sigma Eulerian Apr 1985 18 R 40 (300 km) Sigma Eulerian GFDL Physics Aug 1987 18 T 80 (150 km) Sigma Eulerian First triangular truncation; diurnal cycle Mar 1991 18 T 126 (105 km) Sigma Eulerian Aug 1993 28 T 126 (105 km) Sigma Eulerian Arakawa-Schubert convection Jun 1998 42 T 170 (80 km) Sigma Eulerian Prognostic ozone; SW from GFDL to NASA Oct 1998 28 T 170 (80 km) Sigma Eulerian the restoration Jan 2000 42 T 170 (80 km) Sigma Eulerian first on IBM Oct 2002 64 T 254 (55 km) Sigma Eulerian RRTM LW; May 2005 64 T 382 (35 km) Sigma Eulerian 2 L OSU to 4 L NOAH LSM; high-res to 180 hr May 2007 64 T 382 (35 km) Hybrid Eulerian SSI to GSI Jul 2010 64 T 574 (23 km) Hybrid Eulerian RRTM SW; New shallow cnvtion; TVD tracer Jan 2015 64 T 1534 (13 km) Hybrid Semi-Lag SLG; Hybrid EDMF; Mc. ICA etc Vertical layers double every ~11 yrs; change of horizontal resolution is rapid (~30 times in 35 years); sigma-Eulerian used for 27 yrs! Source http: //www. emc. ncep. noaa. gov/gmb/STATS/html/model_changes. html 3
Major GFS Changes Since 2000 • 2/2000: Resolution change: T 126 L 28 T 170 L 42 (100 km 70 km) • 7/2000 --hurricane relocation • 5/2001: Major physics upgrade (prognostic cloud water, cumulus momentum transport) –Improved QC for AMSU radiances • 11/2002: Resolution change: T 170 L 42 T 254 L 64 (70 km 55 km) • 2003: NOAA-17 radiances, NOAA-16 AMSU restored, Quikscat 0. 5 degree data • 2004: RRTM longwave and trace gases; mountain blocking added • 5/2005: Resolution change: T 254 L 64 T 382 L 64 ( 55 km 38 km ) – 2 -L OSU LSM 4 -L NOHA LSM • 8/2006: NRL ozone physics –Upgrade snow analysis • 5/2007: SSI (Spectral Statistical Interpolation) GSI ( Gridpoint Statistical Interpolation). –Vertical coordinate changed from sigma to hybrid sigma-pressure –New observations (COSMIC, full resolution AIRS, METOP HIRS, AMSU-A and MHS) 4
Major GFS Changes (cont’d) • 2/2009: Flow-dependent weighting of background error variances; Variational Quality Control; METOP IASI observations added; Updated Community Radiative Transfer Model coefficients • 7/2010: Resolution Change: T 382 L 64 T 574 L 64 ( 38 km 23 km ) – Major radiation package upgrade (RRTM 2 , aerosol, surface albedo etc) – New mass flux shallow convection scheme; revised deep convection and PBL scheme – Positive-definite tracer transport scheme to remove negative water vapor • 5/22/2012: GSI Hybrid En. KF-3 DVAR : lower resolution (T 254) Ensemble Kalman Filter. • 1/2015: Upgrade to T 1534 Semi-Lagrangian (~13 km) • Use high resolution daily RGT SST and daily sea ice analysis; Use Mc. ICA radiation approximation; Reduced drag coefficient at high wind speeds; Hybrid EDMF PBL scheme and TKE dissipative heating; Divergence damping in the stratosphere to reduce noise; Stationary convective gravity wave drag; New blended snow analysis; Changes to treatment of lake ice to remove unfrozen lake in winter; Replace Bucket soil moisture climatology with CFS/GLDAS • GSI Changes: increase horizontal resolution of ensemble from T 254 to T 574; move to enhanced radiance bias correction scheme; assimilate new radiances: F 17 an F 18 SSMIS, Met. Op-B IASI; assimilate NESDIS GOES hourly AMVs. 5
GFS Hurricane Track Errors (nm) -- Atlantic 300 Fcst Hour 0 250 24 48 200 72 150 96 100 50 0 15 20 14 20 13 20 12 20 11 20 10 20 09 20 08 20 7 0 20 06 20 05 20 04 20 03 20 02 20 01 20 • Track for all forecast leading time has been improved in the past 15 years; 72 -hr track error reduced from ~150 nm to ~100 nm 6
55 GFS Hurricane Intensity Errors (kts)-- Atlantic Fcst Hour 0 45 24 48 35 72 96 25 15 20 14 20 13 20 12 20 11 20 10 20 09 20 08 20 07 20 06 20 05 20 04 20 03 20 02 20 01 20 • Intensity improved in 2010 and 2011 due to GFS resolution increase from 35 km to 23 km and major physics upgrade; • in 2012 and 2013 due to ENKF-3 DVAR GSI Implementation in May 2012; • in 2015 due to T 1534 SLG GFS (~13 km) implementation. 7
GFS Hurricane Track Errors (nm) -- Eastern Pacific 300 Fcst Hour 0 24 250 48 200 72 96 150 100 50 0 20 01 20 02 20 03 20 04 20 05 20 06 20 07 20 08 20 09 20 10 20 11 20 12 20 13 20 14 20 15 • Significant track error reduction in the past 15 years. • 72 -hr track reduced from 200 nm in 2004 to 100 nm in 2015. 8
GFS Hurricane Intensity Errors (kts)-- Eastern Pacific 45 Fcst Hour 0 24 35 48 72 25 96 15 5 15 20 14 20 13 20 12 20 1 1 20 0 1 20 9 0 20 8 0 20 7 0 20 6 0 20 5 0 20 4 0 20 3 0 20 2 0 20 1 0 20 • Large reduction after 2010 T 574 GFS Implementation • 3 D En-Var DA (May 2012) reduced initialization error (? ) 9
300 GFS Typhoon Track Errors (nm) -- Western Pacific Fcst Hour 0 250 24 200 48 72 150 96 120 100 50 0 2011 2012 2013 2014 2015 72 -hr forecast error reduced from 150 to 100 nm in 5 years.
Outline 1. GFS Forecast Skill of Hurricane Track and Intensity in the Past 15 Years 2. Review of 2015 Performance 3. Upcoming GFS Upgrade in May 2016 4. Evaluation of GFS Retrospective Experiments: 2012 -2015 5. Hurricane Sandy and Hurricane Joaquin 11
2015 Atlantic – Track Errors (00 Z and 12 Z Cycles) GFDL UKM HWRF GFS ECMWF has larger initial error than GFS ! CMC ECMWF GFS (AVNO) tied with UKM; ECMWF had the best skill.
2015 Eastern Pacific – Track Errors (00 Z and 12 Z Cycles) GFS (AVNO), HWRF and ECMWF had similar skills.
2015 Western Pacific – Track Errors (00 Z and 12 Z Cycles) GFS (AVNO) and HWRF had similar skills.
Outline 1. GFS Forecast Skill of Hurricane Track and Intensity in the Past 15 Years 2. Review of 2015 Performance 3. Upcoming GFS Upgrade in May 2016 (05/11/2016) 4. Evaluation of GFS Retrospective Experiments: 2012 -2015 5. Hurricane Sandy and Hurricane Joaquin 15
Implementation Overview 1) The GDAS/GFS is being upgraded to 4 D-Hybrid En. VAR System – Research supported by Sandy Supplemental transitioning to operations 2) Land surface improvements to address summertime warm/dry biases in surface fields 3) Hourly output fields through 120 -hr forecasts 4) 36 months of retrospective runs for evaluation 16
Data Assimilation Upgrades • Use 4 D covariances instead of 3 D • Multivariate Ozone update • Assimilate all-sky (clear and cloudy) radiances • Bias correct aircraft data • And other upgrades (e. g. CRTM, Data selection/thinning, AMV winds, etc. ) 17
GFSX much smaller increments Analysis and first guess in better agreement DA Impact Highlights: • Better Fit-to-obs for Temperature and Winds at various levels • Improved minimization • Significant improvement in the shortrange forecasts for several variables 18
RMSE for Winds: Global Tropics 200 h. Pa 850 h. Pa 19
Forecast Model and Product Changes • Convective gravity wave upgrade • Tracer adjustment upgrade • Corrections to land surface to reduce summertime warm, dry bias over Great Plains GFS showed too little evaporation and too much sensible heat flux, hence Bowen ratio is too high. Upgraded LSM includes – rsmin for grassland from 45 to 20 – rsmin for cropland from 45 to 20 – roughness length for cropland from 3. 5 cm to 12. 5 cm (used to address too strong surface winds) • Improved icing probability products and new icing severity product • 5 more levels above 10 h. Pa • Hourly output through 120 -hr forecast Credit: Slide from GFS Implementation Review 20
Significantly improve the biases brought up in the EMC MEG meeting EMC land surface team T 2 m Td 2 m Latent heat CAPE 21
Outline 1. GFS Forecast Skill of Hurricane Track and Intensity in the Past 15 Years 2. Review of 2015 Performance 3. Upcoming GFS Upgrade in May 2016 (05/11/2016) 4. Evaluation of GFS Retrospective Experiments: 2012 -2015 verification extended from 5 days to 7 days 5. Hurricane Sandy and Hurricane Joaquin 22
GFS 2: T 1534 GFS implemented in January 2015 (3 D En-Var) GFSX: T 1534 GFS to be implemented in May 2016 (4 D En-Var) 23
Small but significant improvement 24
25
Impact on Hurricanes: NHC Evaluation AL Track 0 -48 h - 3% 72 -120 h +7% EP Track Intensity +5% 0 -48 h +5% + 11% 72 -120 h +1% +2% Intensity Track and intensity error improvements/degradation of Q 3 FY 16 GFS vs. 2015 GFS for the 2012 -2016 retrospective runs, by basin 26
Verification of TC cyclogenesis in the GFSX – comparison to current and previous version of the GFS (courtesy of Dan Halperin and Bob Hart) Increased POD, reduced False Alarm Increased POD, increased False Alarm 27
GFSX Ops GFS GFSO (blue) – Operational GFS (Control); GFSP (cyan) – Parallel GFS Errors in GFSX are smaller than that in GFSO. Fcst hr 0 12 24 36 48 60 72 84 96 108 120 Cases 1093 1075 1011 687 366 201 104 64 35 26 17 28 Guang Ping Lou
Outline 1. GFS Forecast Skill of Hurricane Track and Intensity in the Past 15 Years 2. Review of 2015 Performance 3. Upcoming GFS Upgrade in May 2016 (05/11/2016) 4. Evaluation of GFS Retrospective Experiments: 2012 -2015 5. Hurricane Sandy and Hurricane Joaquin 29
Hurricane Sandy GFS 2: T 1534 GFS implemented in January 2015 (3 D En-Var) GFSX: T 1534 GFS to be implemented in May 2016 (4 D En-Var) 30 AVNO: 2012 operational GFS (T 574 Eulerian GFS, 3 D En-Var, ~23 km)
• Hurricane Sandy: Mean track indicates GFSX has much a better forecast than 2012 operational GFS and the current operational GFS 2015 at the 7 -day lead time. • Overall, GFSX's performance is similar to GFS 2015. • One case (2012102412) showed GFSX is worse. GFSX better GFSX worse 7 day in advance! 31
2012 Operational GFS Current Operational SL-GFS No significant difference GFSX has slightly better cycle-to-cycle consistency GFSX
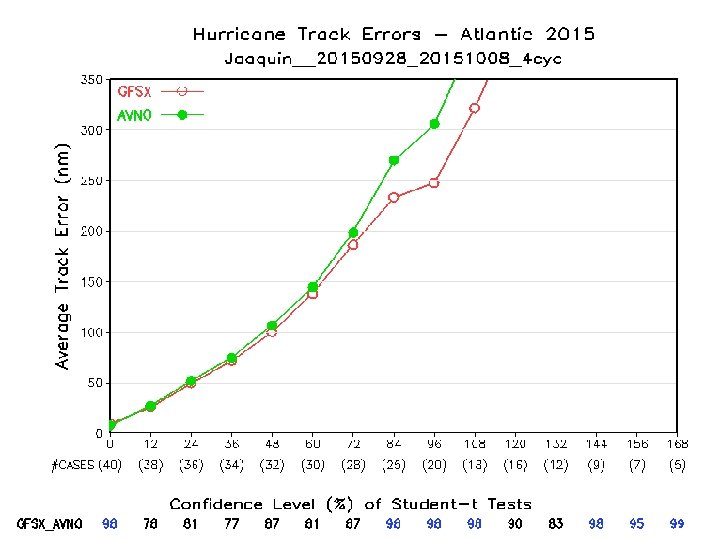
Hurricane Joaquin AVNO GFSX ECM AVNO ECM Ops GFS 2015093000 2015100100 2015100200 GFSX performed much better than AVNO starting from the 2015100100 cycle
Credit: Tracey Dorian The European Center Model (ECMWF) fairly quickly figured out that the storm would not make landfall, while NCEP’s Global Forecast System (GFS) was slower to capture the decreasing threat. … The GFS parallel … was very slightly better than the operational GFS. …The 00 z 1 October cycle (Fig. 6) still saw the GFS and GFS turn Joaquin too far to the west after the initial southwest motion. … The GFS simulation of Joaquin was therefore possibly influenced by the large upper low over the southeast, and the model still made a landfall, although dramatically further north than previous cycles. The GFSX, however, did not show landfall, although its track was still too far to the west. . . The GFSX parallel was 6 hours faster than the operational GFS in dismissing the east coast threat. ECMWF 00 Z Sep 29 GFSX 00 Z Oct 1 UKMET 00 Z Oct 1 GFS 06 Z Oct 1 HWRF 12 Z Oct 1 Table 1. Lists of the first cycles for which various forecast models first indicated that Joaquin would not make landfall along the east coast and kept the storm offshore in all subsequent cycles
Thanks http: //www. emc. ncep. noaa. gov/gmb/wx 24 fy/vsdb/gfs 2016/ http: //www. emc. ncep. noaa. gov/gmb/wx 24 fy/vsdb/gfs 2015/ http: //www. emc. ncep. noaa. gov/gmb/STATS_vsdb/ 36
Extra slides 37
Retrospective Forecast Experiments 36 months from 2012 to 2016 GCWMB real time (pr 4 devb): period: 2015070100 - real time GCWMB 2015 summer retrospective (pr 4 devbs 15) period: 2015041500 - 2015120100 (230 days) GCWMB 2013 summer retrospective (pr 4 devbs 13) period: 2013041500 - 2013120100 (230 days) NCO 2013 -2014 winter retrospective (pr 4 devbw 13) period: 2013110100 - 2014060100 (212 days) NCO 2014 summer retrospective (pr 4 devbs 14) period: 2014050100 - 2014120100 (214 days) GCWMB 2014 -2015 winter retrospective (pr 4 devbw 14) period: 2014110100 - 2015070100 (242 days) GCWMB Special retrospective for Hurricane Sandy period: 2012101700 - 201213100 (15 days) 38
2014 Atlantic Hurricanes First system formed July 1, 2014 Last system dissipated October 28, 2014 Strongest storm Gonzalo – 940 h. Pa , 145 mph Total depressions 9 Total storms 8 Hurricanes 6 Major hurricanes (Cat. 3+) 2 Total fatalities 19 total Total damage ~ $262 million http: //www. wikipedia. org A quiet year. One landfall storm over US www. nhc. noaa. gov NOAA’s Atlantic Hurricane Season Outlook (08/07/2014): 7 -12 named storms, 3 -6 39 hurricanes, 0 -2 major hurricanes
GFDL GFS ECMWF HWRF UKM CMC • HWRF and UKM had better track forecasts. ECMWF had smaller errors than GFS for day 1 -2 forecasts, and larger error for day-5 forecast. • Among all global NWP models, GFS had the smallest initial track error (because of the use of hurricane relocation ? ) • Note: OFCL are based on guidance of “early” models
2014 Eastern Pacific Hurricanes First system formed May 22, 2014 Last system dissipated November 5, 2014 Strongest storm Marie – 918 h. Pa, 160 mph Total depressions 23 Total storms 22 Hurricanes 16 (record high, tied with 1990 and 1992) Major hurricanes 9 (Cat. 3+) Total fatalities www. nhc. noaa. gov/ 42 Total damage $1. 24 billion http: //www. wikipedia. org 41
GFDL GFS HWRF UKM CMC ECMWF • ECMWF had the smallest track errors. • GFS was slightly worse than HWRF, but better than GFDL and UKM. • CMC had the largest track error.
2014 Western Pacific Typhoons First system formed January 10, 2014 Last system dissipated January 1, 2015 Strongest storm Vongfong: 900 h. Pa, 130 mph Total depressions 30 Total storms 23 Typhoons 11 Supper Typhoons 8 http: //www. wikipedia. org Total fatalities 538 Total damage $8. 4 billion 43
JTWC are based on guidance of early models