Accessing and Using GFS LAMP Products National Weather


- Slides: 47

Accessing and Using GFS LAMP Products National Weather Service Meteorological Development Laboratory Mesoscale Prediction Branch Scott D. Scallion, March 2008

Table of Contents GFS LAMP Background n NWS Server and NOAAPort/SBN Data n GFS LAMP in AWIPS D 2 D n GFS LAMP in AWIPS Avn. FPS n GFS LAMP Website n Case Studies n Summary n Click on one of the topics above to jump to that part of the presentation, or click anywhere else to advance to the next slide.

GFS LAMP Background n The Localized Aviation MOS Program (LAMP) is a system of objective analyses, simple models, regression equations, and related thresholds which together provide guidance for sensible weather forecasts. n LAMP provides hourly updates to GFS MOS by bridging the gap between the observations and the MOS forecast. n LAMP provides probabilistic and non-probabilistic guidance for 17 weather elements. n LAMP guidance focuses on aviation weather elements.

GFS LAMP Guidance Details n LAMP guidance is in the range of 1 - 25 hours in 1 hour projections n LAMP provides station-oriented guidance for: n All 17 LAMP forecast elements n ~1600 stations n CONUS, Alaska, Hawaii, Puerto Rico n LAMP provides gridded-oriented guidance for: n Thunderstorms: n Probability of thunderstorm occurrence in a 2 hour period in a 20 -km grid box n Best Category Yes/No of thunderstorm occurrence in a 2 hour period in a 20 km grid box n CONUS only n Eventually will run 24 times a day (every hour) n Visit the website to check the latest availability of LAMP cycles: http: //www. nws. noaa. gov/mdl/lamp/index. shtml

Example of a GFS LAMP Text Bulletin KBUF UTC TMP DPT WDR WSP WGS PPO PCO P 06 TP 2 TC 2 POZ POS TYP CLD CIG CCG VIS CVS OBV BUFFALO 13 14 15 16 21 22 12 12 25 25 20 18 19 18 27 26 26 25 74 69 72 63 Y Y GFS LAMP GUIDANCE 2/19/2008 1200 UTC 17 18 19 20 21 22 23 00 01 02 03 04 05 06 07 08 09 10 11 12 22 22 22 21 21 20 20 20 19 19 18 17 16 16 15 12 12 12 13 of 12 12 13 Occurrence 13 13 11 11 11 10 10 Probability Precipitation on 12 the 12 hour 25 25 24 Precipitation 24 24 25 25 Occurrence 25 25 on 24 the 24 hour 25 25 Yes/No 19 18 19 19 20 19 18 17 15 13 12 12 11 10 09 09 09 08 08 08 Probability 6 -Hour Measurable 26 26 26 27 of 27 26 of 25 Thunderstorms 24 21 NG NGPrecipitation NGduring NG NG 2 -Hour NG NG NG Probability period 64 59 68 74 74 67 60 55 50 51 48 49 49 49 48 47 46 48 48 48 Yes/No Thunderstorm Occurrence during 2 -Hour period Y Y Y Y Y Wind Direction 40 35 36 27 0 0 0 Temperature 0 0 Speed 0 0 0 0 0 Wind Cover N Visibility N N Wind N N Gust NTotal Sky N N N N Dewpoint 0 Conditional 0 0 Visibility 0 Ceiling 0 1 Height 1 0 0 0 0 1 1 1 99100100100100100 99100100 99 99 99 Conditional Ceiling Height Obstruction to Vision S S S S S S OV OV OV OV OV OV 6 5 5 5 5 6 6 6 6 5 5 Probability 5 4 4 4 of 4 Snow 4 5 6 6 6 6 7 7 Probability 7 7 6 5 of 5 Freezing 6 7 7 7 7 5 5 5 3 5 5 5 5 Precipitation Type N N N N N N 13 16 9 25 08 NG 50 Y 0 0 99 99 S S OV OV 6 6 5 5 7 7 6 5 N N 1 99 S OV 6 6 7 4 N

GFS LAMP Weather Element Types KBUF UTC TMP DPT WDR WSP WGS PPO PCO P 06 TP 2 TC 2 POZ POS TYP CLD CIG CCG VIS CVS OBV BUFFALO 13 14 15 16 21 22 12 12 25 25 20 18 19 18 27 26 26 25 74 69 72 63 Y Y 0 0 99 99 S S OV OV 6 6 5 5 7 7 6 5 N N GFS LAMP 21 22 23 22 22 21 12 12 12 24 25 25 20 19 18 27 26 25 74 67 60 Y Y Y GUIDANCE 2/19/2008 17 18 19 20 00 01 02 03 04 05 06 22 22 21 20 20 20 19 12 12 12 13 13 13 12 25 25 24 24 25 19 18 19 19 17 15 13 12 12 11 10 26 26 26 27 24 21 NG NG NG 64 59 68 74 55 50 51 48 49 49 49 Y Y Y 40 35 36 0 0 0 N N N 0 0 0 0 1 1 0 0 0 0 99100100100100100 99100100 S S S S OV OV OV OV 6 5 5 5 5 6 6 6 6 5 5 5 4 4 4 5 6 6 6 6 7 7 6 5 5 6 7 7 7 7 5 5 5 3 5 5 5 5 5 N N N N 1200 07 08 19 18 12 11 25 25 09 09 NG NG 48 47 Y Y 1 99 S OV 6 6 7 5 N UTC 09 10 17 16 11 11 25 25 09 08 NG NG 46 48 Y Y 11 16 10 25 08 NG 48 Y 0 0 N N 1 1 99 99 S S OV OV 6 6 6 6 7 7 5 5 N N Categorical Elements 2 13– -–Continuous Probabilistic Elements 12 15 10 25 08 NG 48 Y 27 0 N 1 99 S OV 6 6 7 5 N 13 16 9 25 08 NG 50 Y 1 99 S OV 6 6 7 4 N

Overview of Available Products n Sent out on SBN/NOAAPort and NWS FTP Server n n AWIPS n n n ASCII text bulletin BUFR data GRIB 2 thunderstorm data Displayable in D 2 D n Local menu n Volume Browser Guidance available for display and Terminal Aerodrome Forecast (TAF) preparation via the Aviation Forecast Preparation System (Avn. FPS) GFS LAMP Website http: //www. nws. noaa. gov/mdl/gfslamp. shtml

Retrieving Data From NWS Server 1) ftp to tgftp. nws. noaa. gov 2) username is anonymous 3) Supply email address for the password à For text data, set type to ascii à For BUFR and GRIB 2, set type to binary 4) Data and locations (HH= cycle hour): à ASCII Text Bulletin à à BUFR Data à à SL. us 008001/DF. bf/DC. lampgfs/cy. HH. bin GRIB 2 Thunderstorm Probabilities à à SL. us 008001/DF. anf/DC. lampgfs/cy. HH. txt SL. us 008001/ST. opnl/DF. gr 2/DC. ndgd/GT. lampgfs/AR. conus/ds. pts 02. bin GRIB 2 Thunderstorm Occurrence (Yes/No) à SL. us 008001/ST. opnl/DF. gr 2/DC. ndgd/GT. lampgfs/AR. conus/ds. ots 02. bin

GFS LAMP BUFR Data n n Includes all text bulletin weather elements Also contains additional LAMP forecast data types and elements not in the text bulletin n Ex: complete suite of probabilities, POP 12, precipitation characteristics Stored in netcdf in AWIPS For more information, visit the LAMP BUFR Guidance page: http: //www. nws. noaa. gov/mdl/gfslamp/docs/Bufr. LAMPintro 05. shtml

GFS LAMP GRIB 2 Data n n Includes gridded thunderstorm guidance for probabilistic (%) and categorical (Yes/No) forecasts Thunderstorm guidance is provided on the 5 -km NDFD grid Each thunderstorm product has its unique WMO heading For more information, visit the LAMP GRIB 2 Encoding Details Website: http: //www. nws. noaa. gov/mdl/gfslamp/docs/lampgrib 2. shtml

GFS LAMP IN AWIPS D 2 D To view the step-by-step processes for accessing these products, consult the GFS LAMP jobsheets at: http: //www. nws. noaa. gov/mdl/gfslamp/docs/jobsheets. shtml

Text Bulletin in D 2 D *Use AWIPS PIL - LAV

Station Plots Under the Local Menu

GFS LAMP Station Plots

Ceiling Height/Visibility Plots Under the Local Menu

GFS LAMP Ceiling/Visibility Plots Top: Ceiling Height (100 s of feet) Bottom: Visibility (miles)

Time Series of LAMP Forecasts in Volume Browser Points are assigned by clicking and dragging a labeled point on the US map or using “Choose by Station ID” under the Tools dropdown menu.

Time. Series Station Plot The user can also plot the observations to see real-time verification of a LAMP forecast

GFS LAMP Gridded Thunderstorms in the Volume Browser

Gridded Thunderstorm Probabilities

Gridded Thunderstorm Yes/No Categorical Occurrence

GFS LAMP IN AWIPS AVNFPS

Avn. FPS TAF Editor This tab is selected for LAMP guidance For choosing displayable format of data

LAMP Guidance in Table Format Toggles LAMP Probabilities Toggles Flight Categories color background

GFS LAMP Guidance in TAF Format (long) Long version of GFS LAMP guidance TAF

GFS LAMP Guidance in TAF Format (short) Condensed version of GFS LAMP guidance TAF

GFS LAMP Products on the Web To view these products online, visit: http: //www. nws. noaa. gov/mdl/gfslamp. shtml

GFS LAMP Website Ø Ø Ø Analysis Images Text Bulletins Station Meteograms Station Plots Thunderstorm Images Verification Images

GFS LAMP Analysis Page Analyzed elements are: n n n n Temperature Dewpoint Theta-E Mixing Ratio Saturation Deficit Radar Sea Level Pressure & Winds *The looping control on the analysis page animates images for the previous 23 hours up to the current time

Options for Viewing Text Bulletins n Full Text Message n n By State n n Includes all sites on one page The user can click on a state to display text bulletins for all of its stations Custom station list n The user can select as many stations as he or she wants from a list organized by state

GFS LAMP Station Meteograms Features • Up to 12 displayable GFS LAMP forecast elements • Real-time verification of current and past cycles • Verification of completed past cycles including the corresponding GFS MOS forecast

Meteogram Case Studies A closer look highlighting helpful ways to utilize this product…

Case Study #1: Timing of a Weather Event The meteograms can be helpful in determining the timing of a particular weather event. In the example above, LAMP correctly forecasted that precipitation would begin at 08 Z Monday, which was eight hours before the event, but missed the onset of the thunderstorms by one hour.

Case Study #2: Another Timing of a Weather Event In another example, these meteograms show LAMP handling the timing of a high wind event by correctly forecasting 40 knot gusts and diminishing the high winds in the overnight hours.

Case Study #3: The Influence of the Observation (Improvement) LAMP was able to catch this dense fog event on Monday morning, when the 06 Z MOS had no reduced visibilities. The influence of the observed dense fog allowed the LAMP to “update” the MOS forecast and correctly depict this event.

Case Study #4: The Influence of the Observation (Degradation) The above image shows the 00 Z LAMP temperature and dewpoint meteograms with the corresponding GFS MOS forecast and the verifying observation. You’ll notice that the observation becomes bad after 15 Z. On the next slide, we will see how this impacts the temperature and dewpoint forecasts at the 18 Z cycle.

Case Study #4 Continued With bad observations still being reported at 18 Z, we see a negative influence on the temperature and dewpoint forecasts. The influence of this observation causes the LAMP forecasts to be unreasonably lower than MOS at many of the forecast projections.

Case Study #5: Using POPO and Thunderstorm Probabilities In this example, the LAMP categorical forecast missed observed thunderstorms during 10 - 14 Z. However, the probabilistic thunderstorm forecast shows significant values (below the threshold) during 10 Z – 12 Z. Thus, forecasters can infer the chance of thunderstorms, even with a “no” categorical forecast.

GFS LAMP Station Plots Elements • Flight Category • Ceiling Height • Visibility • Obstruction to Vision • Total Sky Cover • Precipitation Type • Probability of Precipitation • Wind Speed • Wind Gust • Wind Direction • Temperature Click an element name on this slide to see its plot • Dewpoint

A closer look at the station plots… Two examples of how to use the station plot images

Identifying a Frontal Boundary Wind Direction Dewpoint 12 Z Surface Map Click on one of the above choices to see its plot Notice the sharp dewpoint gradient and wind shift in the central United States, helping to identify the presence of a cold front.

Locating the Rain/Snow Line The station plots allow the user to get a spatial understanding of the stationbased forecasts. This could prove useful in precipitation type forecast.

Other Station Plots Features On the webpage, click on the map to zoom into a region The looping controls animate plots in time on the webpage The user can mouseover valid times for an alternate way to display a new plot

GFS LAMP Thunderstorm Images Probability of a Thunderstorm during a 2 -Hour Period

GFS LAMP Thunderstorm Images Categorical Yes/No Thunderstorm Forecast during a 2 -Hour Period

Viewing GFS LAMP Verification • The user can view the verification scores for GFS LAMP elements at each implemented cycle and season. • On the website, clicking here will bring up the FAQ page for specific information on these plots.

Summary n LAMP offers a diverse selection of graphical and textual depictions of its forecast elements. n These products are available through the SBN/NOAAPort, the NWS FTP Server, D 2 D in AWIPS, Avn. FPS in AWIPS, and the website. n Although there is some overlap, each method of accessing LAMP guidance contains unique products and weather element information. n Full use of these products can provide a more complete understanding of the GFS LAMP forecast in a synoptic and temporal context, as well as insights into the strengths and weaknesses of the guidance. n For more information, visit the LAMP website: http: //www. nws. noaa. gov/mdl/lamp/index. shtml
 Gfs lamp mos
 Downloading and accessing
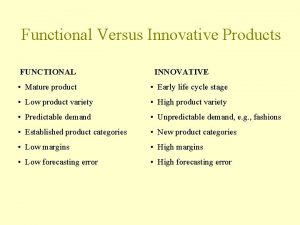
 Examples of functional and innovative products
 Accessing i/o devices
 Accessing io devices in computer organization
 Accessing mainframe data from java
 Flipping bits in memory without accessing them
 Mutable file system
 Accessing input output devices
 Accessing complex texts
 Marketing mix of pepsi and coca cola
 Gfs paper
 Gfs in cloud computing
 R/nfs
R/nfs Ecmwf vs gfs
 Meteo phase gfs
 Gfs google file system
 Brad karp ucl
 Gfs upgrade
 Gfs hurricane
 Gfs architecture
 Gfs google
 Gfs architecture
 Gfs israel
 Gfs
Gfs Apche hadoop
 Gfs
Gfs Gfs
Gfs Convection definition
 Hadoop gfs
 Sinais
 Google file system paper
 Gfs model guidance
 Gfs vs hdfs
 North ops
 Station model and weather symbols
 Whether the weather is fine tongue twister
 Clothes poem
 It's rainy and windy
 Weather vs whether
 Heavy weather by weather report
 Capital weather gang weather wall
 Multiplying decimals using partial products
 Using special products part 2
 National weather map
 National weather service forecast
 National weather service mobile pensacola
 Nws pensacola


