
Reducing Systematic Biases with Improved Physics in NOAAs
Reducing Systematic Biases with Improved Physics in NOAA’s Next Generation Global Prediction System Fanglin Yang Anning Cheng, Jongil Han, Jack Kain, Jesse Meng, Shrinivas Moorthi, Ruiyu Sun, Helin Wei, Youlong Xia, Rongqian Yang, Valery Yudin, Weizhong Zheng Environmental Modeling Center National Centers for Environmental Prediction College Park, Maryland, USA WGNE 34, 24 -27 Sept 2019, DWD, Offenbach, Germany 1
GFS. v 15 Transition to Operation Finite-Volume Cubed-Sphere Dynamical Core (FV 3) Microphysics Scheme with Multiple Prognostic Cloud Hydrometers In Operation: June 12, 2019 Configuration: ● High-res: C 768 (~13 km) ● Data Assimilation: C 384 (~25 km, 80 member ensemble) ● 64 layer, top at 0. 2 h. Pa ● Uniform resolution for all 16 days of forecast ● Dycore: FV 3, non-hydrostatic, single precision ● Physics: GFS Physics + GFDL Cloud Microphysics, double precision 2
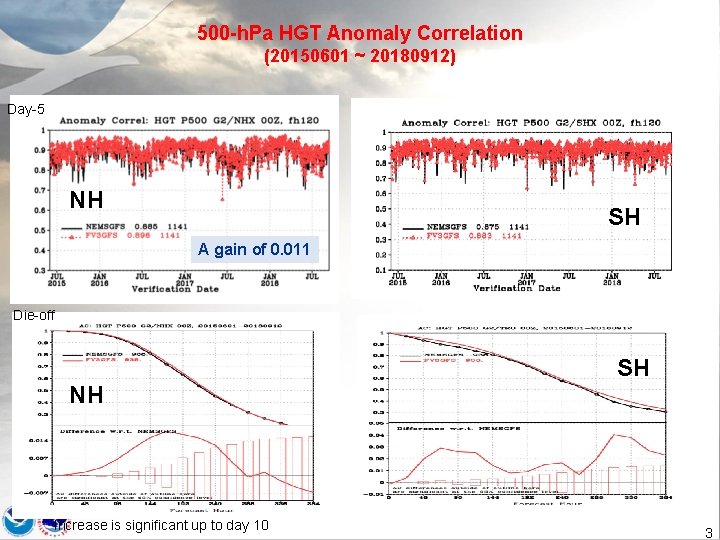
500 -h. Pa HGT Anomaly Correlation (20150601 ~ 20180912) Day-5 NH SH A gain of 0. 011 Die-off SH NH Increase is significant up to day 10 3
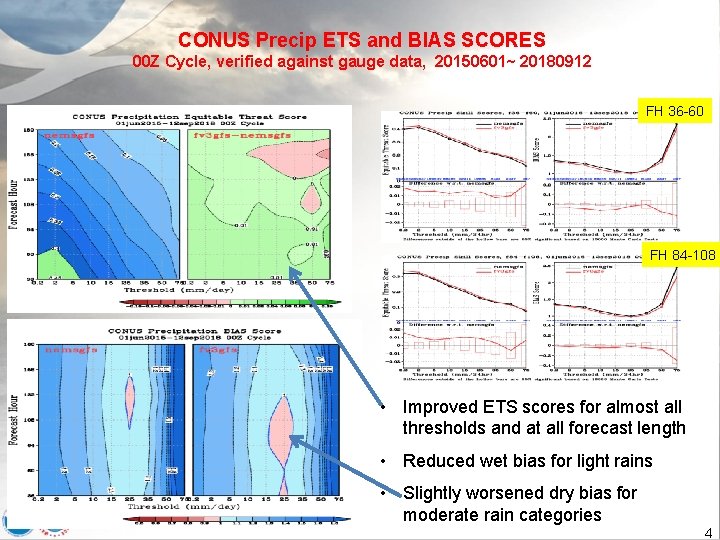
CONUS Precip ETS and BIAS SCORES 00 Z Cycle, verified against gauge data, 20150601~ 20180912 FH 36 -60 FH 84 -108 • Improved ETS scores for almost all thresholds and at all forecast length • Reduced wet bias for light rains • Slightly worsened dry bias for moderate rain categories 4
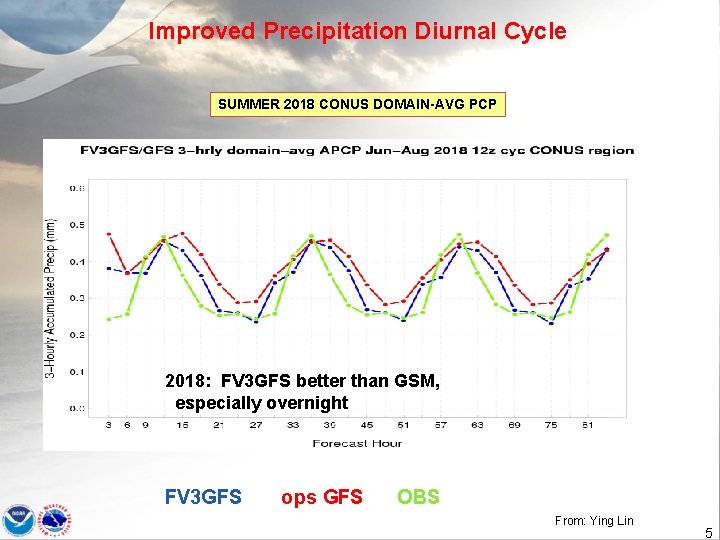
Improved Precipitation Diurnal Cycle SUMMER 2018 CONUS DOMAIN-AVG PCP 2018: FV 3 GFS better than GSM, especially overnight FV 3 GFS ops GFS OBS From: Ying Lin 5
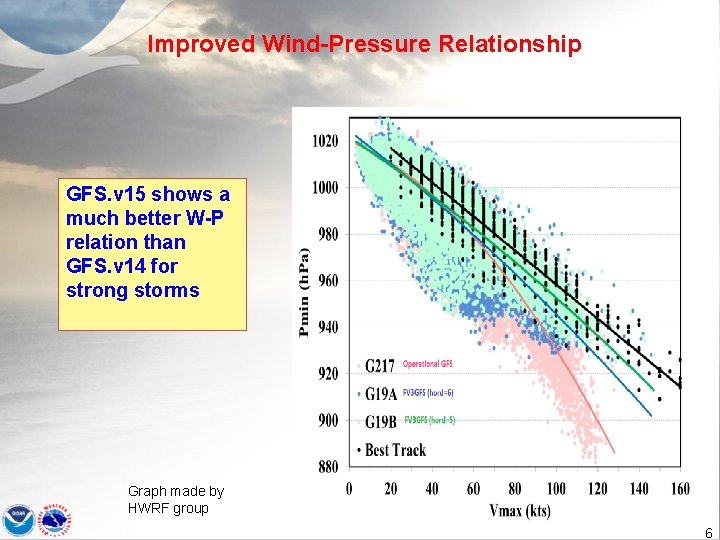
Improved Wind-Pressure Relationship GFS. v 15 shows a much better W-P relation than GFS. v 14 for strong storms Graph made by HWRF group 6
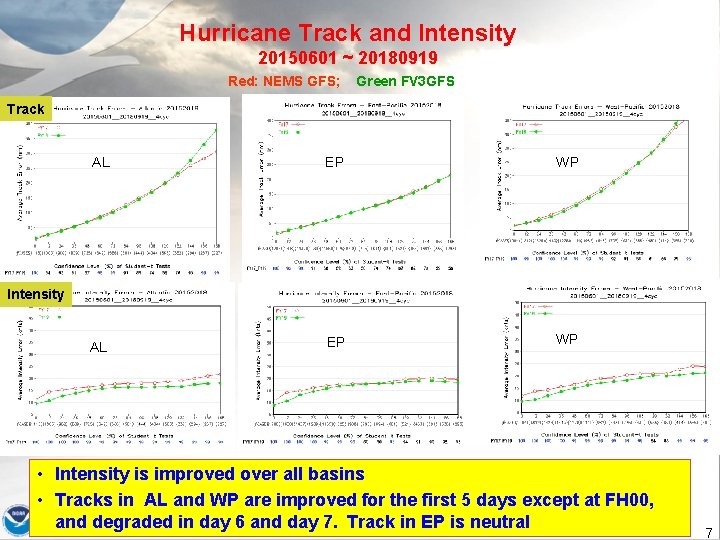
Hurricane Track and Intensity 20150601 ~ 20180919 Red: NEMS GFS; Green FV 3 GFS Track AL EP WP Intensity • Intensity is improved over all basins • Tracks in AL and WP are improved for the first 5 days except at FH 00, and degraded in day 6 and day 7. Track in EP is neutral 7
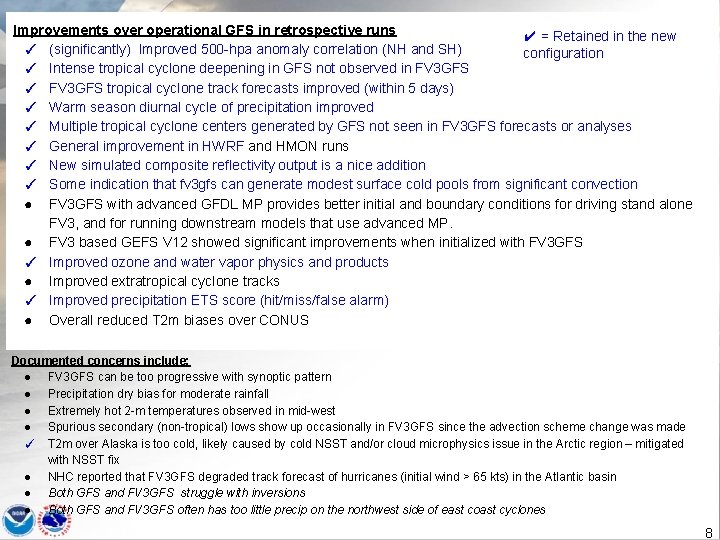
Improvements over operational GFS in retrospective runs ✔ = Retained in the new ✓ (significantly) Improved 500 -hpa anomaly correlation (NH and SH) configuration ✓ Intense tropical cyclone deepening in GFS not observed in FV 3 GFS ✓ FV 3 GFS tropical cyclone track forecasts improved (within 5 days) ✓ Warm season diurnal cycle of precipitation improved ✓ Multiple tropical cyclone centers generated by GFS not seen in FV 3 GFS forecasts or analyses ✓ General improvement in HWRF and HMON runs ✓ New simulated composite reflectivity output is a nice addition ✓ Some indication that fv 3 gfs can generate modest surface cold pools from significant convection ● FV 3 GFS with advanced GFDL MP provides better initial and boundary conditions for driving stand alone FV 3, and for running downstream models that use advanced MP. ● FV 3 based GEFS V 12 showed significant improvements when initialized with FV 3 GFS ✓ Improved ozone and water vapor physics and products ● Improved extratropical cyclone tracks ✓ Improved precipitation ETS score (hit/miss/false alarm) ● Overall reduced T 2 m biases over CONUS Documented concerns include: ● FV 3 GFS can be too progressive with synoptic pattern ● Precipitation dry bias for moderate rainfall ● Extremely hot 2 -m temperatures observed in mid-west ● Spurious secondary (non-tropical) lows show up occasionally in FV 3 GFS since the advection scheme change was made ✓ T 2 m over Alaska is too cold, likely caused by cold NSST and/or cloud microphysics issue in the Arctic region – mitigated with NSST fix ● NHC reported that FV 3 GFS degraded track forecast of hurricanes (initial wind > 65 kts) in the Atlantic basin ● Both GFS and FV 3 GFS struggle with inversions ● Both GFS and FV 3 GFS often has too little precip on the northwest side of east coast cyclones 8
Systematic Biases to be Addressed in GFS. v 16 • PBL inversion • Cold bias in the lower troposphere in winter • Surface temperature biases • Biases in the upper atmosphere • Degraded track forecast of hurricanes (initial wind > 65 kts) in the Atlantic basin 9
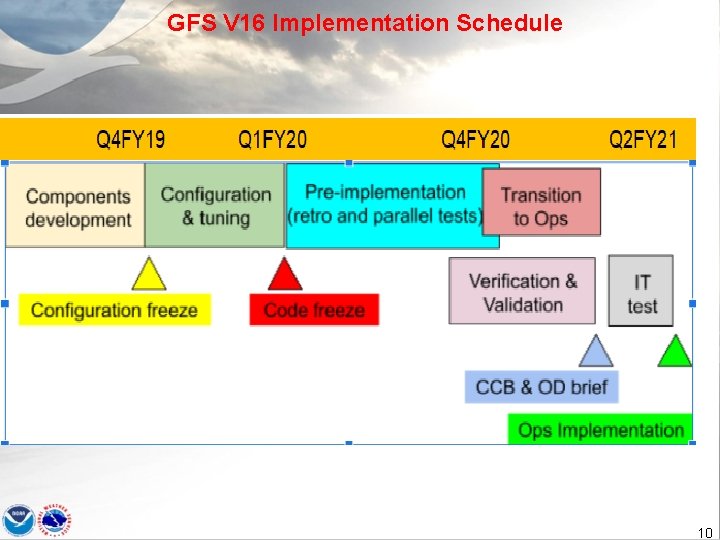
GFS V 16 Implementation Schedule 10
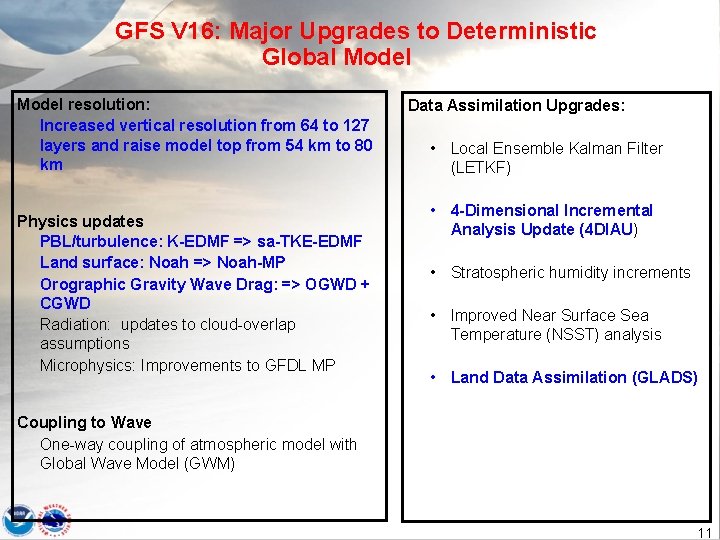
GFS V 16: Major Upgrades to Deterministic Global Model resolution: Increased vertical resolution from 64 to 127 layers and raise model top from 54 km to 80 km Physics updates PBL/turbulence: K-EDMF => sa-TKE-EDMF Land surface: Noah => Noah-MP Orographic Gravity Wave Drag: => OGWD + CGWD Radiation: updates to cloud-overlap assumptions Microphysics: Improvements to GFDL MP Data Assimilation Upgrades: • Local Ensemble Kalman Filter (LETKF) • 4 -Dimensional Incremental Analysis Update (4 DIAU) • Stratospheric humidity increments • Improved Near Surface Sea Temperature (NSST) analysis • Land Data Assimilation (GLADS) Coupling to Wave One-way coupling of atmospheric model with Global Wave Model (GWM) 11
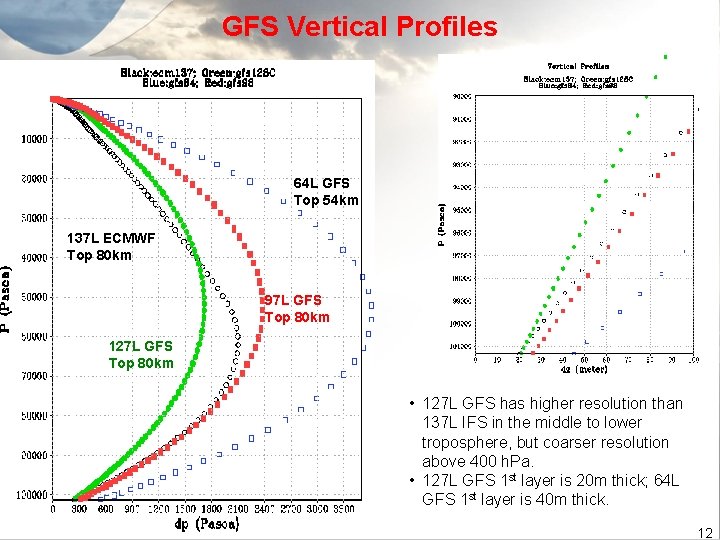
GFS Vertical Profiles 64 L GFS Top 54 km 137 L ECMWF Top 80 km 97 L GFS Top 80 km 127 L GFS Top 80 km • 127 L GFS has higher resolution than 137 L IFS in the middle to lower troposphere, but coarser resolution above 400 h. Pa. • 127 L GFS 1 st layer is 20 m thick; 64 L GFS 1 st layer is 40 m thick. 12
Reducing Biases in the Upper Atmosphere • model’s “climate” mean state • • 2 -year C 192 L 127 “AMIP” Run • IFS IC, 5 Jan 2017 13
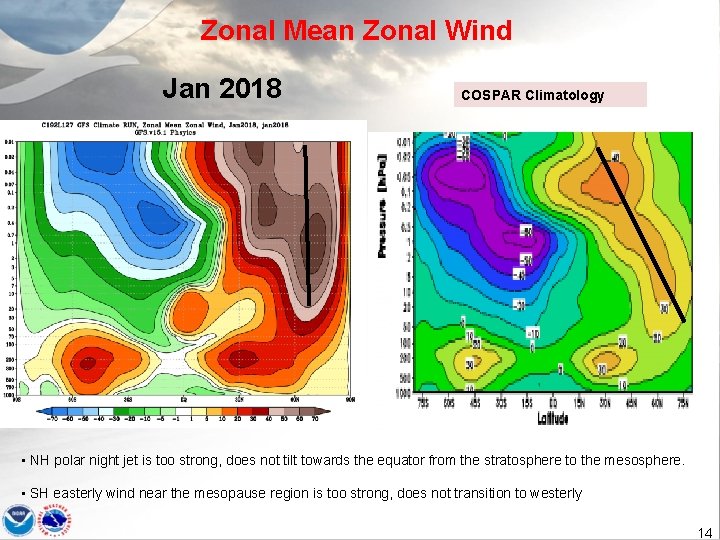
Zonal Mean Zonal Wind Jan 2018 COSPAR Climatology • NH polar night jet is too strong, does not tilt towards the equator from the stratosphere to the mesosphere. • SH easterly wind near the mesopause region is too strong, does not transition to westerly 14
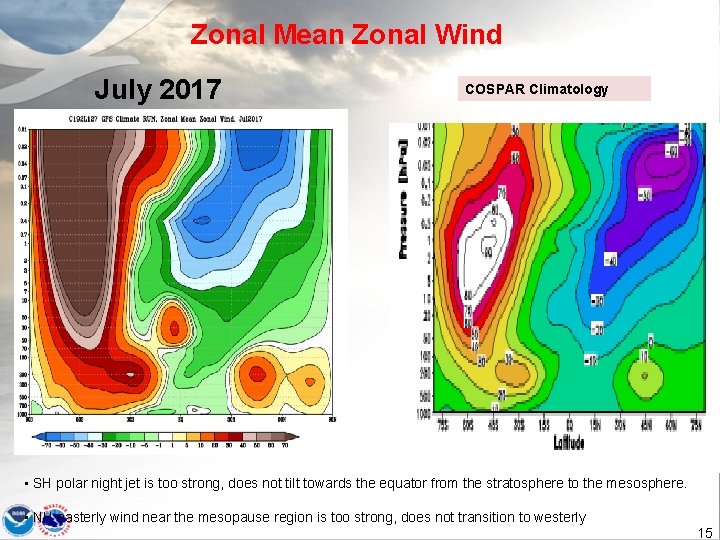
Zonal Mean Zonal Wind July 2017 COSPAR Climatology • SH polar night jet is too strong, does not tilt towards the equator from the stratosphere to the mesosphere. • NH easterly wind near the mesopause region is too strong, does not transition to westerly 15
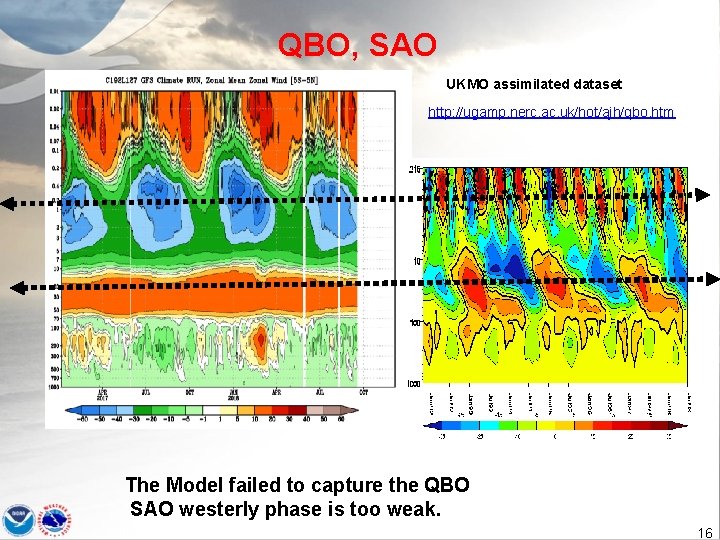
QBO, SAO UKMO assimilated dataset http: //ugamp. nerc. ac. uk/hot/ajh/qbo. htm The Model failed to capture the QBO SAO westerly phase is too weak. 16
Improved climate mean state ● with Unified Gravity-Wave Physics, which includes both parameterized orographic and non-orographic GWD ● ● 2 -year C 192 L 127 Climate/AMIP Run ● IFS IC, 5 Jan 2017 17
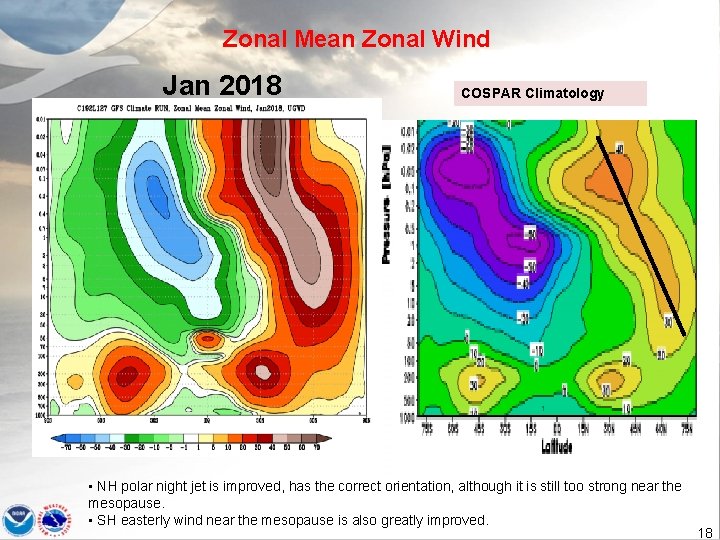
Zonal Mean Zonal Wind Jan 2018 COSPAR Climatology • NH polar night jet is improved, has the correct orientation, although it is still too strong near the mesopause. • SH easterly wind near the mesopause is also greatly improved. 18
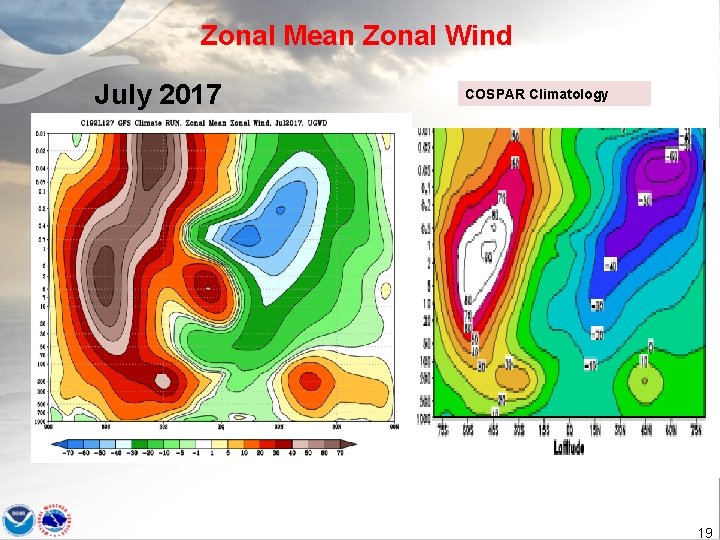
Zonal Mean Zonal Wind July 2017 COSPAR Climatology 19
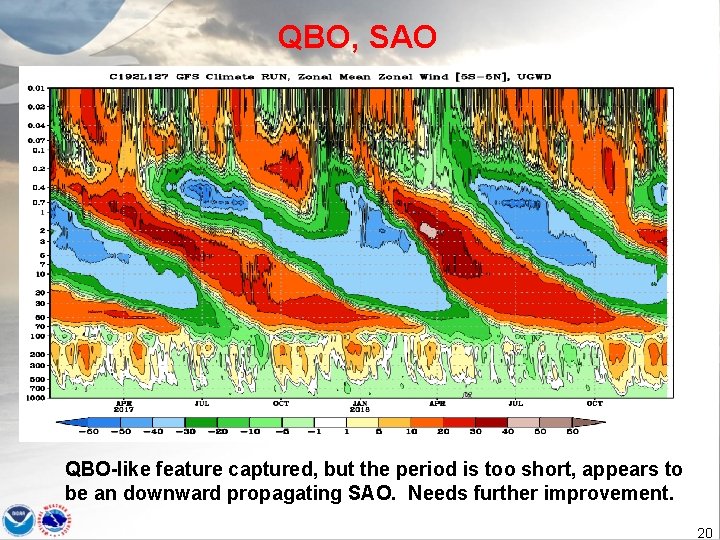
QBO, SAO QBO-like feature captured, but the period is too short, appears to be an downward propagating SAO. Needs further improvement. 20
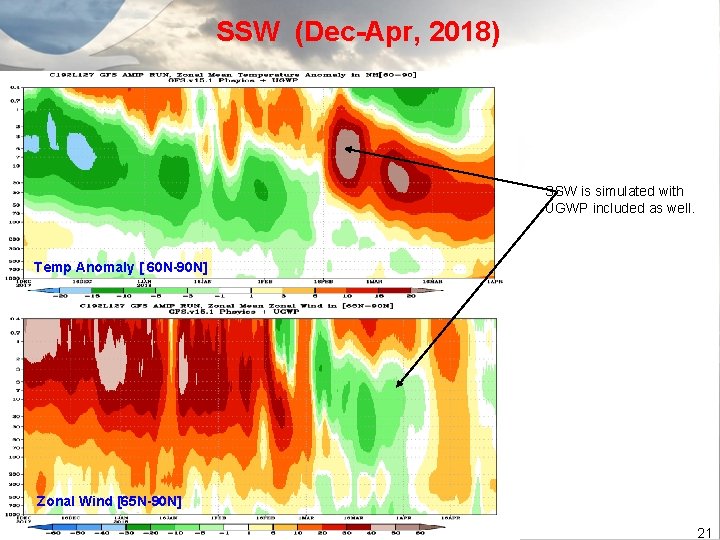
SSW (Dec-Apr, 2018) SSW is simulated with UGWP included as well. Temp Anomaly [ 60 N-90 N] Zonal Wind [65 N-90 N] 21

Improving PBL Inversion 22
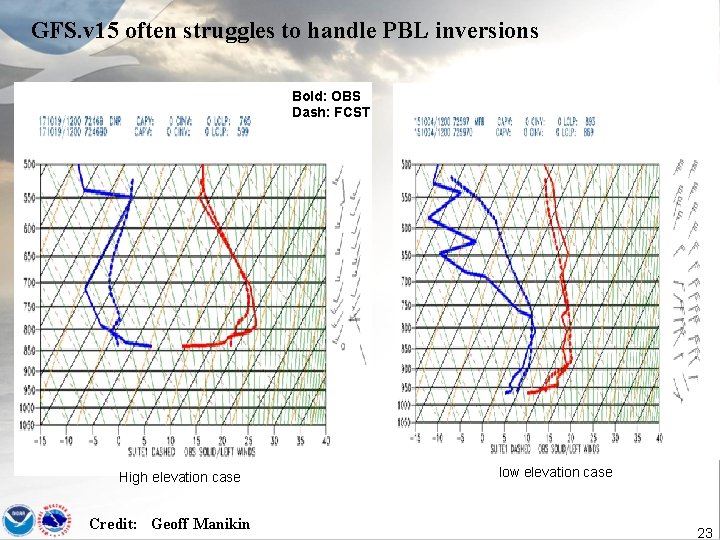
GFS. v 15 often struggles to handle PBL inversions Bold: OBS Dash: FCST High elevation case Credit: Geoff Manikin low elevation case 23
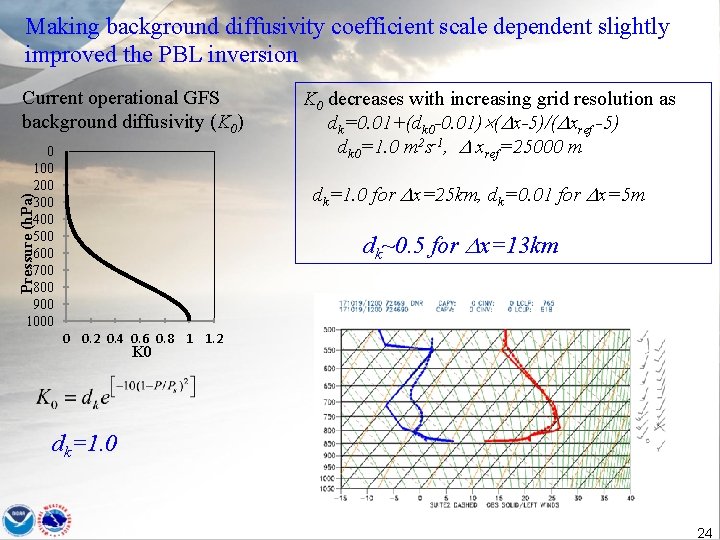
Making background diffusivity coefficient scale dependent slightly improved the PBL inversion Current operational GFS background diffusivity (K 0) 0 100 200 300 400 500 600 700 800 900 1000 K 0 decreases with increasing grid resolution as dk=0. 01+(dk 0 -0. 01) ( x-5)/( xref -5) dk 0=1. 0 m 2 s-1, xref=25000 m Pressure (h. Pa) dk=1. 0 for x=25 km, dk=0. 01 for x=5 m dk~0. 5 for x=13 km 0 0. 2 0. 4 0. 6 0. 8 1 1. 2 K 0 dk=1. 0 24
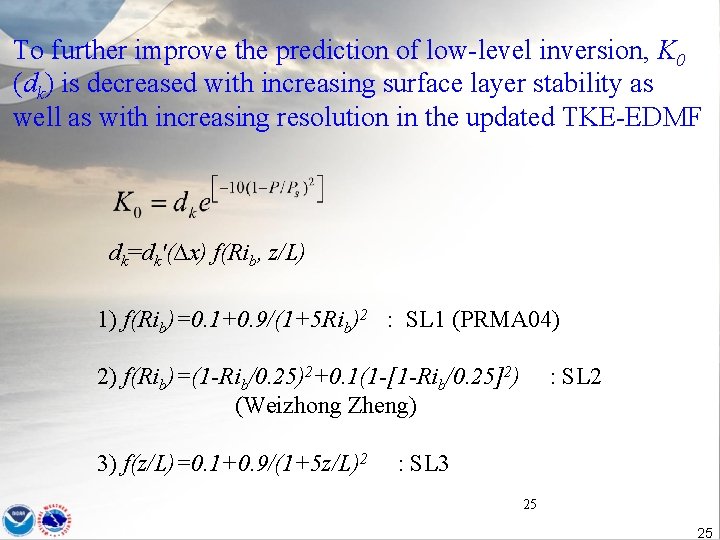
To further improve the prediction of low-level inversion, K 0 (dk) is decreased with increasing surface layer stability as well as with increasing resolution in the updated TKE-EDMF dk=dk'(∆x) f(Rib, z/L) 1) f(Rib)=0. 1+0. 9/(1+5 Rib)2 : SL 1 (PRMA 04) 2) f(Rib)=(1 -Rib/0. 25)2+0. 1(1 -[1 -Rib/0. 25]2) (Weizhong Zheng) 3) f(z/L)=0. 1+0. 9/(1+5 z/L)2 : SL 3 25 25
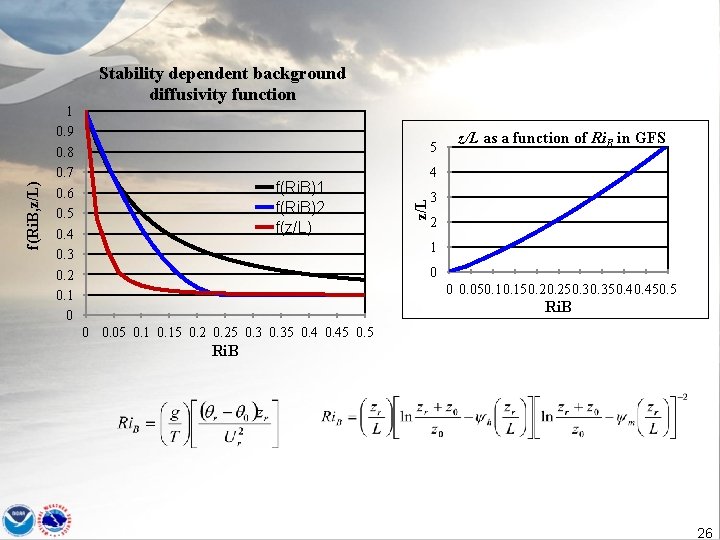
5 f(Ri. B)1 f(Ri. B)2 f(z/L) z/L as a function of Ri. B in GFS 4 z/L f(Ri. B, z/L) 1 0. 9 0. 8 0. 7 0. 6 0. 5 0. 4 0. 3 0. 2 0. 1 0 Stability dependent background diffusivity function 3 2 1 0 0 0. 05 0. 15 0. 25 0. 35 0. 45 0. 5 Ri. B 26
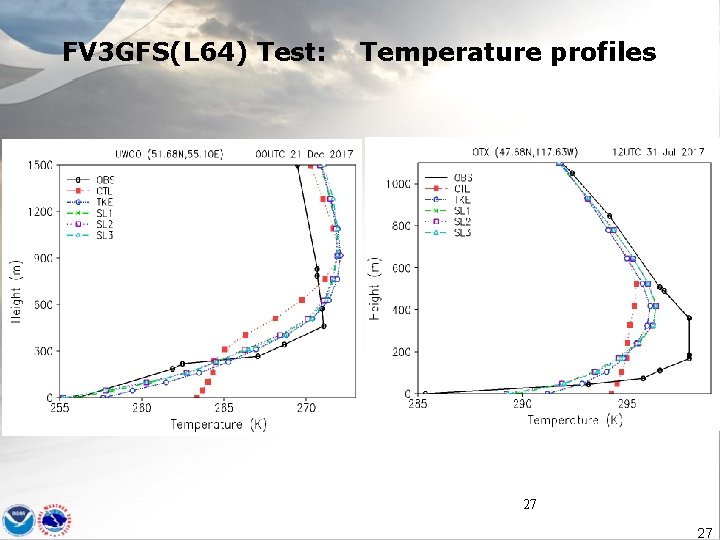
FV 3 GFS(L 64) Test: Temperature profiles 27 27
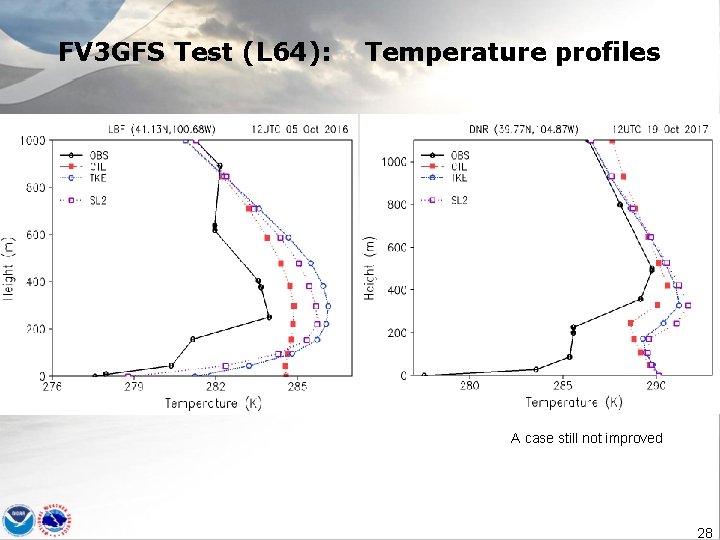
FV 3 GFS Test (L 64): Temperature profiles A case still not improved 28
Reducing Cold Biases in the lower troposphere 29
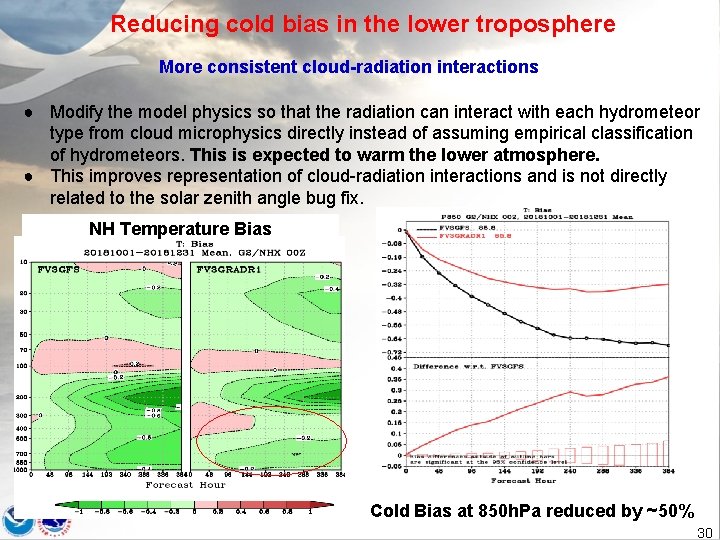
Reducing cold bias in the lower troposphere More consistent cloud-radiation interactions ● Modify the model physics so that the radiation can interact with each hydrometeor type from cloud microphysics directly instead of assuming empirical classification of hydrometeors. This is expected to warm the lower atmosphere. ● This improves representation of cloud-radiation interactions and is not directly related to the solar zenith angle bug fix. NH Temperature Bias Cold Bias at 850 h. Pa reduced by ~50% 30
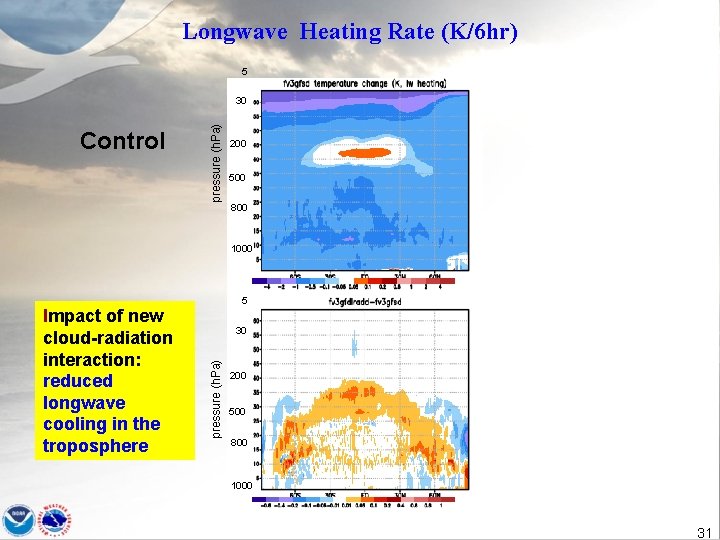
Longwave Heating Rate (K/6 hr) 5 Control pressure (h. Pa) 30 200 500 800 1000 5 30 pressure (h. Pa) Impact of new cloud-radiation interaction: reduced longwave cooling in the troposphere 200 500 800 1000 31
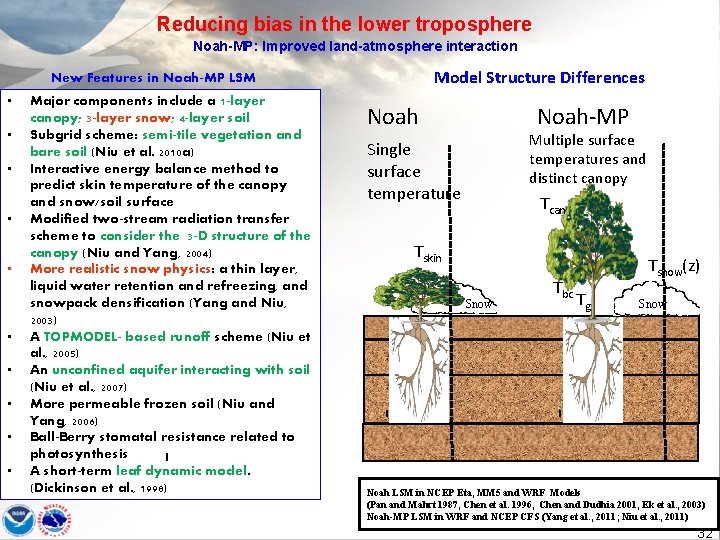
Reducing bias in the lower troposphere Noah-MP: Improved land-atmosphere interaction Model Structure Differences New Features in Noah-MP LSM • • • Major components include a 1 -layer canopy; 3 -layer snow; 4 -layer soil Subgrid scheme: semi-tile vegetation and bare soil (Niu et al. 2010 a) Interactive energy balance method to predict skin temperature of the canopy and snow/soil surface Modified two-stream radiation transfer scheme to consider the 3 -D structure of the canopy (Niu and Yang, 2004) More realistic snow physics: a thin layer, liquid water retention and refreezing, and snowpack densification (Yang and Niu, 2003) A TOPMODEL- based runoff scheme (Niu et al. , 2005) An unconfined aquifer interacting with soil (Niu et al. , 2007) More permeable frozen soil (Niu and Yang, 2006) Ball-Berry stomatal resistance related to photosynthesis A short-term leaf dynamic model. (Dickinson et al. , 1998) Noah-MP Noah Multiple surface temperatures and distinct canopy Single surface temperature Tcan Tskin Snow Tbc Tsnow(z) Tg Snow Noah LSM in NCEP Eta, MM 5 and WRF Models (Pan and Mahrt 1987, Chen et al. 1996, Chen and Dudhia 2001, Ek et al. , 2003) Noah-MP LSM in WRF and NCEP CFS (Yang et al. , 2011; Niu et al. , 2011) 32
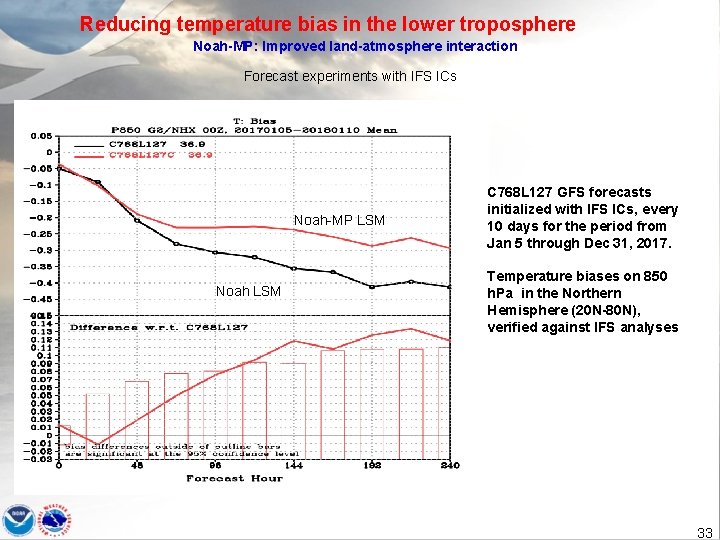
Reducing temperature bias in the lower troposphere Noah-MP: Improved land-atmosphere interaction Forecast experiments with IFS ICs Noah-MP LSM Noah LSM C 768 L 127 GFS forecasts initialized with IFS ICs, every 10 days for the period from Jan 5 through Dec 31, 2017. Temperature biases on 850 h. Pa in the Northern Hemisphere (20 N-80 N), verified against IFS analyses 33
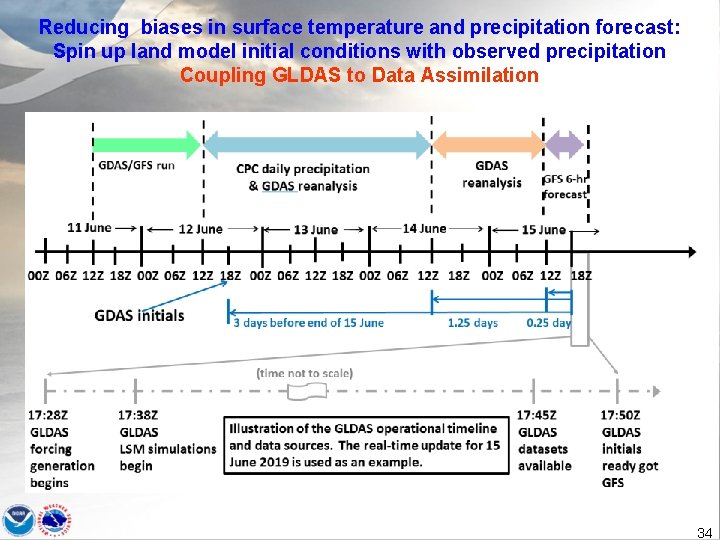
Reducing biases in surface temperature and precipitation forecast: Spin up land model initial conditions with observed precipitation Coupling GLDAS to Data Assimilation 34

Thanks 35
- Slides: 35