
Scientific Verification and Validation of NCEP GFS for

- Slides: 20
Scientific Verification and Validation of NCEP GFS for Operational Implementation Fanglin Yang Environmental Modeling Center National Centers for Environmental Prediction NEMS FV 3 GFS Community Modeling System Training and Tutorial: Planning and Preparation Meeting, 19 -20 July, 2017, GFDL 1
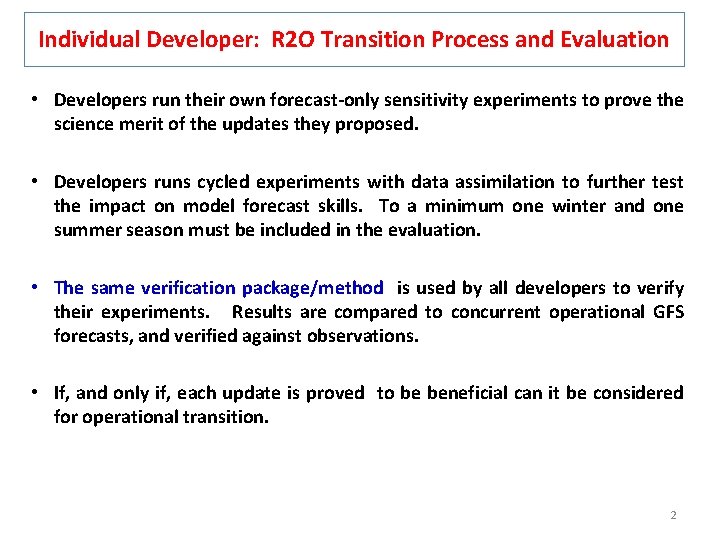
Individual Developer: R 2 O Transition Process and Evaluation • Developers run their own forecast-only sensitivity experiments to prove the science merit of the updates they proposed. • Developers runs cycled experiments with data assimilation to further test the impact on model forecast skills. To a minimum one winter and one summer season must be included in the evaluation. • The same verification package/method is used by all developers to verify their experiments. Results are compared to concurrent operational GFS forecasts, and verified against observations. • If, and only if, each update is proved to be beneficial can it be considered for operational transition. 2
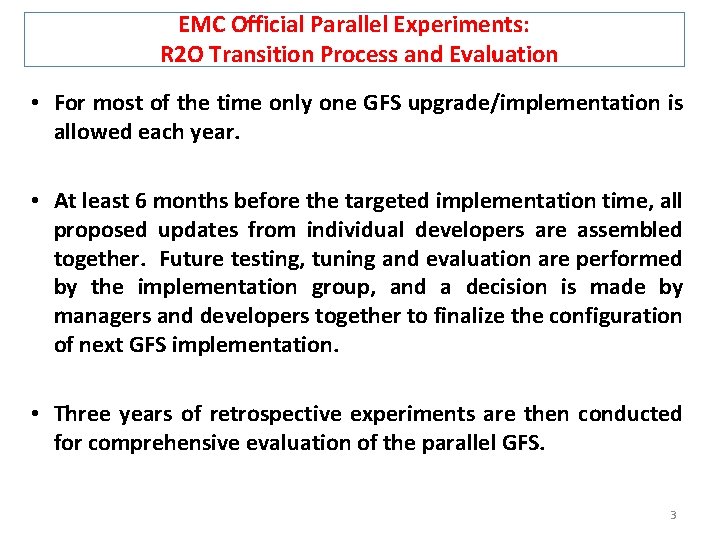
EMC Official Parallel Experiments: R 2 O Transition Process and Evaluation • For most of the time only one GFS upgrade/implementation is allowed each year. • At least 6 months before the targeted implementation time, all proposed updates from individual developers are assembled together. Future testing, tuning and evaluation are performed by the implementation group, and a decision is made by managers and developers together to finalize the configuration of next GFS implementation. • Three years of retrospective experiments are then conducted for comprehensive evaluation of the parallel GFS. 3
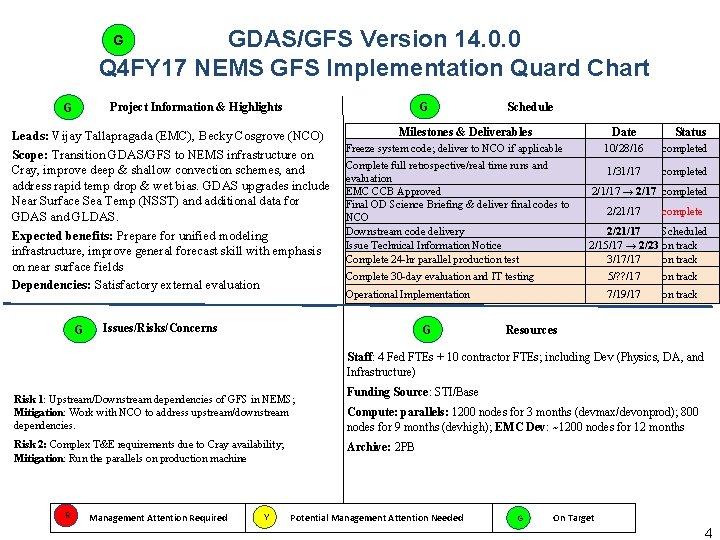
GDAS/GFS Version 14. 0. 0 Q 4 FY 17 NEMS GFS Implementation Quard Chart G G Project Information & Highlights G Leads: Vijay Tallapragada (EMC), Becky Cosgrove (NCO) Scope: Transition GDAS/GFS to NEMS infrastructure on Cray, improve deep & shallow convection schemes, and address rapid temp drop & wet bias. GDAS upgrades include Near Surface Sea Temp (NSST) and additional data for GDAS and GLDAS. Expected benefits: Prepare for unified modeling infrastructure, improve general forecast skill with emphasis on near surface fields Dependencies: Satisfactory external evaluation G Schedule Milestones & Deliverables Date Freeze system code; deliver to NCO if applicable Complete full retrospective/real time runs and evaluation EMC CCB Approved Final OD Science Briefing & deliver final codes to NCO Downstream code delivery Issue Technical Information Notice Complete 24 -hr parallel production test Complete 30 -day evaluation and IT testing G 10/28/16 completed 1/31/17 completed 2/1/17 → 2/17 completed 2/21/17 complete 2/21/17 2/15/17 → 2/23 3/17/17 5/? ? /17 Scheduled on track Operational Implementation Issues/Risks/Concerns Status 7/19/17 on track Resources Staff: 4 Fed FTEs + 10 contractor FTEs; including Dev (Physics, DA, and Infrastructure) Risk 1: Upstream/Downstream dependencies of GFS in NEMS; Mitigation: Work with NCO to address upstream/downstream dependencies. Risk 2: Complex T&E requirements due to Cray availability; Mitigation: Run the parallels on production machine R Management Attention Required Y Funding Source: STI/Base Compute: parallels: 1200 nodes for 3 months (devmax/devonprod); 800 nodes for 9 months (devhigh); EMC Dev: ~1200 nodes for 12 months Archive: 2 PB Potential Management Attention Needed G On Target 4
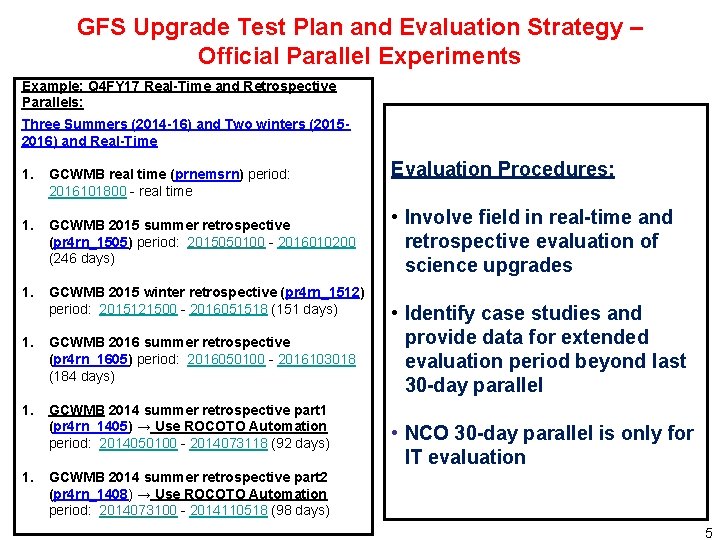
GFS Upgrade Test Plan and Evaluation Strategy – Official Parallel Experiments Example: Q 4 FY 17 Real-Time and Retrospective Parallels: Three Summers (2014 -16) and Two winters (20152016) and Real-Time 1. GCWMB real time (prnemsrn) period: 2016101800 - real time 1. GCWMB 2015 summer retrospective (pr 4 rn_1505) period: 2015050100 - 2016010200 (246 days) 1. GCWMB 2015 winter retrospective (pr 4 rn_1512) period: 2015121500 - 2016051518 (151 days) 1. GCWMB 2016 summer retrospective (pr 4 rn_1605) period: 2016050100 - 2016103018 (184 days) 1. GCWMB 2014 summer retrospective part 1 (pr 4 rn_1405) → Use ROCOTO Automation period: 2014050100 - 2014073118 (92 days) 1. Evaluation Procedures: • Involve field in real-time and retrospective evaluation of science upgrades • Identify case studies and provide data for extended evaluation period beyond last 30 -day parallel • NCO 30 -day parallel is only for IT evaluation GCWMB 2014 summer retrospective part 2 (pr 4 rn_1408) → Use ROCOTO Automation period: 2014073100 - 2014110518 (98 days) 5
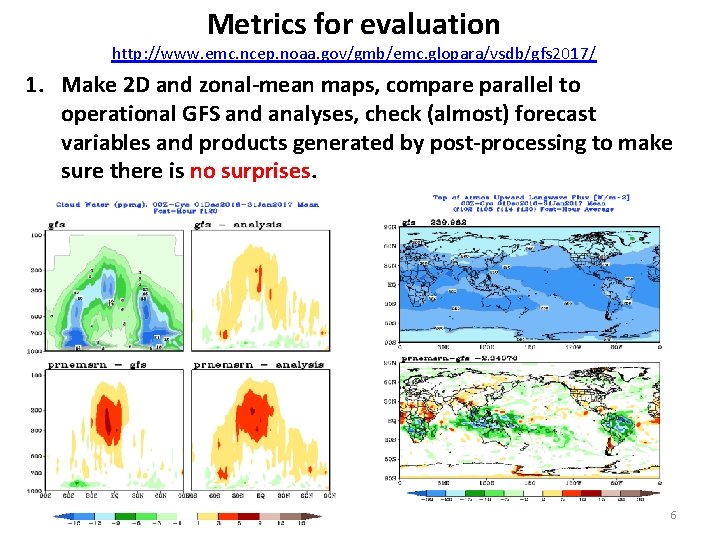
Metrics for evaluation http: //www. emc. ncep. noaa. gov/gmb/emc. glopara/vsdb/gfs 2017/ 1. Make 2 D and zonal-mean maps, compare parallel to operational GFS and analyses, check (almost) forecast variables and products generated by post-processing to make sure there is no surprises. 6
Metrics for evaluation 2. Make 2 D maps to compare forecasts to “observations” NAVP Climo Real-time CAMS T 2 m Real-time CERES SW CALIPSO Cloud Climo 7
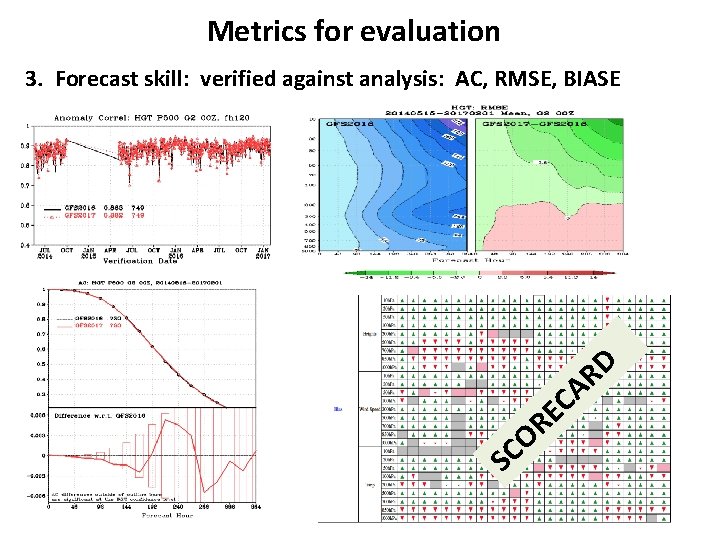
Metrics for evaluation 3. Forecast skill: verified against analysis: AC, RMSE, BIASE D R A O C S C E R
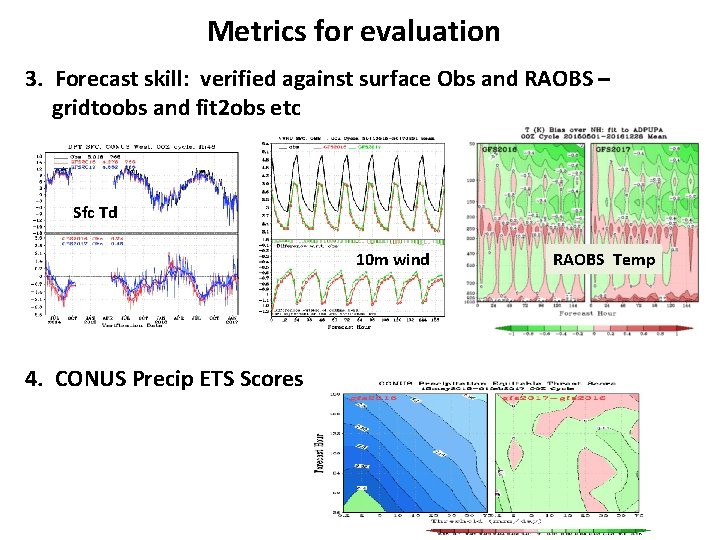
Metrics for evaluation 3. Forecast skill: verified against surface Obs and RAOBS – gridtoobs and fit 2 obs etc Sfc Td 10 m wind 4. CONUS Precip ETS Scores RAOBS Temp
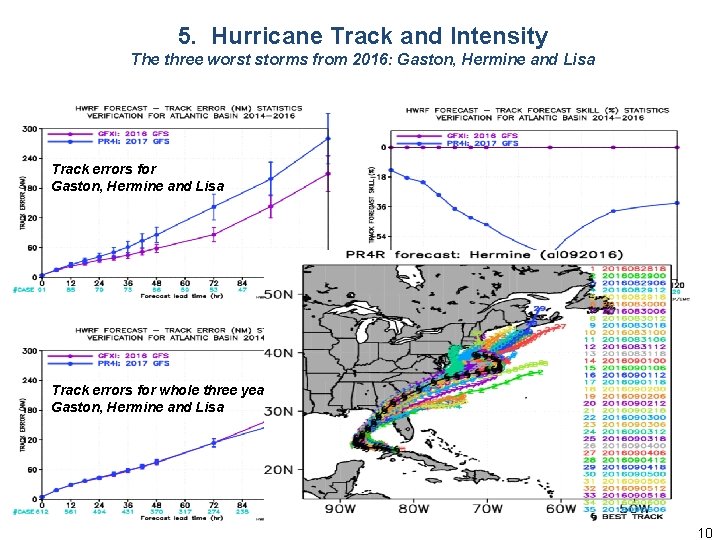
5. Hurricane Track and Intensity The three worst storms from 2016: Gaston, Hermine and Lisa Track errors for whole three years w/o Gaston, Hermine and Lisa 10
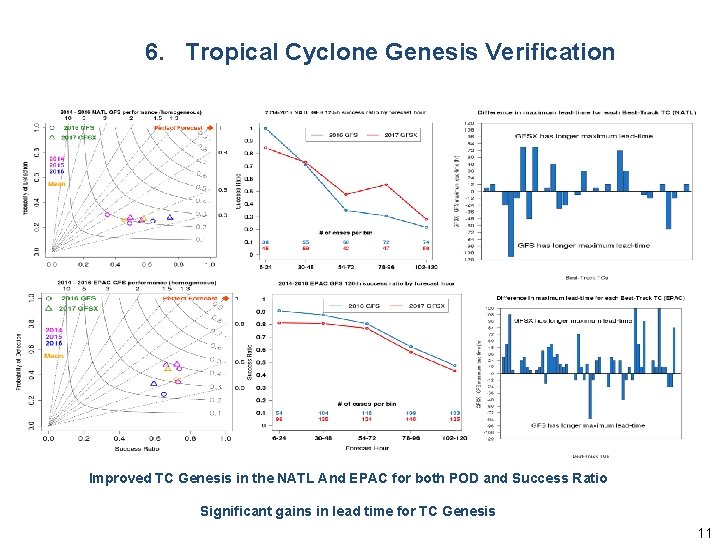
6. Tropical Cyclone Genesis Verification Improved TC Genesis in the NATL And EPAC for both POD and Success Ratio Significant gains in lead time for TC Genesis 11
Metrics for evaluation – and more • MODE verification of CAPE, precipitation, and Jet etc • Bufr sounding verification • Analyses increments • Cases studies (by EMC Model Evaluation Group) • Impact on computing resources, mass storages • ……. .
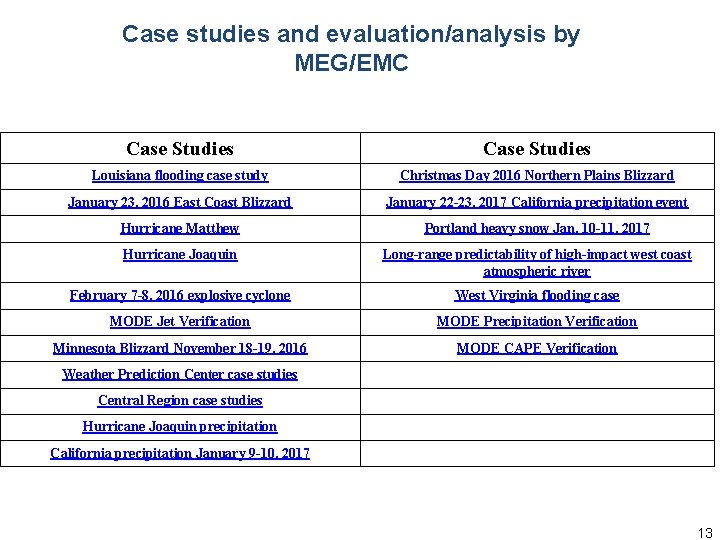
Case studies and evaluation/analysis by MEG/EMC Case Studies Louisiana flooding case study Christmas Day 2016 Northern Plains Blizzard January 23, 2016 East Coast Blizzard January 22 -23, 2017 California precipitation event Hurricane Matthew Portland heavy snow Jan. 10 -11, 2017 Hurricane Joaquin Long-range predictability of high-impact west coast atmospheric river February 7 -8, 2016 explosive cyclone West Virginia flooding case MODE Jet Verification MODE Precipitation Verification Minnesota Blizzard November 18 -19, 2016 MODE CAPE Verification Weather Prediction Center case studies Central Region case studies Hurricane Joaquin precipitation California precipitation January 9 -10, 2017 13
Downstream Impact and Field Office Evaluation
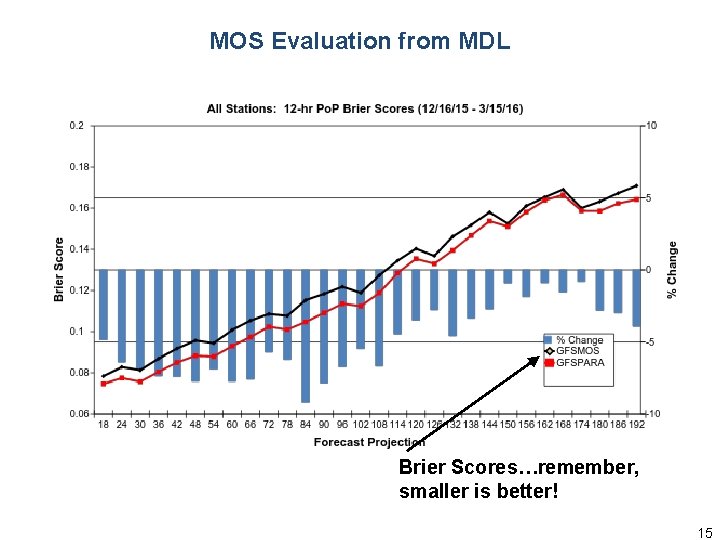
MOS Evaluation from MDL Brier Scores…remember, smaller is better! 15
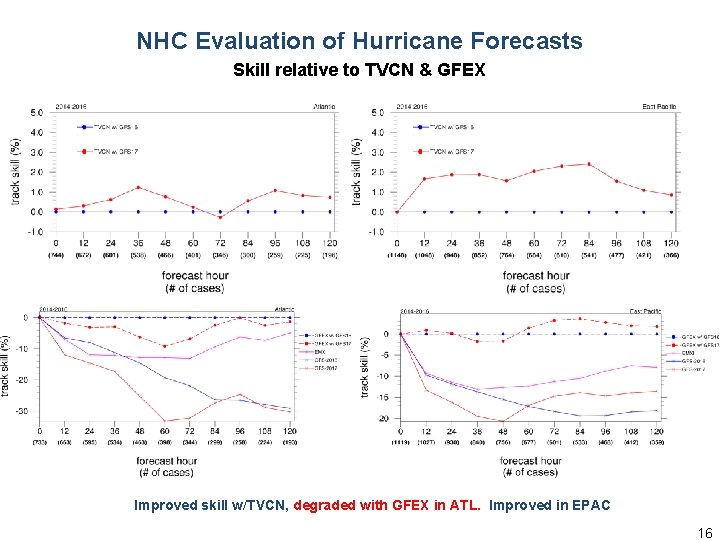
NHC Evaluation of Hurricane Forecasts Skill relative to TVCN & GFEX Improved skill w/TVCN, degraded with GFEX in ATL. Improved in EPAC 16
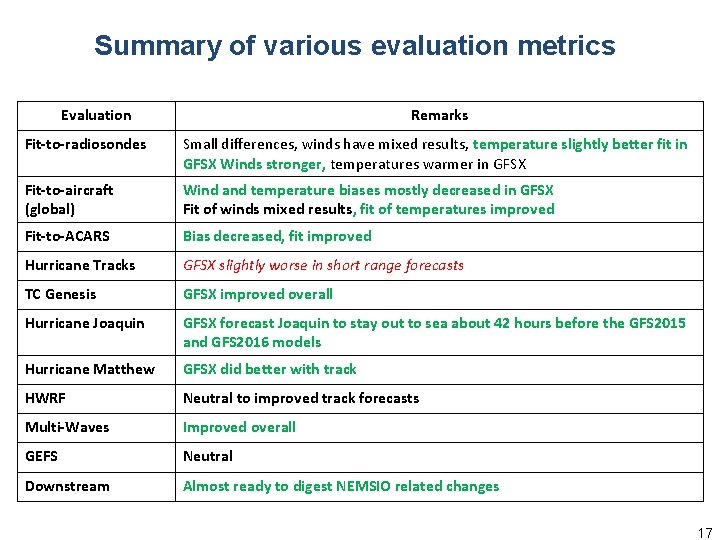
Summary of various evaluation metrics Evaluation Remarks Fit-to-radiosondes Small differences, winds have mixed results, temperature slightly better fit in GFSX Winds stronger, temperatures warmer in GFSX Fit-to-aircraft (global) Wind and temperature biases mostly decreased in GFSX Fit of winds mixed results, fit of temperatures improved Fit-to-ACARS Bias decreased, fit improved Hurricane Tracks GFSX slightly worse in short range forecasts TC Genesis GFSX improved overall Hurricane Joaquin GFSX forecast Joaquin to stay out to sea about 42 hours before the GFS 2015 and GFS 2016 models Hurricane Matthew GFSX did better with track HWRF Neutral to improved track forecasts Multi-Waves Improved overall GEFS Neutral Downstream Almost ready to digest NEMSIO related changes 17
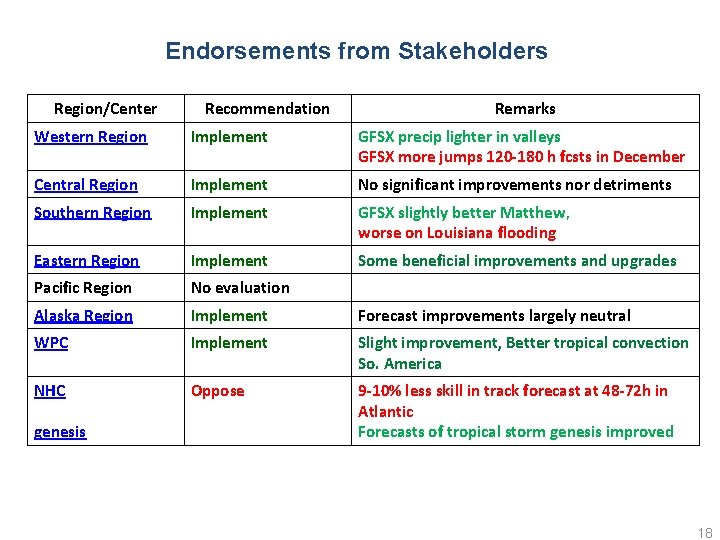
Endorsements from Stakeholders Region/Center Recommendation Remarks Western Region Implement GFSX precip lighter in valleys GFSX more jumps 120 -180 h fcsts in December Central Region Implement No significant improvements nor detriments Southern Region Implement GFSX slightly better Matthew, worse on Louisiana flooding Eastern Region Implement Some beneficial improvements and upgrades Pacific Region No evaluation Alaska Region Implement Forecast improvements largely neutral WPC Implement Slight improvement, Better tropical convection So. America NHC Oppose 9 -10% less skill in track forecast at 48 -72 h in Atlantic Forecasts of tropical storm genesis improved genesis 18
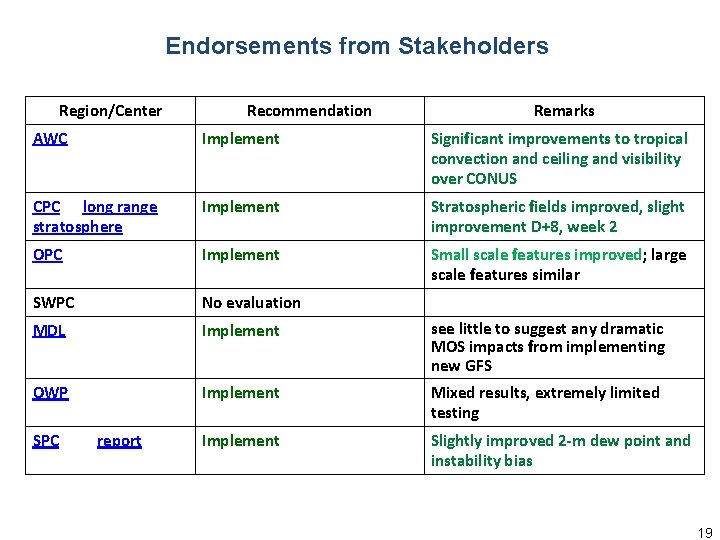
Endorsements from Stakeholders Region/Center Recommendation Remarks AWC Implement Significant improvements to tropical convection and ceiling and visibility over CONUS CPC long range stratosphere Implement Stratospheric fields improved, slight improvement D+8, week 2 OPC Implement Small scale features improved; large scale features similar SWPC No evaluation MDL Implement see little to suggest any dramatic MOS impacts from implementing new GFS OWP Implement Mixed results, extremely limited testing Implement Slightly improved 2 -m dew point and instability bias SPC report 19
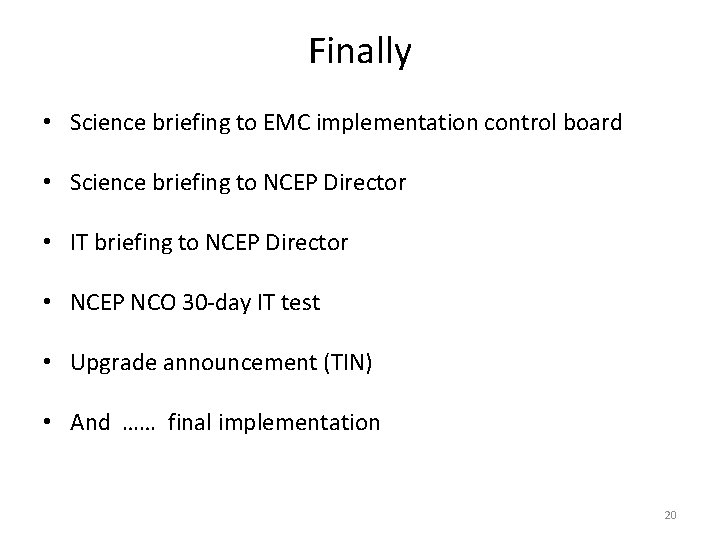
Finally • Science briefing to EMC implementation control board • Science briefing to NCEP Director • IT briefing to NCEP Director • NCEP NCO 30 -day IT test • Upgrade announcement (TIN) • And …… final implementation 20