MARINE WEATHER PRODUCTS The National Weather Service NWS
 is responsible for issuing warnings and")


 is responsible for the Atlantic tropical")

 Tropical Cyclone Danger Area Ice Edge and")


- Slides: 35
MARINE WEATHER PRODUCTS The National Weather Service (NWS) is responsible for issuing warnings and forecasts to protect life and property in the maritime community. Area of responsibility covers most of the North Atlantic and North Pacific N of 30 N with graphical products covering the marine areas S to 15 N. The Ocean Prediction Center (OPC) is responsible for issuance of various marine products. These products are distributed by high-frequency (HF) Radiofacsimile broadcast via the US Coast Guard Communications Centers at Boston, MA, New Orleans, LA, Pt Reyes, Ca, and Kodiak, AK. Products are also available on the internet and by user e-mail request. Thorough HF Radiofacsimile broadcast, 3 primary types of marine products are issued: 1. upper air 500 millibar (mb) charts, 2. surface pressure charts 3. sea state charts. Additional charts include sea surface temperatures (SST), tropical streamline and meteorological satellite imagery.
NWS MARINE FORECAST AREAS
NWS MARINE WARNINGS AREAS
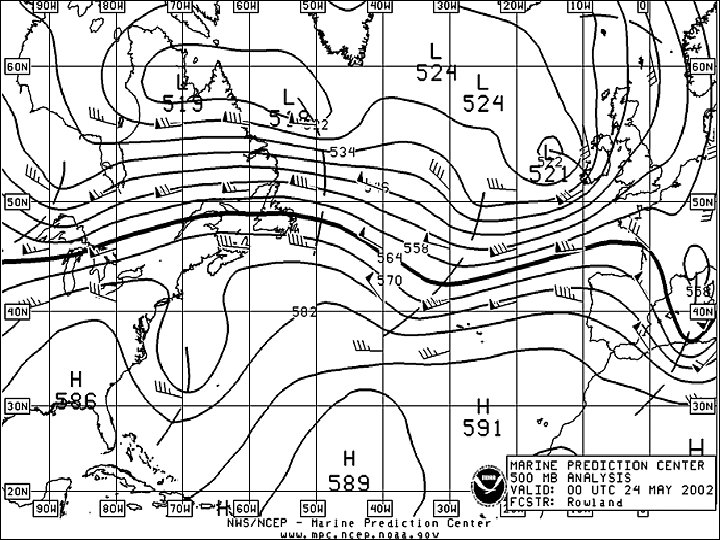
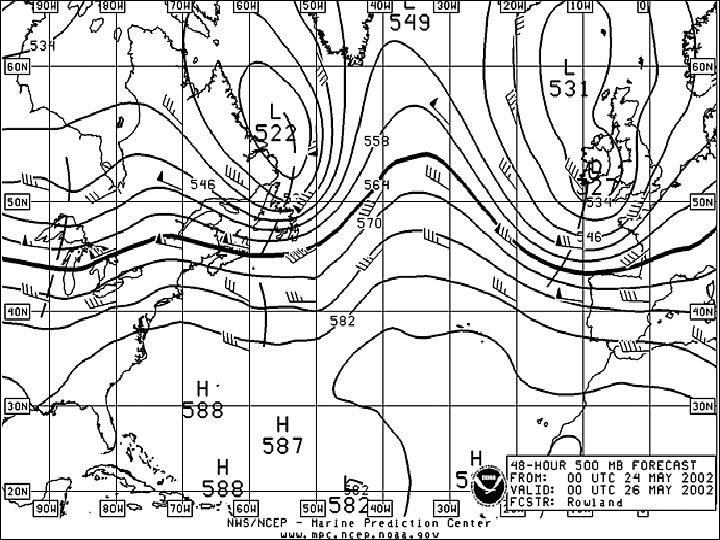
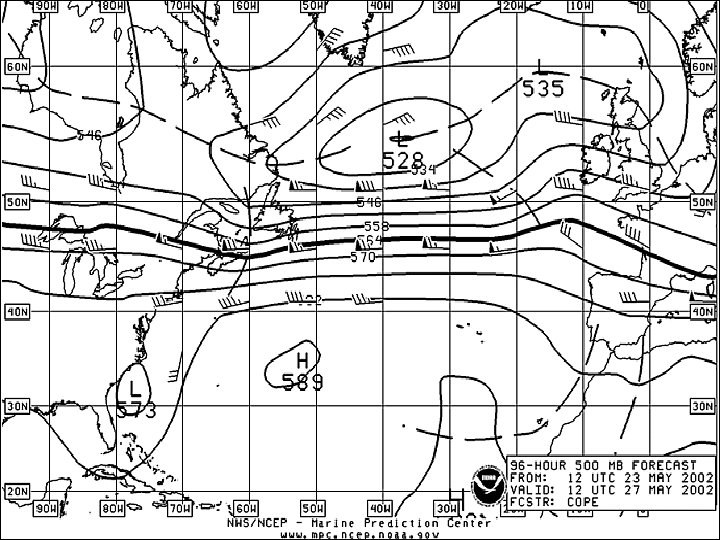
500 MB CHART The 500 -mb chart analysis and 48 Hr forecast are produced twice a day at 0000 Z and 1200 Z. A 96 Hr forecast chart is produced once a day at 1200 Z. These charts depict: 1. Height contours (geopotential heights) at 60 meter intervals. 2. Wind speeds of 30 knots and greater. 3. Embedded short wave troughs, drawn as bold dashed lines. v Short wave troughs help in locating surface low pressure systems or developing lows on frontal waves. 4. The 500 -mb winds can be used to approximate the speed of motion of surface extra-tropical lows. v About 1/3 to 1/2 of the 500 -mb wind speed) and surface wind force (approximately 50 percent). 5. The 5640 meter height contour is highlighted. v This height contour is used for general surface storm track direction and the southern extent of Beaufort Force 7 (28 -33 knot) or greater surface winds in the winter, and Force 6 (22 -27 knot) winds in summer.
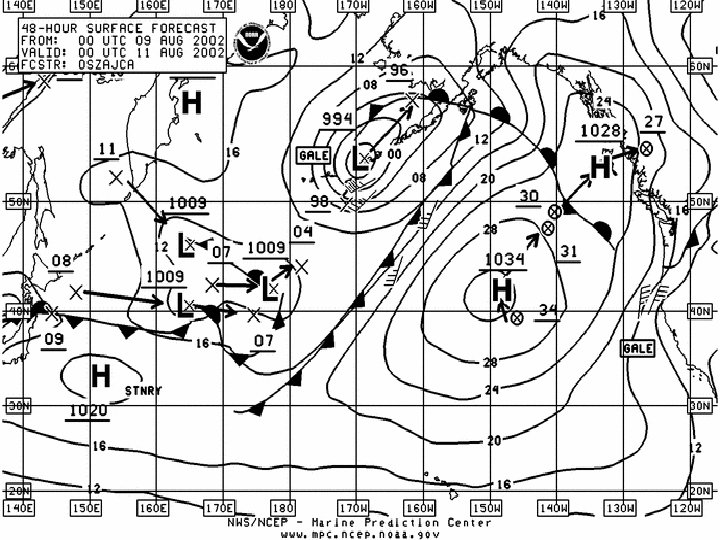
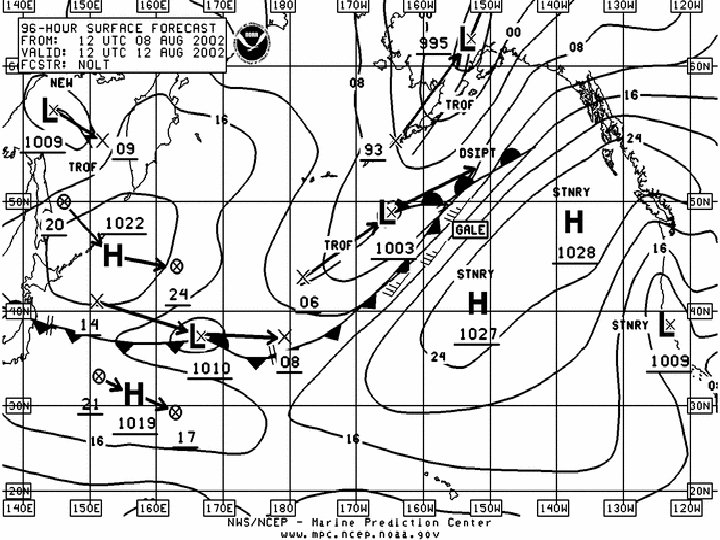
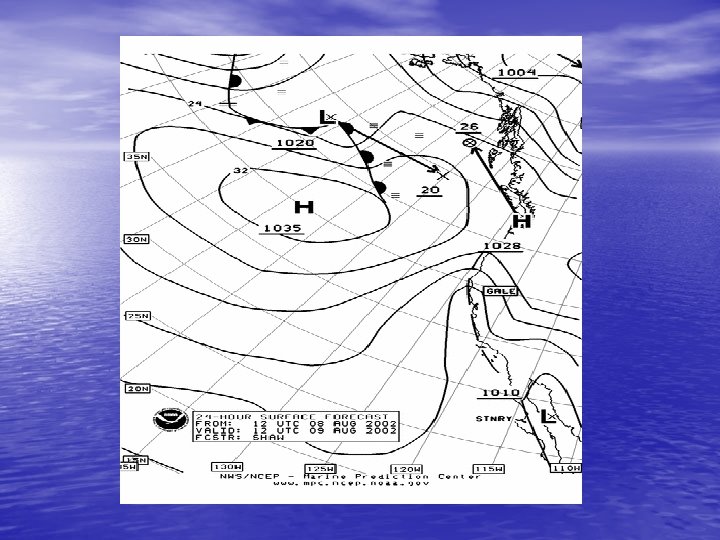
SURFACE CHARTS These products include four surface analyses per day at 00 Z, 06 Z, 12 Z and 18 z, transmitted in two parts covering the Atlantic and Pacific ocean areas. Two 48 Hr Surface Forecasts are produced at 00 Z and 12 Z, and one 96 Hr Forecast at 12 Z. The surface analysis depicts isobars, surface winds, frontal systems, low and high pressure center positions, and central pressure. On the 48 Hr forecast chart, the 24 Hr track history and 24 Hr forecast position of each synoptic scale system's position and central pressure are displayed. The 96 Hr chart shows the 48 Hr track history and 48 Hr forecast position. Systems having or expected to have synoptic scale "Gale" or "Storm" conditions are labeled in bold capital letters. Similarly systems expected to develop "Gale" or "Storm" conditions in 36 Hr have labels of "Developing Gale" or "Developing Storm". Surface low pressure falls of 24 mb or greater during a 24 Hr period are denoted in large capital letters as "RAPIDLY INTENSIFYING".
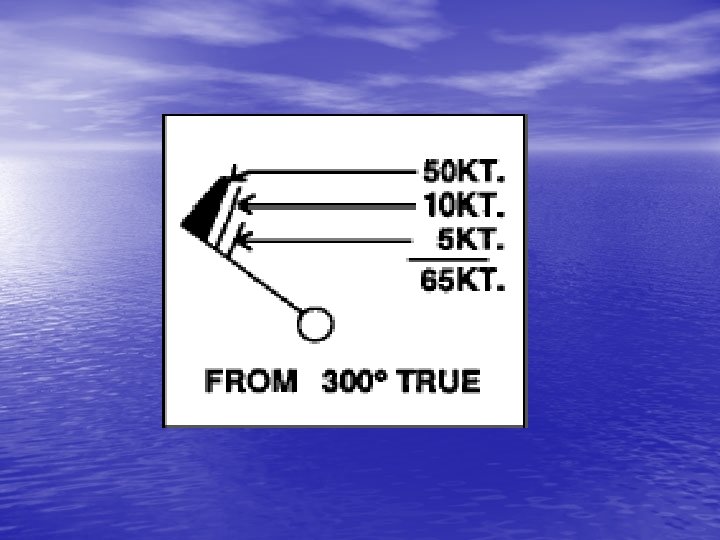
SURFACE CHARTS For tropical cyclones, the appropriate cyclone symbol shows the analysis position along with the following information: TYPHOON or HURRICANE or TROPICAL STORM "NAME" LATITUDE _____ LONGITUDE _____ MAX WINDS _____ KT G (GUST) _____KT MOV DIR _____ (DEGREES) AT _____KT A 24 Hr tropical cyclone symbol forecast position will be depicted on all surface analyses. Both 24 Hr and 72 Hr tropical cyclone positions will appear on the 48 Hr surface forecasts charts. Surface forecasts are derived by comparing several U. S. and foreign Meteorological agencies forecast models. As a result of the blending of these different models, the surface forecasts may not exactly coincide with the corresponding automated 500 mb forecasts.
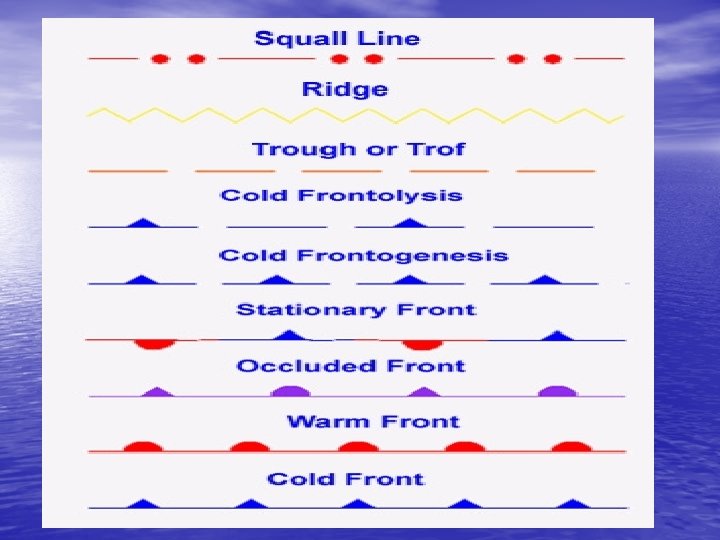
Standard Abbreviations DSIPT STATIONARY WKNG RAPIDLY FRMG INLD COMB INCRS Q-STNRY PSSBL - DISSIPATE STNRY - WEAKENING RPDLY - FORMING INLAND COMBINED INCREASE QUASI-STNRY POSSIBLE MOVG DVLPG DCRS INTSFY TRPCL - MOVING DEVELOPING DECREASE INTENSIFY TROPICAL
Part 2 Part 1
Part 1 Part 2
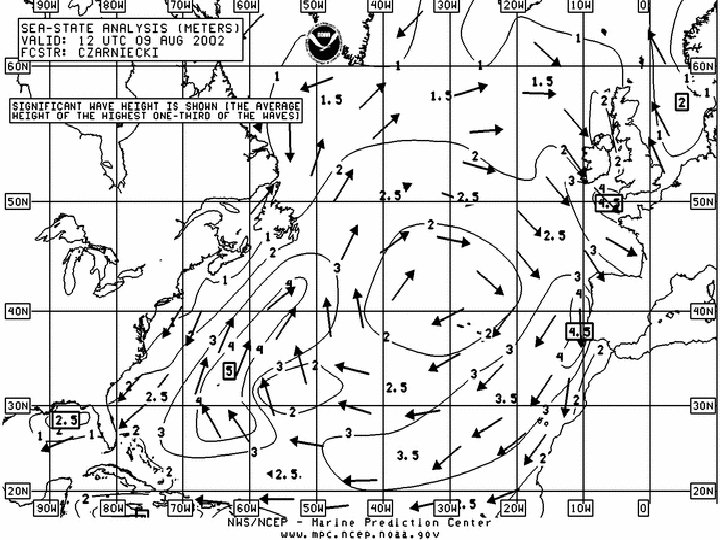
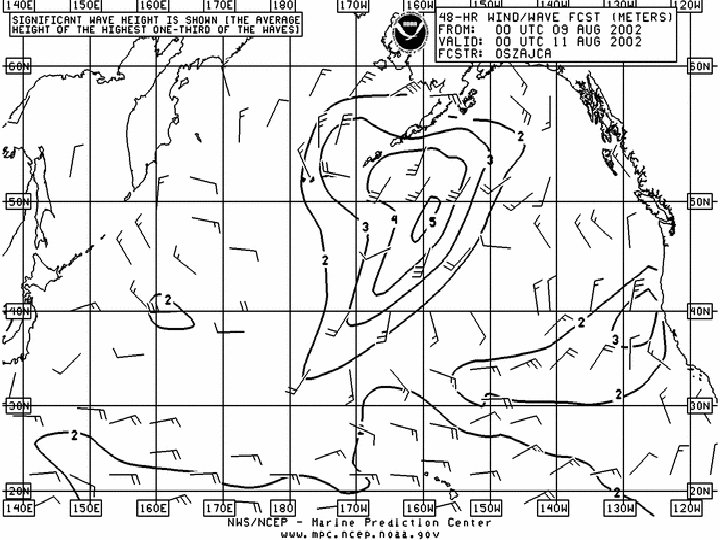
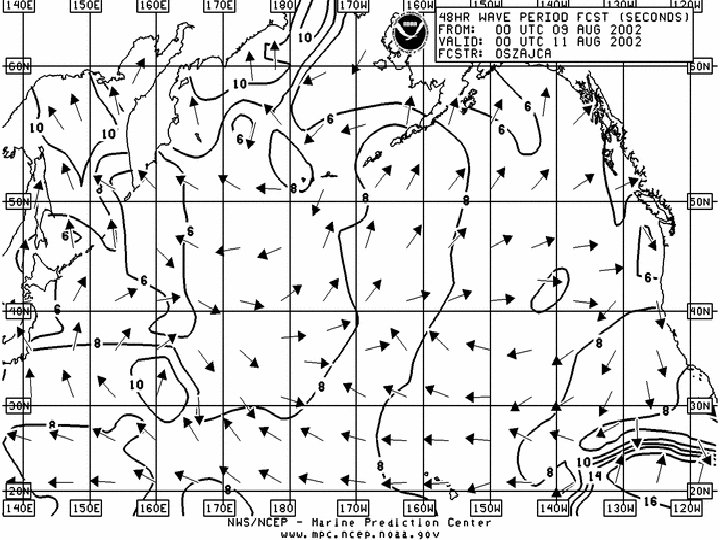
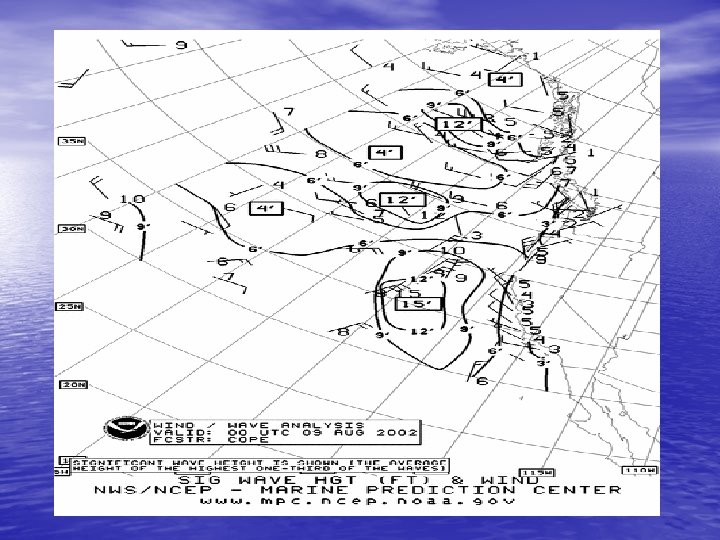
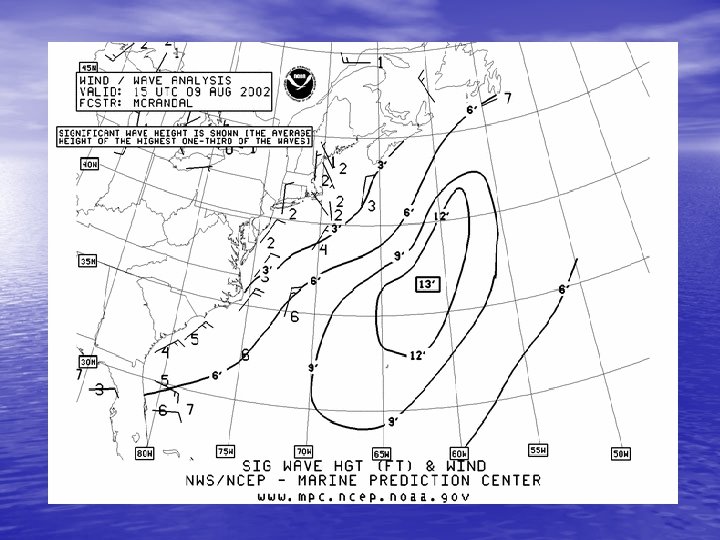
SEAS STATE CHARTS One of the greatest hazards to a vessel's safety and sea keeping capability is having to maneuver around and through changeable sea state conditions. OPC issues two sea state analysis for both the Atlantic and Pacific oceans on a daily basis based on the 00 Z and 12 Z model runs, and two 48 Hr Wind/Wave Forecasts and one 96 Hr Wind/Wave Forecast. In addition two 48 Hr Period Forecasts and one 96 Hr Period Forecast are prepared each day. During the winter cold season, the ice edge is depicted as a bold jagged line. The contours for these products is in one meter intervals with a relative maximum and minimum combined wave height values centrally displayed and inside a box. Forecast of wind speeds are also depicted.
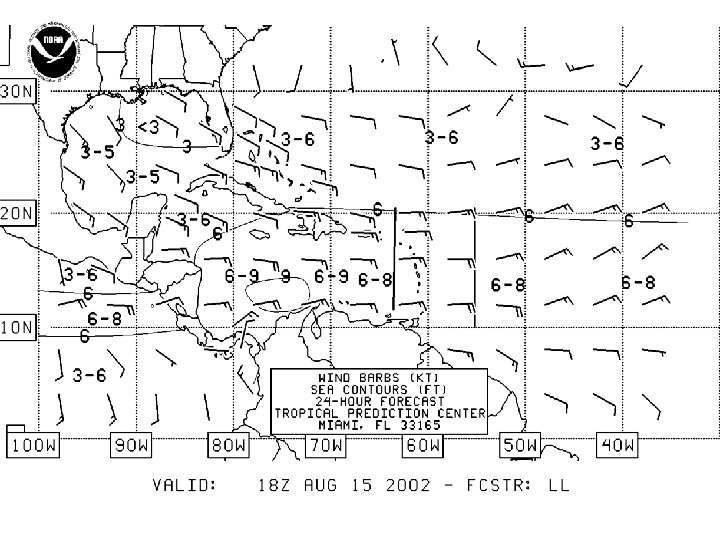
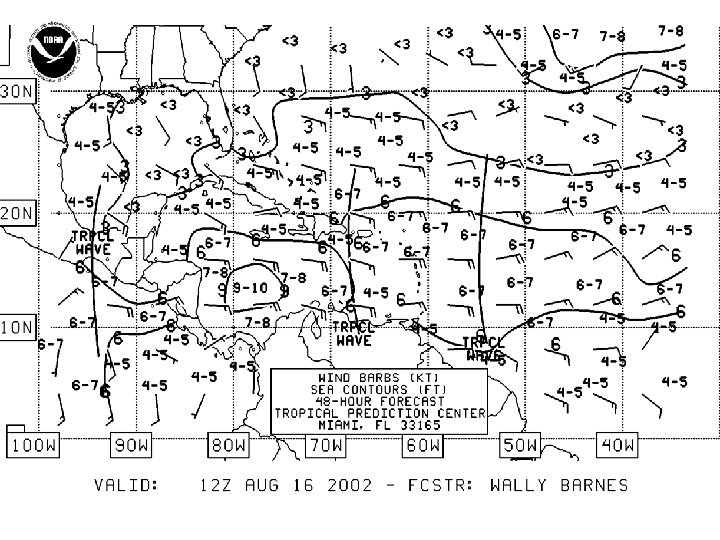
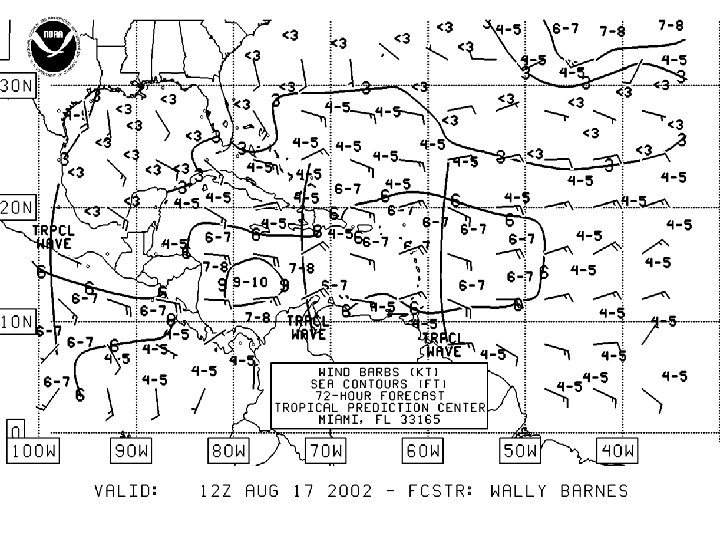
TROPICAL PREDICTION CENTER Tropical Prediction Center (Hurricane Center) is responsible for the Atlantic tropical region including the Gulf of Mexico and Southeastern Pacific. TPC issues a combined wind and sea state analysis, 24 Hr, 48 Hr and 72 Hr Forecasts twice per day. Also wave period and sea state products are produced. TPC products are slightly different than OPC products. This is primarily due to the high volume of recreational crafts in the tropics. - Sea heights are in feet vice meters. - Tropical cyclones are depicted
Regional Products Regional surface graphic products target coastal, offshore and high-seas users for the high traffic areas within a 110 miles of the U. S. east and west coasts. Products consist of the 00 Z and 12 Z sea state analysis and 24 Hr forecasts of the surface and wind/wave. The sea state analysis shows ship observations with observed winds (knot) and sea state in feet. The short range forecast products depict synoptic and mesoscale features of surface low and high pressure systems and isobars with frontal features, areas of reduced visibility, wind speeds, and significant wave height as generated by the synoptic and mesoscale weather systems.
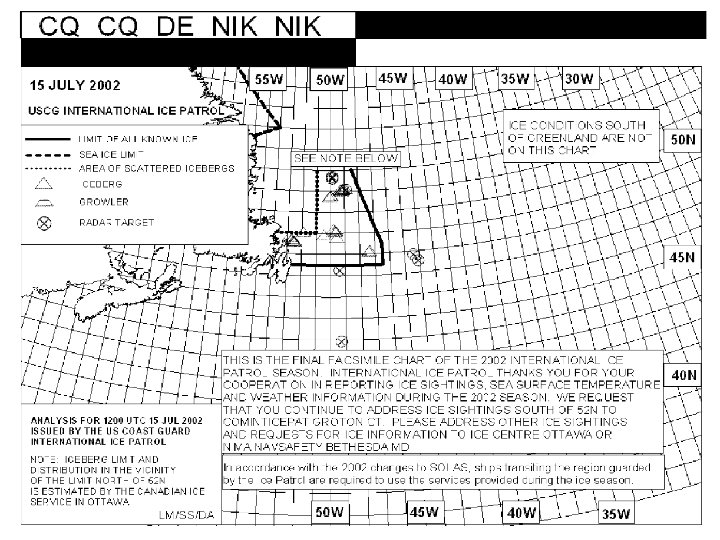
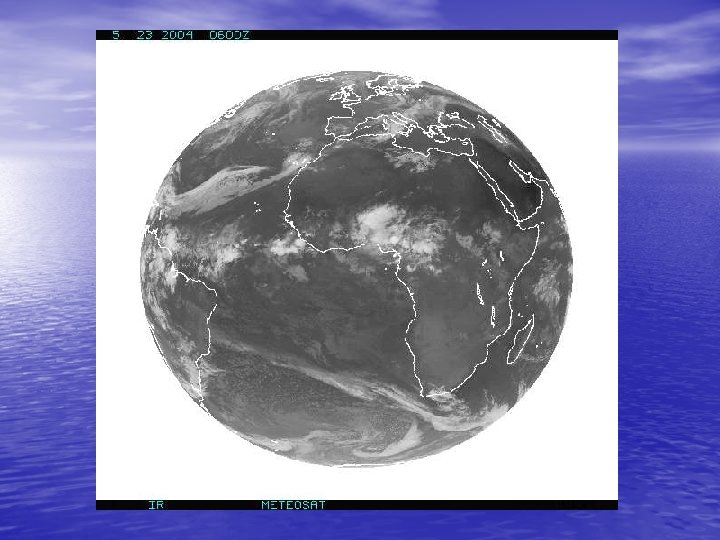
Other Weather Products Sea Surface Temperature (SST) Tropical Cyclone Danger Area Ice Edge and sighted Ice Berg locations Satellite Imagery
Satellite Imagery
Foreign Meteorological Broadcasts
Low pressure with a number such as 99 means 999 mb and with 03 means 1003 mb. High pressure with a number such as 25 means 1025 mb.