Predicting Tropical Cyclone Track Forecast Error Joint Hurricane


 76%")


 76%")


 73%")
 74%")
 73%")
 73%")
- Slides: 37
Predicting Tropical Cyclone Track Forecast Error Joint Hurricane Testbed Project James S. Goerss NRL Monterey
Consensus Forecast Properties Consensus TC track forecast error is dependent upon two things (Goerss 2000): 1) The TC track forecast error of the individual NWP models that make up the consensus 2) The degree of independence (or effective degrees of freedom) of the TC track forecast errors of the individual NWP models that make up the consensus
Consensus Forecast Models • The interpolated versions of five high-quality TC track forecast models available to NHC were used in this study. The five models are: NOGAPS and GFDN (NGPI and GFNI; FNMOC), GFS and GFDL (AVNI and GFDI; NCEP), and the UKMO global model (UKMI). • GUNA is a consensus model computed when the track forecasts from all four models (GFDI, AVNI, NGPI, and UKMI) are available • CONU is a consensus model computed when track forecasts from at least two of the five models (GFDI, AVNI, NGPI, UKMI, and GFNI) are available
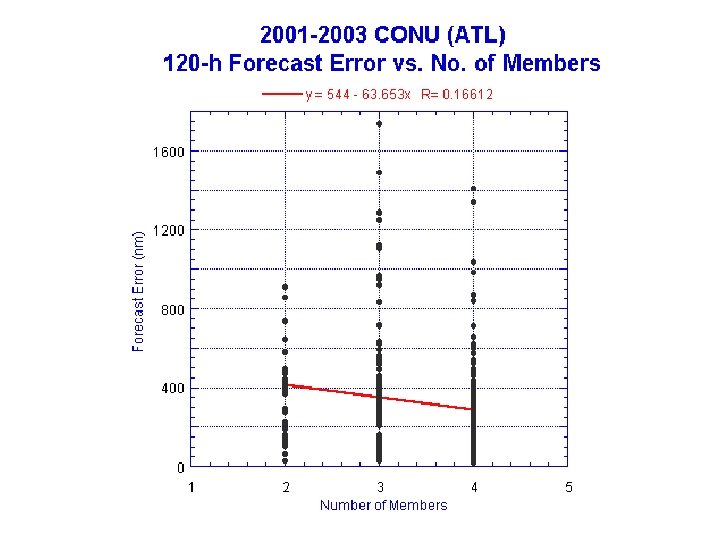
The only models available out to 120 h are NOGAPS, the NCEP global forecast system, and the UK Met 2001 -2003 Atlantic GUNA Ensemble Office global model. Thus, they are the only models available to CONU at 96 h and. TC 120 h. Forecast Still, the CONU Error (nm) 120 h forecast error is comparable to typical 72 h forecast error in the western North Pacific in the 1990’s. 619 467 358 229 176 Number of Forecasts
The only models available out to 120 h are NOGAPS, the NCEP global forecast system, and the UK Met 2001 -2003 Atlantic TC Forecast Error Office global model. Thus, they are the only models available to CONU at 96 h and 120 h. Still, the CONU Homogeneous Comparison 120 h forecast error is comparable to typical 72 h forecast error in the western North Pacific in the 1990’s. 621 469 360 231 176 (nm) Number of Forecasts
The only models available out to 120 h are NOGAPS, the NCEP global forecast system, and the UK Met 2001 -2003 Atlantic Office global model. Thus, they are the only models available to CONU at 96 h and 120 h. Still, the CONU Percentage Forecast Availability 120 h forecast error is comparable to typical 72 h forecast error in the western North Pacific in the 1990’s.
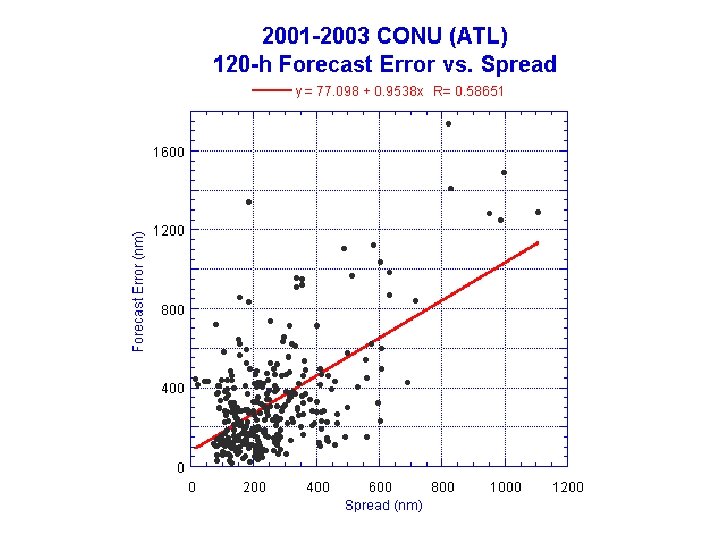
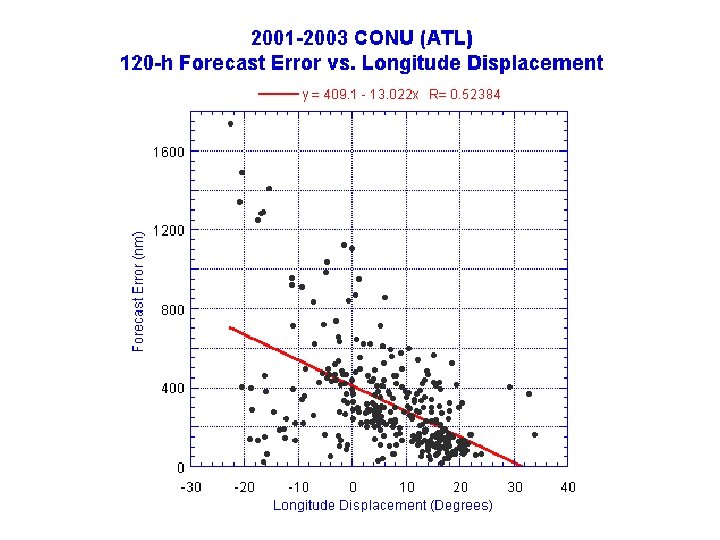
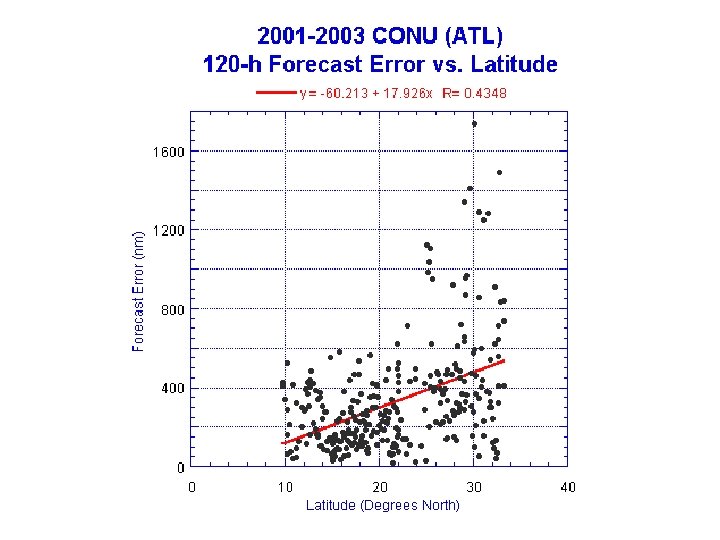
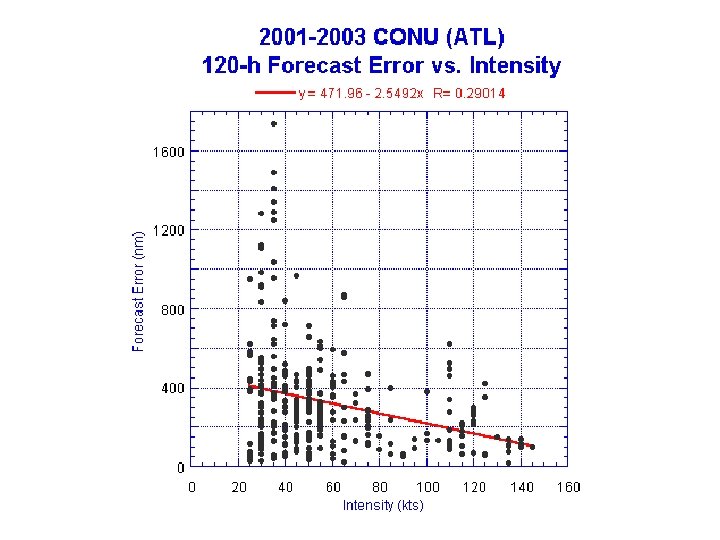
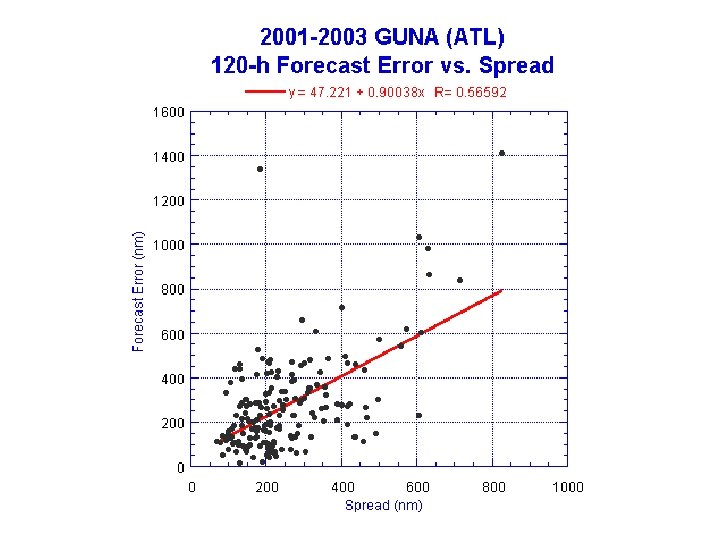
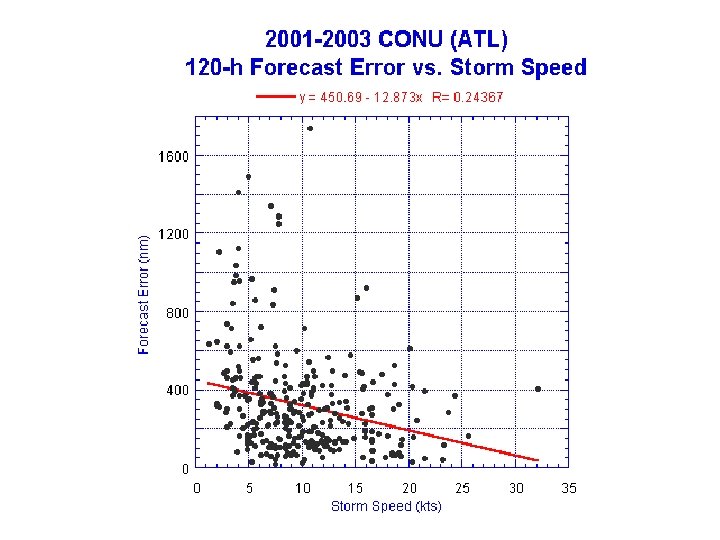
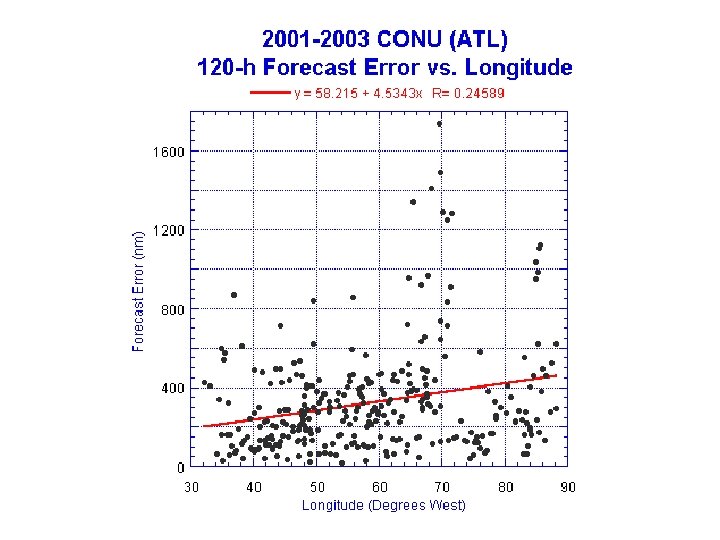
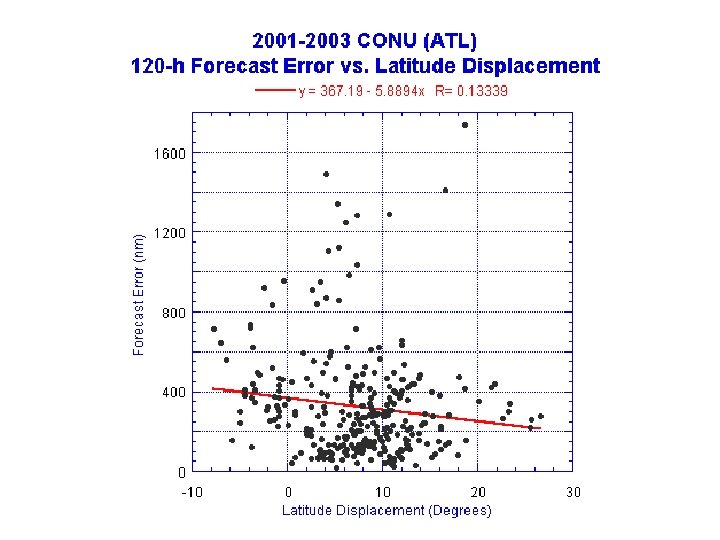
Predicting TC Track Forecast Error • The purpose of this study is to determine to what extent the TC track forecast error of the consensus models GUNA and CONU can be predicted prior to the time when official forecasts must be issued. • Predictors of consensus forecast error must be quantities that are available prior to the time when official forecasts must be issued. • Consensus model spread is defined to be the average distance of the member forecasts from the consensus forecast. • The possible predictors examined in this study are consensus model spread; initial and forecast TC intensity; initial and forecast displacement of TC location (latitude and longitude); TC speed of motion; and number of members available (for CONU).
Spread, Lati, Inti, Lond, Loni, Latd, Speed (R=. 717) 76%
Hurricane Isabel – 00 Z September 13, 2003 Predicted CONU 76% Confidence Radius
Hurricane Kate – 00 Z September 30, 2003 Predicted CONU 76% Confidence Radius
Fit to Independent Data
Spread, Lati, Inti, Lond, Loni, Latd, Speed (R=. 717) 76%
71%
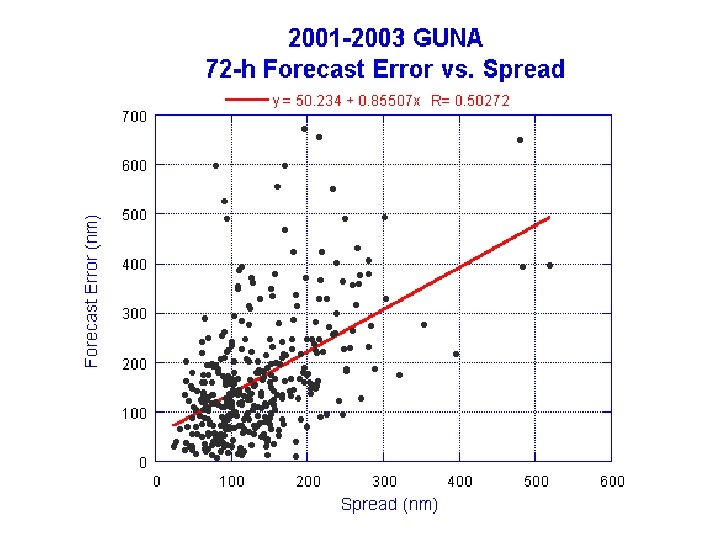
Summary • While the TC track forecast errors for the consensus model, CONU, are comparable to those for GUNA, the forecast availability for CONU is superior to that for GUNA. • At all forecast lengths, the consensus model spread was found to be related to consensus model TC track forecast error. The strongest correlation was found for 96 -h and 120 -h forecasts. TC intensity was found to be consistently but less strongly related to track error. • Using stepwise linear regression and a pool of predictors consisting of spread, initial and forecast intensity, initial and forecast displacement of position (latitude and longitude), speed of motion, and number of members, the percent variance of CONU TC track forecast error explained for the 2001 -2003 Atlantic seasons ranged from just under 20% at 24 h and 48 h to roughly 50% at 96 h and 120 h. Similar results were found for GUNA.
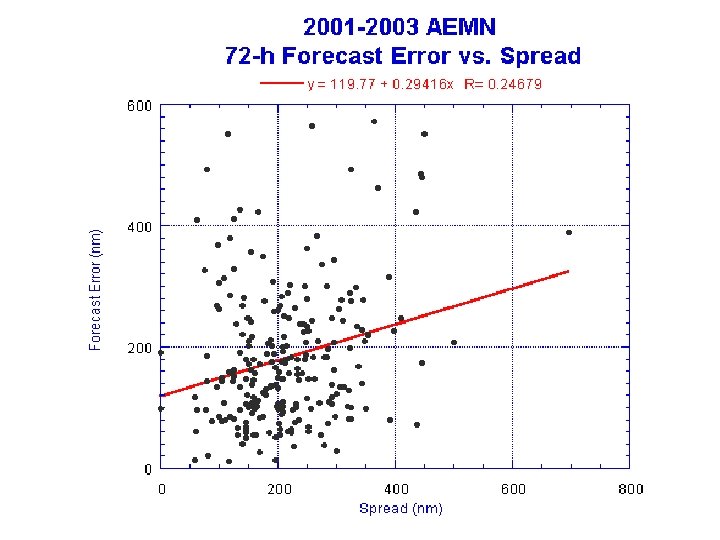
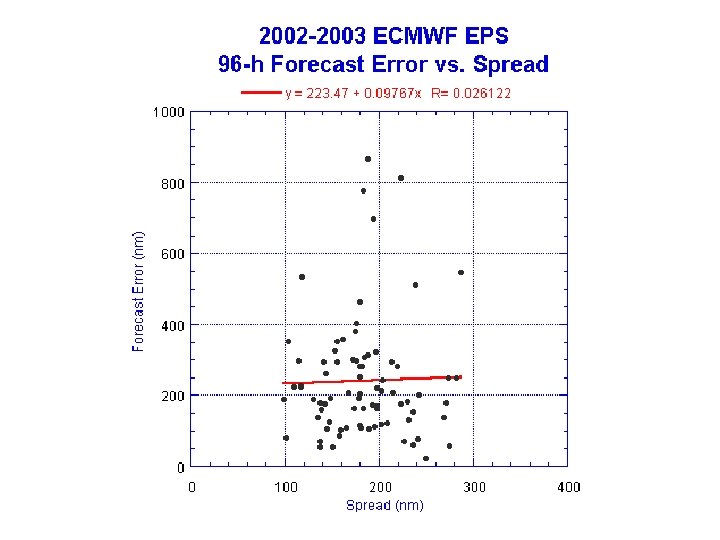
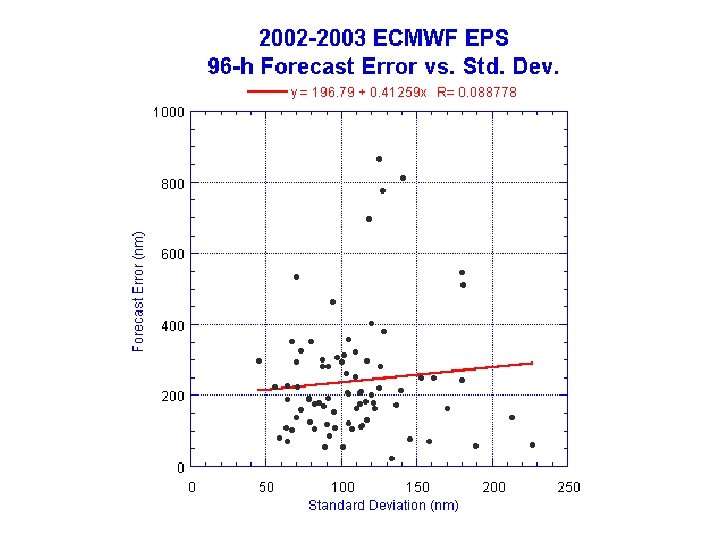
Summary • The range of predicted uncertainty for CONU forecasts containing the verifying TC position 73 -76% of the time varied from 15 -140 nm at 24 h, 30 -250 nm at 48 h, 50 -580 nm at 72 h, 60 -1060 nm at 96 h, and 100 -1200 nm at 120 h. (NHC Potential Day 1 -5 Track Area graphic uses 81, 150, 225, 282, and 374 nm, respectively) • Independent data testing indicated that one can expect only a small degradation in this predictive capability in practice. • The relationship between ensemble spread and the TC forecast track error was found to be weak for both the NCEP GFS and ECMWF ensemble prediction systems.
Questions?
Why use a “poor man’s ensemble” when you have the NCEP GFS or ECMWF ensemble prediction systems available?
The only models available out to 120 h are NOGAPS, the NCEP global forecast system, and the UK Met 2001 -2003 Atlantic GFS Office global model. Thus, they are the only models available to CONU at 96 h and. TC 120 h. Forecast Still, the CONU Error 120 h forecast error is comparable to typical 72 h forecast error in the western North Pacific in the 1990’s. 312 223 Ensemble (nm) 156 Number of Forecasts
The only models available out to 120 h are NOGAPS, the NCEP global forecast system, and the UK Met 2001 -2003 Atlantic GFS Office global model. Thus, they are the only models available to CONU at 96 h and. TC 120 h. Forecast Still, the CONU Error 120 h forecast error is comparable to typical 72 h forecast error in the western North Pacific in the 1990’s. 312 223 Ensemble (nm) 156 Number of Forecasts
The only models available out to 120 h are NOGAPS, 2001 -2003 Atlantic the NCEP global forecast system, and the UK Met Office global model. Thus, they are the only models GUNA and AEMN Ensembles available to CONU at 96 h and 120 h. Still, the CONU Percent Variance of Forecast Error Explained 120 h forecast error is comparable to typical 72 h forecast error in the western North Pacific in the 1990’s. by Spread
Inti, Spread, Speed, Lond, Lati (R=. 438) 73%
Intf, Spread, Lati, Num, Lond, Latd (R=. 433) 74%
Intf, Spread, Latd, Num, Lati (R=. 544) 73%
Spread, Latd, Num, Lond, Inti (R=. 696) 73%