Assessment of Reactive Organic Gases and Amines from


 • Conducted")
 for VOCs, ROG (expressed as methane and")
 • • • Flushed lanes: pre and post-flushed Solids storage")
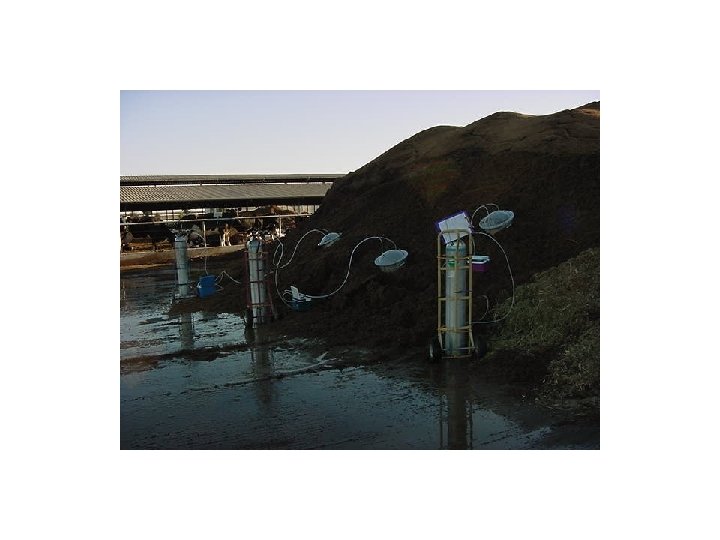
 • • • Barn turnout and corral area* Manure piles")


")

 Lbs/cow/year")


- Slides: 36
Assessment of Reactive Organic Gases and Amines from a Northern California Dairy Using the USEPA Surface Emission Isolation Flux Chamber CE Schmidt, schmidtce@aol. com Tom Card, EMC, trcard@earthlink. net Patrick Gaffney, CARB, pgaffney@arb. ca. gov
Purpose of the Discussion • Present the USEPA flux chamber technology and the application for assessing air emissions from dairies • Describe the ARB/SJV multi-phase research project and the results of the Phase 2 summer testing event (process flux, dairy emissions, pounds/cow/year)
Project Authority • Co-Funded by ARB and SJVUAPCD • Sponsored by the Central CA Ozone Study • Work coordinated with other projects by the San Joaquin Valley Ag Tech Group • Project Management by Patrick Gaffney, ARB • Emission factors supporting SIPs/SB 700
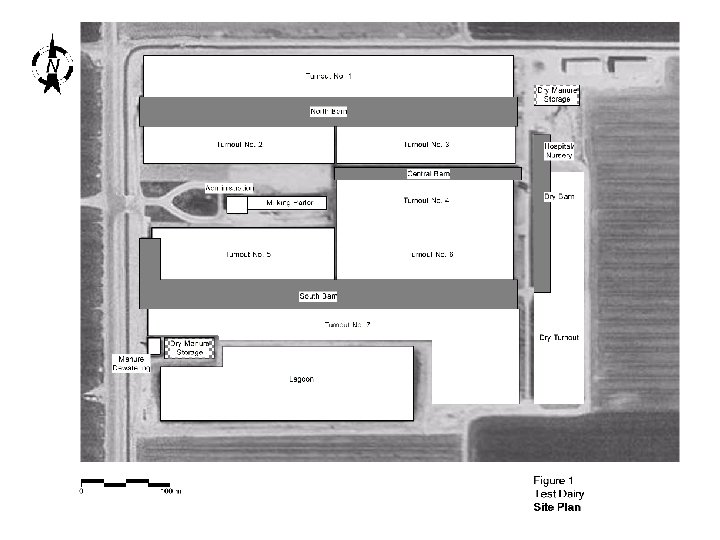
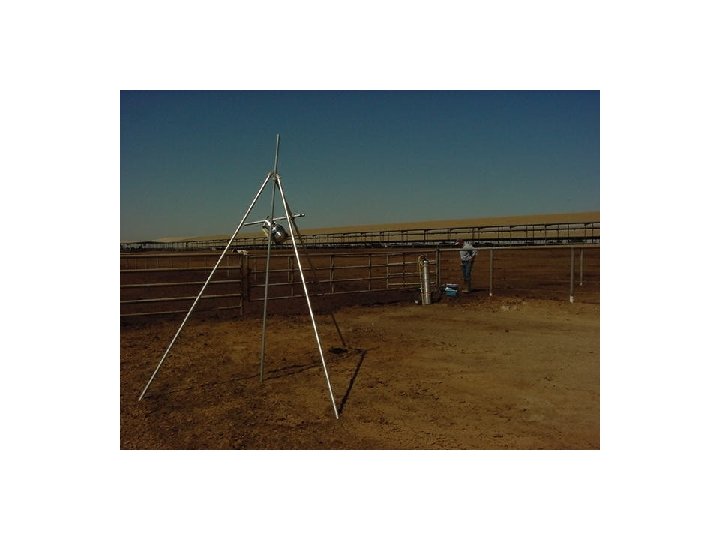
Project Scope of Work • Developed a Site specific QAPP (Phase 1) • Conducted a two-day field test (Phase 2) at the Merced dairy • Over 40 flux chamber measurements were made at 11 types of emitting surfaces at a flushed lane dairy • Analysis included speciated reactive organic gases, ammonia/amines, total organic compounds, and methane • Empirical model developed to estimate emissions
Analytical Menu • USEPA Method TO-15 (GC/MS) for VOCs, ROG (expressed as methane and hexane) • NIOSH 2010 (IC) for ammonia and amines • ASTM 1945 (GC/TCD) for methane • USEPA Method TO-5 (HPLC/UV) for aldehydes/ketones • USEPA Method TO-5 (HPLC/UV) for volatile organic acids
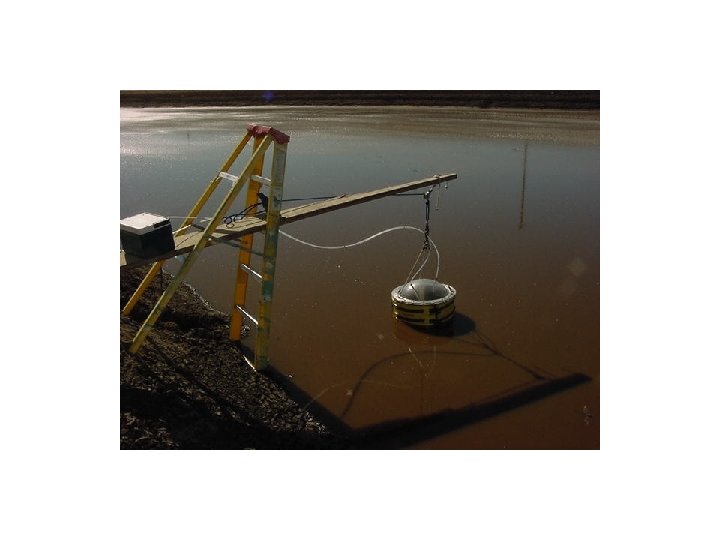
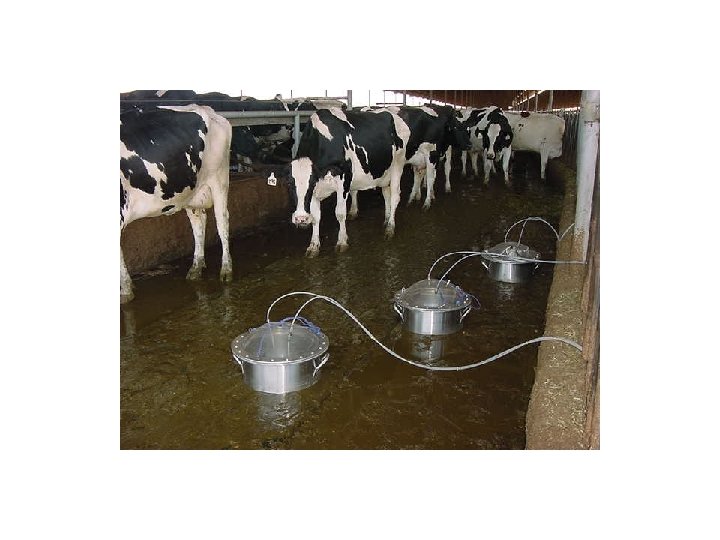
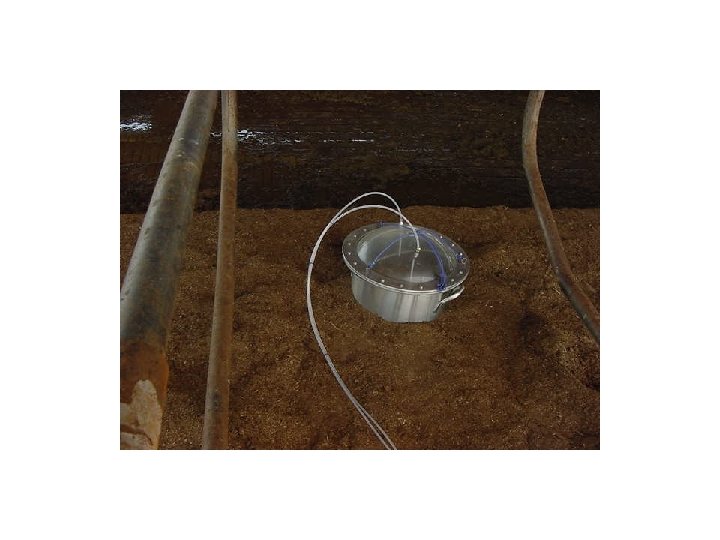
Dairy Unit Processes (sources) • • • Flushed lanes: pre and post-flushed Solids storage piles* Lagoon* (inlet and outlet of lagoon) Solids in Solids separator* Bedding in pile for freestall* Freestall area
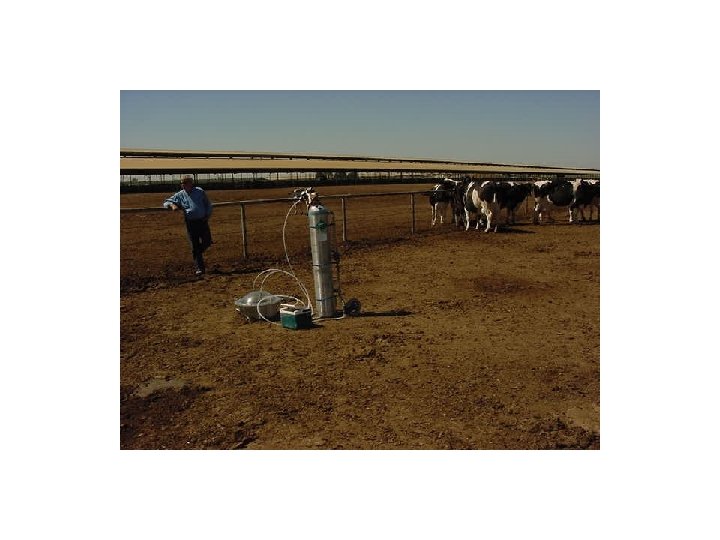
Dairy Unit Processes (continued) • • • Barn turnout and corral area* Manure piles in turnout* Heifer pens (dry cow area)* Open feed storage (in barn feed lanes) Milk parlor (wastewater effluent stream)* Note- Process in sun* tested for diurnal emissions
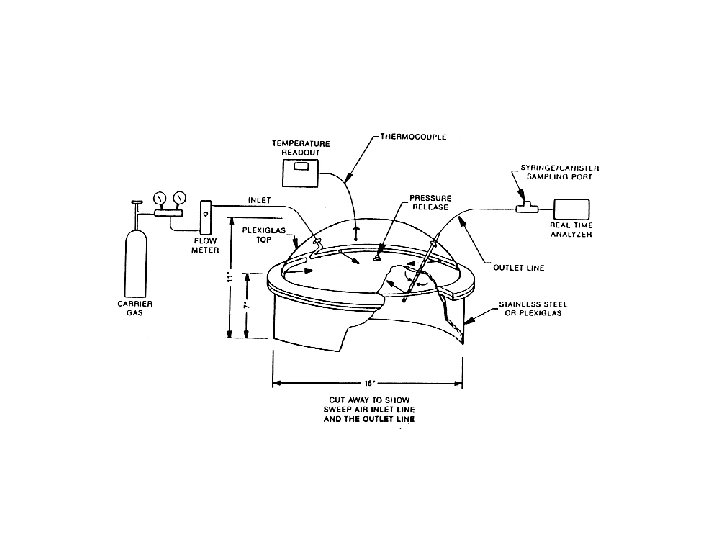
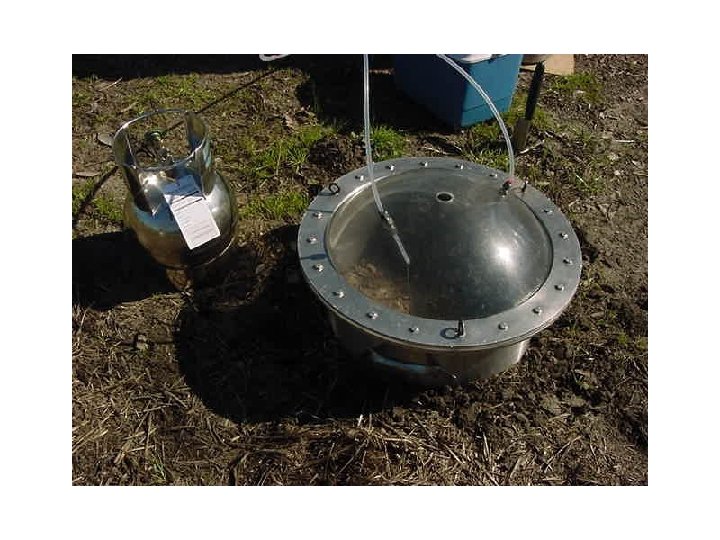
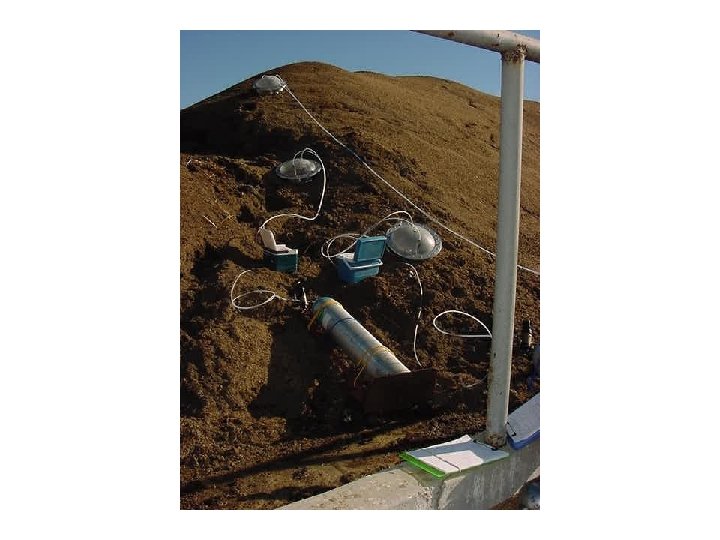
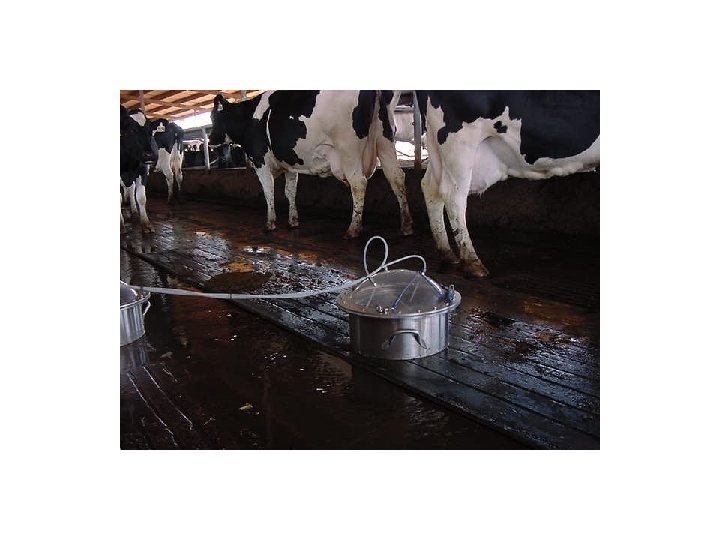
What’s A Flux Chamber? • A flux chamber is a device used for measuring the flux of gas species from an area source • There a variety of ‘flux chambers’, static and dynamic • USEPA Recommended Technology, mixed tank reactor operated at atmospheric pressure
Four Groups of Area Source Assessment Technologies • • Direct Measurement Indirect Measurement Predictive Modeling Fence line Measurement and Dispersion Modeling
Direct Measurement Technologies • Flux or emissions are measured, not determined by modeling • Screening-level: soil gas, static headspace sample, static headspace chamber • In-Depth Level: flux chamber, wind tunnel
So Why Use The Flux Chamber Technology Over the Others? • Assessment does not involve predictive modeling • All parameters of the measurement technology are controlled an estimate of accuracy/precision is made per application • Most cost-effective assessment technology • Can differentiate between sources of emissions at a complex-source facility
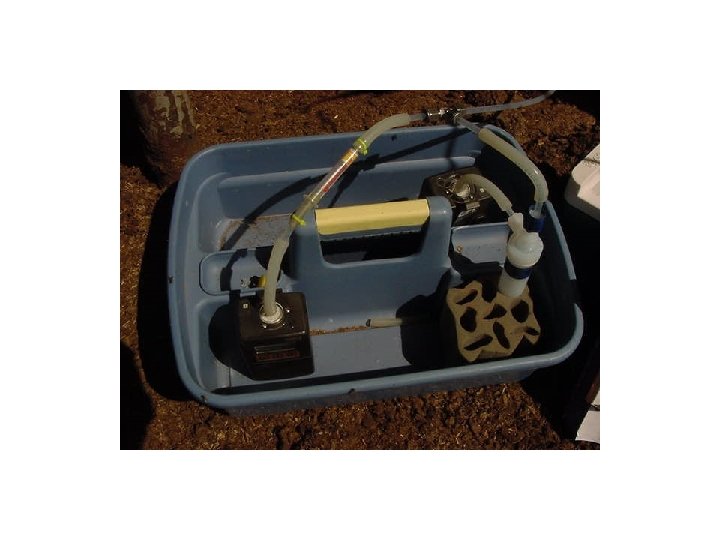
Theory of Operation • • • Mixed tank reactor- CSTR Clean sweep air is added to the chamber Chamber is operated for 5 residence times Chamber contents come to equilibrium Gas sample is collected for study compounds (grab or integrated sample collection) • Flux is calculated knowing sweep air flow rate, surface area, and concentration
Goal of the Assessment Using the Flux Chamber • Measure the compound (or odor) flux from the area source without disturbing the flux and without predictive modeling • Provide a data set that represents the area source emissions (flux times surface area is emissions in mass/time) • Report the range, average, and maximum compound flux as a function of the area source (i. e. , spatial, process, chemical/physical source changes as a function of time)
Advantages of Using the Direct Measurement/Flux Chamber • Only EPA recommended in-depth assessment technology applicable for most area sources • Known accuracy and precision • Very low sensitivity using appropriate sample collection and analysis • Spatially specific technology; defines unique emission sources • Can differentiate the sources of ubiquitous compounds • Provides the preferred input for dispersion assessment and compliance reporting
Dairy Emissions- Phase 2 Summer Emissions Compounds Sorted by Compound Mass Component (Continued) Lbs/cow/year Ammonia 245 Ethylamine 0. 90 Component Lbs/cow/year 1, 2 -Dibromo-3 chloropropane 0. 076 Naphthalene 0. 061 Methane 283 Carbon disulfide 0. 056 TNMHC as Hexane 3. 6 Acetaldehyde 0. 049 TNMHC as Methane 19. 4 Vinyl acetate 0. 038 2 -propanol 0. 033 Ethanol 1. 338 1, 4 Dioxane 0. 032 2 -Butanone 0. 288 t-1, 4 -Dichloro-2 -butene 0. 031 Acetone 0. 277 m & p-Xylene 0. 030 Acetone 0. 225 Isobutyl alcohol 0. 024 1, 2, 4 -Trichlorobenzene 0. 169 1, 2 -Dichlorobenzene 0. 024 Cyclohexane 0. 132 Toluene 0. 023
Preliminary Phase 2 ROG Results • Schmidt: 3. 6 lbs to 19 lbs ROG/cow/year based on flux chamber measurement • Current Emission Factors: 12. 8 lbs ROG/cow/head base on 1938 chamber study • Region 9 EPA: 5. 2 lbs ROG/cow/year based on flux chamber measurement
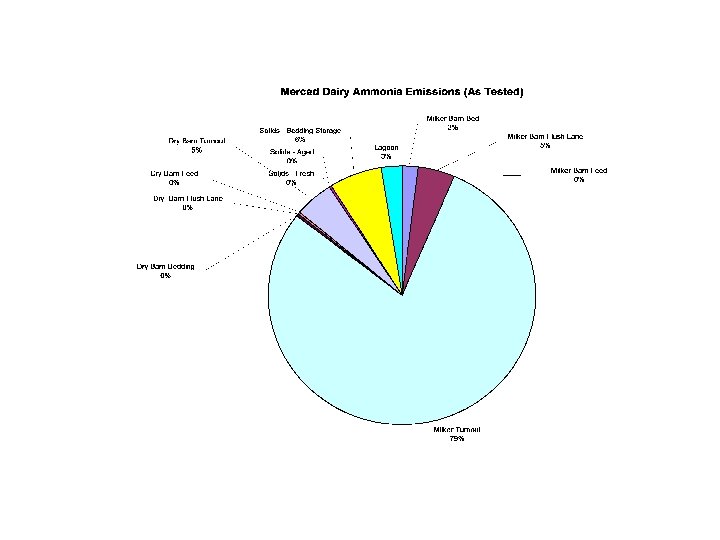
Preliminary Phase 2 NH 3 Results • Schmidt: 245 lbs NH 3/cow/year based on summer flux chamber measurement at one dairy • SCAQMD: 18 lbs NH 3/cow/year based on winter/summer flux chamber measurement at two dairies (dry lot dairies)
Literature Dairy NH 3 EFs Low High Source Lb/cow/yr NOAA 1999 50. 38 Pinder et al 28. 82 122. 1 Sutton et al 1995 48 72 Corsi 2000 43 101 USEPA 2001 51 USEPA 2002 55 EEA 2001 54. 2 Groot Koerkup 1998 Dutch Ag 9. 1 26. 8 9. 5 24. 2 Pedersen et al 2004 15. 3 Max is 122 lb/cow/yr; Min is 9. 1 lb/cow/yr Average is 46, st. dev. 34
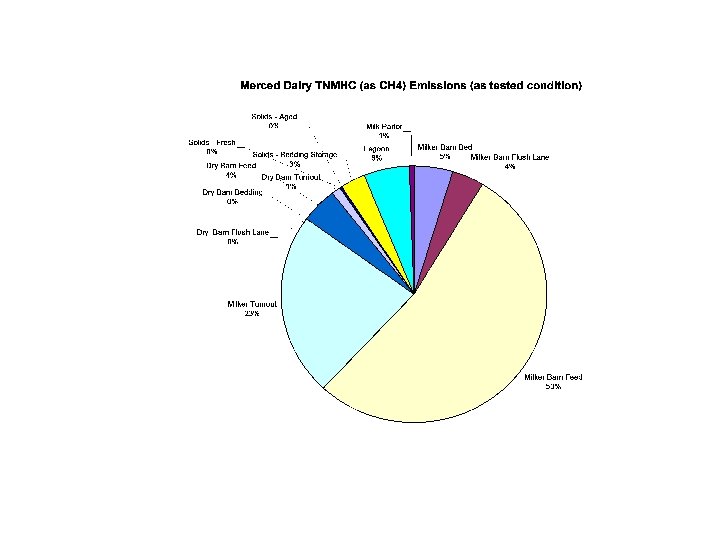
Gross Conclusions • Barn feed source dominates ROG process emissions • The dominate ROG species is ethanol • Ammonia is the dominate amine • Freshly scraped turnouts dominate ammonia emissions • ROG and ammonia emissions relatively low from the wastewater lagoon
Summary • Process specific flux and emission estimates for a representative Northern California dairy were generated for total and speciated ROG speciated emissions • Facility-wide emissions were calculated • Estimate of ROG (total), ROG species, and amine species per cow emission factors were generated
Future Research • Phase 3 research may include: – Option A: More testing at the same dairy to evaluate seasonal emissions at significant sources (winter season) – Option B: Testing at a different dairy to evaluate dairy-to-dairy variability – Approach Modifications: lab method for VOAs, diurnal testing, focus on major sources, operations and facility utilization consideration