Anthropometry A H Mehrparvar Occupational Medicine Department Yazd


 (XK, YK) (XA, YA) (XT, YT) (Xheel, Yheel) X")
,")


 n p Model segments")


 n n n p Clauser et al. (1969)")
 Cadavers (#, gender) Age (y) Body Mass (kg) Stature (m)")

 Board n n Measure and weigh board")


 n n n")
 2. Complex statistical")

 dissected 8 male cadavers ranging in age from")
 based his equations on the data from the")


 was one of the first to develop such")


: p n n p Beam (e. g.")
 used MRI to determine the inertial parameters")


- Slides: 90
Anthropometry A. H. Mehrparvar Occupational Medicine Department Yazd University of Medical Sciences
Definitions p Anthropology: The science of human beings p Physical anthropology: The study of physical characteristics of human beings p Antropometry: A branch of physical anthropology dealing with body dimensions and measurements.
Introduction the science that deals with the measurement of size, mass, shape, and inertial properties of the human body p the measure of physical human traits to: p n p determine allowable space and equipment size and shape used for the work The results are statistical data describing human size, mass and form.
p Considered Factors: n n n agility and mobility Age Sex body size Strength disabilities
p Engineering anthropometry: n p Application of these data to tools, equipment, workplaces, chairs and other consumer products. The goal: n to provide a workplace that is efficient, safe and comfortable for the worker
Divisions of anthropometry Static anthropometry –body measurement without motion p Dynamic anthropometry -body measurement with motion p Newtonian anthropometry -body segment measures for use in biomechanical analyses p
Static Anthropometric Measurements Static = Fixed or not moving p Between joint centers p Body lengths and contours p Measuring tools: Laser (computer), measuring tape, calipers p
Dynamic Anthropometric Measurements p Dynamic = Functional or with movement n No exact conversions for static to dynamic p n Kromer (1983) offers some rough estimates for converting static to dynamic x e. g. Reduce height (stature, eye, shoulder, hip, etc. ) by 3%. Somatography e. g. A CAD program named SAMMIE p e. g. A virtual reality program named dv/Maniken p n Scale model mock-up
Designing for 90 to 95 percent of anthropometric dimensions. p Designing for the “average person” is a serious error and should be avoided p Designing for the tallest individuals (95 th percentile): leg room under a table p designing for the shortest individuals (5 th percentile): reach capability. p Designing “average person”: Supermarket counters and shopping carts p
Design Principles p Designing for extreme individuals n Design for the maximum population value when a maximum value must accommodate almost everyone. E. g. Doorways, escape apparatus, ladders, etc. p n This value is commonly the 95 th percentile male for the target population. Design for the minimum population value when a minimum value must accommodate almost everyone. E. g. Control panel buttons and the forces to operate them. p This value is commonly the 5 th percentile female for the target population.
Design Principles, continued p Designing for an Adjustable Range n Designing for the 5 th female/95 th male of the target population will accommodate 95% of the population. 95% because of the overlap in female/male body dimensions (if the male/female ratio is 50/50). p Examples are auto seats, stocking hats p p Designing for the Average n Use where adjustability is impractical, e. g. auto steering wheel, supermarket check-out counter, etc. n Where the design is non-critical, e. g. door knob, etc.
Designing for Motion Select the major body joints involved p Adjust your measured body dimensions to real world conditions p n p e. g. relaxed standing/sitting postures, shoes, clothing, hand tool reach, forward bend, etc. Select appropriate motion ranges in the body joints, e. g. knee angle between 60105 degrees, or as a motion envelope. n Avoid twisting, forward bending, prolonged static postures, and holding the arms raised
7 Steps to Apply Anthropometric Data p p p p Identify important dimensions, e. g. hip breadth for a chair seat Identify user population, e. g. children, women, Iran population Determine principles to use (e. g. extremes, average, adjustable) Select the range to accommodate, e. g any%, 90%, 95% Find the relevant data, e. g. from anthropometric data tables. Make modifications, e. g. adult heavy clothing adds ~4 -6 linear inches. Test critical dimensions with a mock-up, user testing, or a virtual model
Variability - three areas p Anthropometric data show considerable variability stemming from the following sources: p Poor data p Interindividual variability p Intraindividual variability
Poor data Variability in measurements arise from: p Population samples p Using measuring instruments p Storing the measured data p Applying statistical treatments p
Intraindividual variability Changes in time p Size and body segment size, change with a person’s age -some dimensions increase while others decrease p
Interindividual variability Individual people differ in: p arm length p stature and weight p therefore population samples are usually collected from cross sectional studies p
Long-term trends p Change in body size by time and in different generations
Areas of anthropometry p Anthropometry can include just general measurements of dimension of body segments n n n p Lengths Circumferences (girths) Breadths (width) depths Body composition In biomechanics, mostly concerned with BSIPs (Body Segment Inertial Parameters) n Segment mass n Center of mass n Moment of inertia
Inertial Parameters p Typical biomechanical analyses require the following: n n n p Segment mass Location of center of mass Moment of inertia These properties of a rigid body are often referred to as Inertial Parameters
Body Segments p Divide the body into defined rigid bodies, for which we know or can determine the inertial properties Many different ways to divide the body p Most common (14 segments): p n n n n Head Trunk Upper arm Forearm Hand Thigh Shank Foot
Body Segment Model
Y “Digitizing” (XH, YH) (XK, YK) (XA, YA) (XT, YT) (Xheel, Yheel) X
Rigid Body Analysis p Rigid Body n p A body made of particles (points), the distances between which are fixed What is the basic assumption? n n The human body segments are rigid links Therefore human body can be modeled as a series of rigid bodies (link segments)
Rigid Body Model The human body is modeled as a linked system of rigid bodies Air Resistance Body Weight (N) = mg Friction VGRF
Free Body Diagram p Diagram of the essential elements of the system n n Segments and Axes of interest Forces acting on the system Effort and resistance forces p Weights of limbs or segments p Line and point of application for each force p n Force Arms (moment arms) p n Perpendicular distance from line of force application to axis of rotation Moment Direction (+/-)
Equilibrium and Static Analysis p System is not moving or acceleration is constant p Static Equilibrium n n p No motion, thus no acceleration So opposing forces are equal Rigid Body Diagram n n n Free Body Diagram Drawing a mechanical picture of the system or object Example: Muscle-Lever Diagram
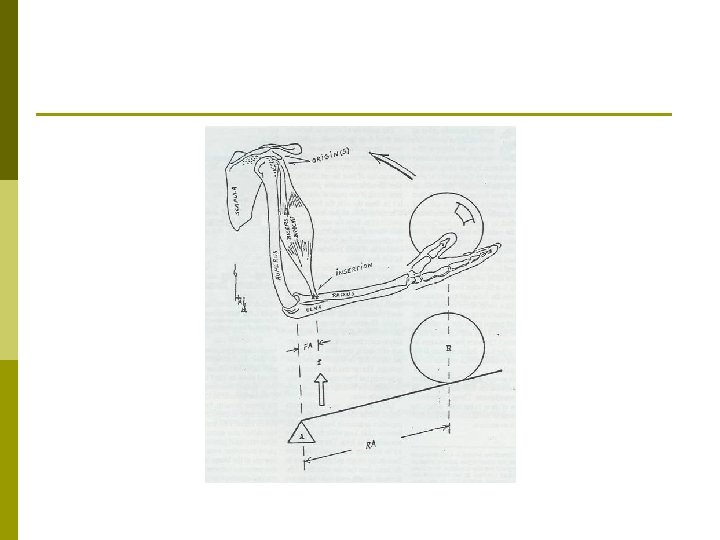
Muscle-Lever Diagram p Muscle Diagram n n n p Bones Muscles Motion Lever Diagram n n Direction Force (direction) Axis Resistance (direction)
Static Analysis p Uses the equations of equilibrium across various postural positions p Allows the determination of: n n Maximum or minimum muscle forces or moments for a given posture or joint position and load Shear or injurious forces across joints in a given positional load or task (e. g. lifting) How body postures affect joint loads Resultant joint moments and forces
Conditions for Equilibrium Sum of all horizontal forces must be zero Fx = 0 Fy = 0 Sum of all vertical forces must be zero Fz = 0 Sum of all moments about the axis (joint) in each plane must be zero M = 0
Free-body Diagram – The System
The Free-body Diagram Illustration of the essential elements of a system Upper Arm Segment Forearm Segment
More Key Terms p Moment of Inertia n The resistance of a body to rotation about a given axis i = np I = Σ m i · r i 2 i=1 n n I – moment of inertia about a given axis np – number of particles making up rigid body mi – mass of particle ri – distance between particle and axis
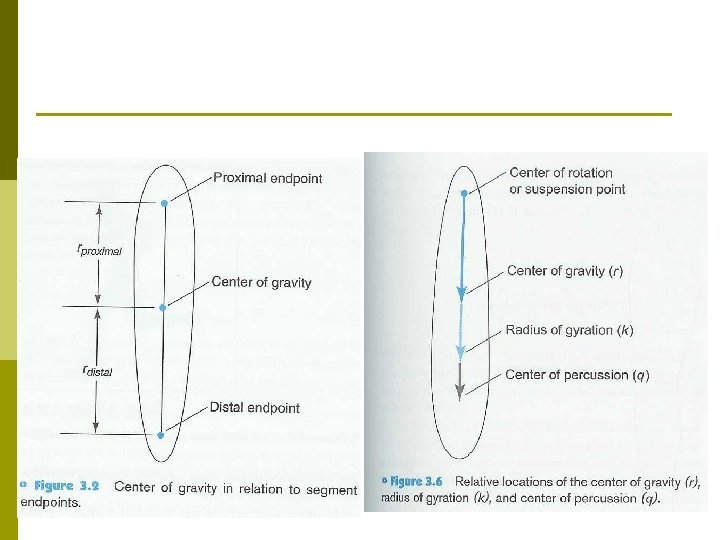
Whole Body Center of Mass p Mass – measure of the amount of matter comprising an object (kg) Center of Mass – location for which mass of a body is evenly distributed p It is the point about which the sum of torques is equal to zero p The point about which objects rotate when in flight p Allows simplification of entire mass particles into a mass acting through a single point p
Center of Mass
Calculation of Segment Mass n m = Σ mi i=1 m is the total mass p mi is the mass of a segment or part p Ex. If we have 3 parts or sections, then p 3 m = Σ mi i=1 = m 1 + m 2 + m 3 p Mass of segment n mi = ρi·Vi (density times volume) n So… n m=ρ Σ Vi (assumes uniform density)
Multi-segment Systems p x 0 = (m 1 x 1 + m 2 x 2 + m 3 x 3) / M p y 0 = (m 1 y 1 + m 2 y 2 + m 3 y 3) / M p (x 0, y 0) is the COM position for the whole
Mass Moment of Inertia p M = I·α n n n M is moment (Nm) α is the angular acceleration I is constant of proportionality (inertia) Resistance to change in angular velocity p Recall: I = m. r 2 (r is the moment arm) p p I = m 1·x 12 + m 2·x 22 + m 3·x 32 I= n n Σ mi·xi 2 A mass closer to the axis – Less effect A mass further from the axis – Greater effect
Segment and WBCOM Relation ♀ ~ 55% BH ♂ ~ 56 -57% BH
Benefits of Understanding COM p Parabolic flight of a projectile n p Running performance n p Vertical oscillation of COM Manipulation of COM for greater impulse n p Jump, aerials, hang time Long jump, leap Mechanical Stability n n n Base of Support (BOS) Low COM - STABILITY High COM - MOBILITY
Stability p Factors that influence stability n Base of Support n Center of Mass Location n Mass
Whole Body Center of Mass p Computation of whole body COM p Where: n n CMWB x or y : Location of whole body COM in x or y plane MWB : Mass of whole body Mi : Mass of ith segment CM xi or yi : Location of COM of ith segment in x or y
Whole Body Center of Mass For analysis…the person is often divided into many parts (each considered a rigid body) p We may want to know the center of mass of the entire system p Need: p n n p Masses of each of the segments Locations of the centers of mass of each segment Whole body center of mass position is equivalent to a weighted mean of all the
Whole Body Moment of Inertia p May have moments of inertia of segments n p Want moment of inertia of the whole body about it’s COM n p Useful when analyzing aerials (flight) What we need: n n p From tables or whatever Masses of the segments Locations of segment COM Location of whole body (system) COM Moments of inertia of each segment about the whole body COM The moments of inertia can be summed once they are all about the same axis
Problem p So…how do we determine inertial parameters of limb segments in a live subject? p Answer: Amputate
Determination of COM Position p So, since we can’t just lop off peoples limbs… p Typically use tables and regression equations from previous studies: n n Dempster, 1955 Clauser et al. , 1969 Chandler et al. , 1975 Vaughan et al. , 1992
Measures p Mostly simple measures do the trick p Some are more complicated if the measures serve as a guide for manmachine interface requiring a person to perform a task n Kinetics and kinematics are typically needed Get an idea of ROM, height requirements etc. p Masses, moments of inertia and their locations p
Locating the COM of a Body Segment In case you can’t get permission to amputate… p Early Methods: p n n n Suspension Segmentation (uses tables of regression equations) Reaction (balance) Board Advantages and disadvantages for each?
Methods of Measurement p Model segments as sticks (1 D) n p Model segments as rectangles (2 D) n p 2 measures (length and breadth) Model segments as geometric solids (3 D) n p 1 measure (length) 2 -3 measures (length and circumference at ends) Model segments as series of geometric solids n More measures (segmented lengths and circumferences)
Suspension p p Cut off limb Sever, Suspend and Swing n n p Advantage: n p Limb is amputated, weighed (mass), and measured Hung and swung, an object will behave as a pendulum The farther away or greater the moment of inertia, the slower the swing… Do this enough times and you create data sets that you can do statistics on and create regression tables Extremely accurate Disadvantage: n n Potentially painful, as you would have to amputate the limb Not to mention the difficulty in getting institutional permission to cut off peoples legs…
Segmentation p Uses regression equations based on various segmentation techniques (e. g. cadaver studies or imaging) n n Use anatomical landmarks to mark segment ends Measure distance up from origin point (e. g. foot sole)
Segmentation p p Could involve amputation, but typically just involves the use of the regression tables Such tables are created from all kinds of previous study and data sources: n Cadaver n Imaging n Modeling Advantages: n Simple, quick and easy n Everyone does it (popular and accepted) Disadvantages: n Not necessarily accurate to individual or groups of different gender (e. g. females), ethnicity (e. g. blacks, Asian), age (e. g. young), or status
Classic Cadaver Studies p Dempster (1955) n n n p Clauser et al. (1969) n n n p 8 male cadavers Age (52 -83 y), Mass (49 -72 kg), Stature (1. 59 -1. 86 m) Segment COM as % segment length or body height Segment mass as % body mass Tissue density 13 male cadavers Age (28 -74 y), Mass (54 -88 kg), Stature (1. 62 -1. 85 m) Segment COM as % segment length or body height Segment mass as % body mass Segmental moments of inertia Chandler et al. (1975) n n 6 male cadavers Age (45 -65), Mass (51 -89 kg), Stature (1. 64 -1. 81 m) Segment COM as % segment length Segment mass as % body mass
Major Cadaver Studies Author(s) Cadavers (#, gender) Age (y) Body Mass (kg) Stature (m) Dempster (1955) 8 male 52 – 83 49 - 72 1. 59 - 1. 86 Clauser et al. (1969) 13 male 28 - 74 54 – 88 1. 62 - 1. 85 Chandler et al. (1975) 6 male 45 - 65 51 - 89 1. 64 - 1. 81 * There are other cadaver studies – but these are the classics
Problems with Using Cadaver Data Storage p Age range p Cause of death p Applicability to live population (especially sports or athletic populations) p Applicability to other genders and ethnic populations p Variation in dissection techniques p
Reaction Board p Scale and Balance (Reaction) Board n n Measure and weigh board (upright) Place board end on pivot (axis) and the other end on the scale (reaction) p n Person lays on board with feet at the axis end and head towards scale p n Get scale reading (reaction force of board) Get new scale reading (reaction force of board and body) Calculate COM of person and board from summing the moments about the axis, with scale reading as a reaction force
p Advantages: n n n p Accurate to your subject Not too complicated calculations Not dependent upon cadaver data for density values Disadvantages: n n Need a few people to do it Equipment required A bit time consuming Can’t get small limb masses or COM’s (scale sensitivity)
Reaction Board - Concept
Mass Moment of Inertia p M = I·α n n n M is moment (Nm) α is the angular acceleration I is moment of inertia (constant of proportionality) Resistance to change in angular velocity p Recall: I = m·r 2 (r is the moment arm) p p I = m 1·x 12 + m 2·x 22 + m 3·x 32 I= n n Σ mi·xi 2 A mass closer to the axis – Less effect A mass further from the axis – Greater effect
Moments and Center of Mass p Moment of Force n Measure of the tendency of a force to cause rotation of an object about an axis M = F · ┴d F ┴d n Recall: ┴d is called the “moment arm” p Perpendicular distance from the axis of rotation to the line of force application
Moments and Center of Mass p Positive Moment n p Negative Moment n p Counterclockwise (CCW) rotation about an axis Clockwise (CW) rotation about an axis Static Equilibrium No rotation about an axis 1. 2. No moments acting on the object Minimum of 2 moments, which summed equal 0 Nm. ΣM=0 ΣF=0
Reaction Board p Based on moments of force in static equilibrium -+ Ms MB Ms + + MB MP
Determination of Whole Body COM 1. 2. Suspension Segmentation (Regression Equations) n n n Imaging techniques (e. g. Zatsiorsky et al. , 1990) Cadaver experiments (e. g. Dempster, 1955) Geometric solid modeling (e. g. Hinrichs, 1985) 3. Reaction Board Technique p Advantages and disadvantages of each
Other BSIP Techniques 1. Simple statistical model (e. g. Dempster, 1955) 2. Complex statistical model (e. g. Hinrichs, 1985) 3. Geometric models (e. g. Hanavan, 1964) 4. Imaging Techniques (e. g. Martin et al. , 1989)
COM Techniques Based on Cadaver Studies p Suspension p n n n p Amputate limbs Weigh Suspend and swing to obtain moment of inertia about all 3 axes. Segmentation n Amputate limbs (or somehow isolate limbs – imaging) Weigh (mass) and submerge in water (volume and density) Balance or hang to determine center of mass
Simple Statistical Model p Dempster (1955) dissected 8 male cadavers ranging in age from 52 to 83 years p Measures: 1. Masses of body segments expressed as % of total body mass p 2. e. g. mass of foot is 1. 45% body mass Location of center of mass expressed as a % of segment length p e. g. com of thigh is located 43. 3% along the length of the thigh from the proximal end
Complex Statistical Model p Hinrichs (1985) based his equations on the data from the 6 male cadavers dissected by Chandler et al. (1975) p Moments of inertia of body segments computed using regression equations containing one or more measurements on segment of interest n e. g. Transverse moment of inertia of shank about com
Geometric Solid Models p To avoid dependence on cadaver data, model segments as series of geometric solids p Although we are still dependent upon cadaver studies for the tissue density
Geometric Solid Models p So a cylinder is a simple shape which can represent the thigh or foot…
Geometric Solid Models p Hanavan (1964) was one of the first to develop such a model n n n Truncated cones (e. g. limbs) Spheres (e. g. hands) Cylinders (e. g. trunk)
Hanavan’s Geometric Model p 15 segments n n n Cones Spheres Cylinders
Geometric Solid Modeling
Geometric Solid Modeling
Imaging Techniques Medical imaging p Basis (theory): p n n p Beam (e. g. radiation) passes through substance (tissue), beam diminishes in relation to the density of the tissue Thus, get shape of the segments and tissues Techniques: n n n Gamma mass scanning (slight dose of radiation) Computer Tomography (CT) Magnetic Resonance Imaging (MRI)
Imaging Techniques p Martin et al. (1989) used MRI to determine the inertial parameters of 8 baboon cadaver arm segments, then compared these values with physical measures. Parameter Mean Difference SD Volume (m 3 or l) Density (kg/volume) Mass (kg) COM (m) 6. 3 0. 0 6. 7 -2. 4 5. 0 3. 1 2. 8 8. 2 I (transverse, kgm 2) 4. 4 3. 0
Imaging Techniques p Problems: n n p Equipment not generally available Expensive Possible exposure to radiation (e. g. gamma mass) Data reduction is time consuming Advantages: n n Subject specific parameters Equipment is becoming more generally available
Segment Length p Winter, 1990 % body height
Segment Mass and COP Winter, 1990
Segment Mass and COP Winter, 1990
Segment Mass and COP Winter, 1990
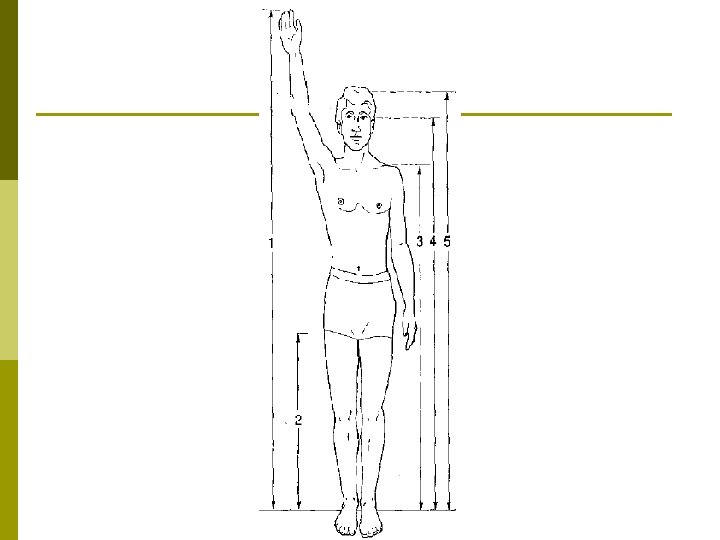
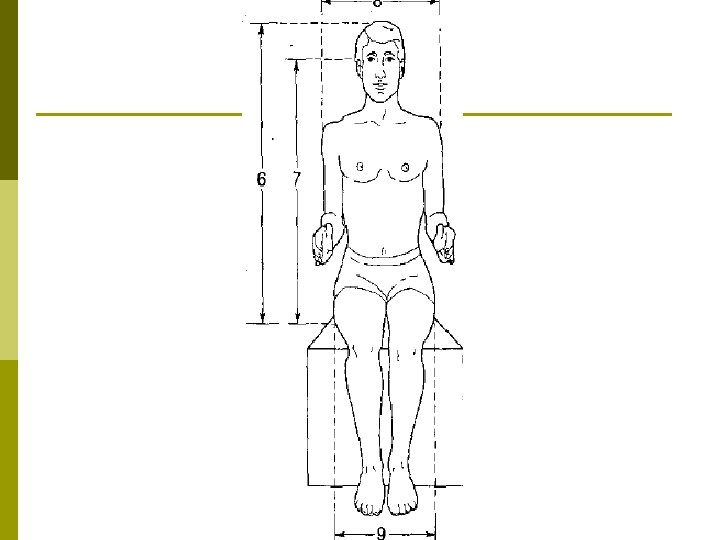
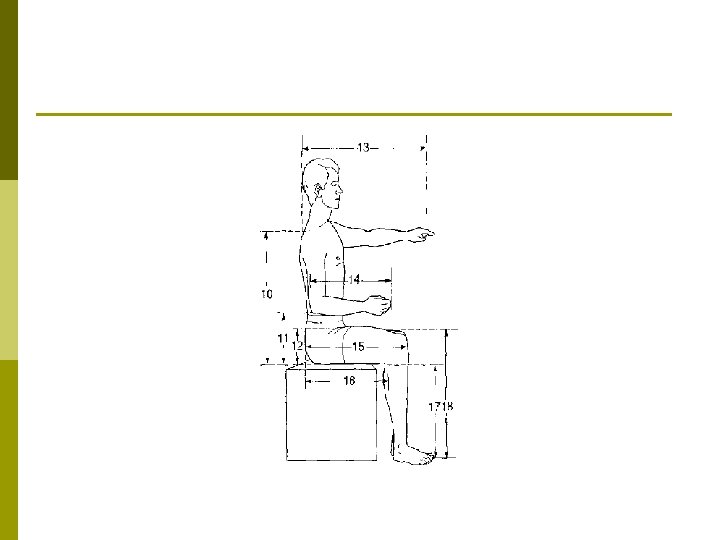
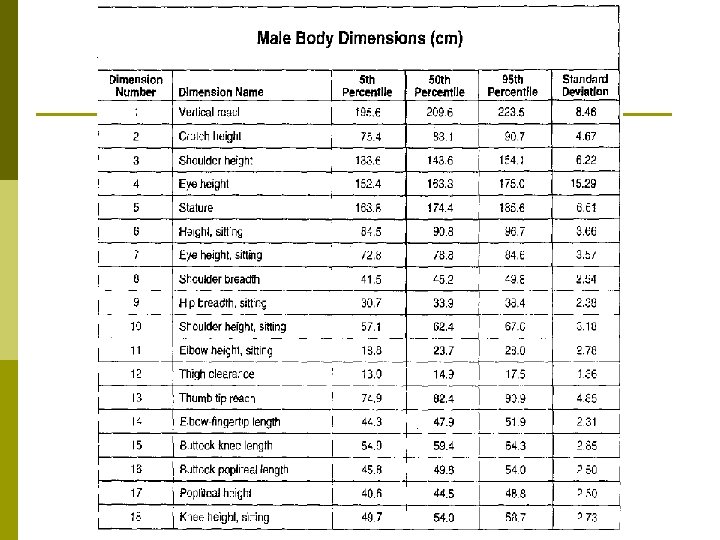
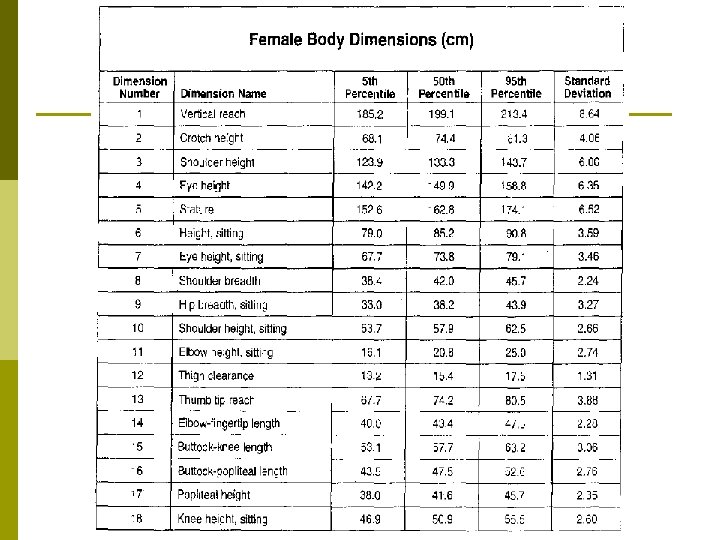
Important body dimensions