1 Measure 2 Detect 3 Control Energy Efficiency

- Slides: 60
1 Measure 2 Detect 3 Control Energy Efficiency through Automated Meter Reading Smart Energy Management 1 Apr 1, 2005 © Copyright 1986 -2005, Con. Zerv Proprietary & Confidential Smart Energy Management
Why Energy Efficiency and Conservation? 2 Because total global reserves of oil are not going to last more than 30 to 40 years. Because oil prices will keep rising continuosly. Because energy usage is directly related to Green house gases and causes global warming, climatic changes and environmental degradation. Because even coal reserves are limited to about 200 years. Finally, because high energy costs make industries less competitive Apr 1, 2005 © Copyright 1986 -2005, Con. Zerv Proprietary & Confidential Smart Energy Management
AMR in Power Plants and Industry 3 Apr 1, 2005 © Copyright 1986 -2005, Con. Zerv Proprietary & Confidential Smart Energy Management
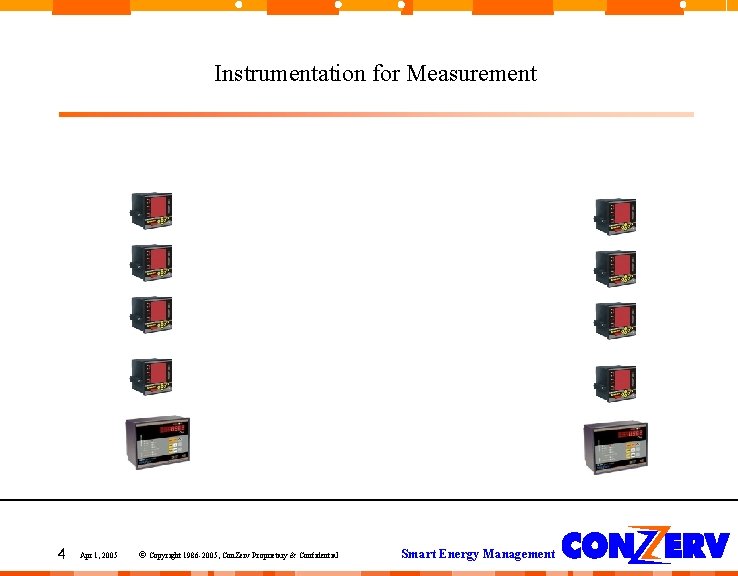
Instrumentation for Measurement 4 Apr 1, 2005 © Copyright 1986 -2005, Con. Zerv Proprietary & Confidential Smart Energy Management
Stand-Alone Meters are not enough Generally provide only Raw Data Readings cannot be correlated on-line, in Real-Time Difficult to relate Energy Consumption to production Optimisation requires On-Line Data. Difficult to achieve with Stand-Alone Instruments. 5 Apr 1, 2005 © Copyright 1986 -2005, Con. Zerv Proprietary & Confidential Smart Energy Management
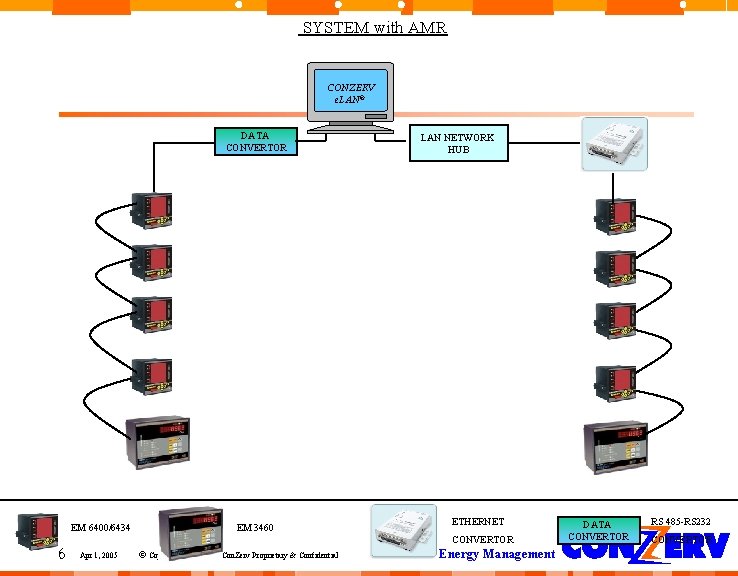
SYSTEM with AMR CONZERV e. LAN® DATA CONVERTOR EM 6400/6434 6 EM 3460 LAN NETWORK HUB ETHERNET CONVERTOR Apr 1, 2005 © Copyright 1986 -2005, Con. Zerv Proprietary & Confidential Smart Energy Management DATA CONVERTOR RS 485 -RS 232 CONVERTOR
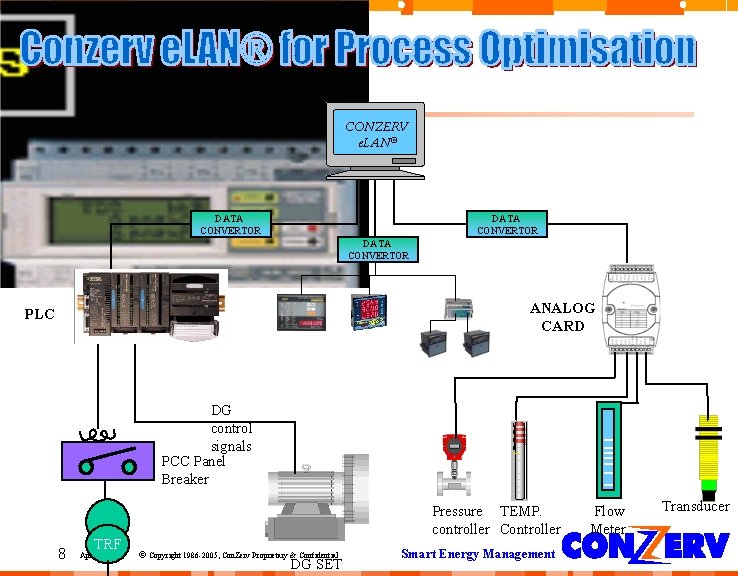
CONZERV e. LAN® DATA CONVERTOR ANALOG CARD PLC DG control signals PCC Panel Breaker 8 TRF Apr 1, 2005 Pressure TEMP. controller Controller © Copyright 1986 -2005, Con. Zerv Proprietary & Confidential DG SET Smart Energy Management Flow Meter Transducer
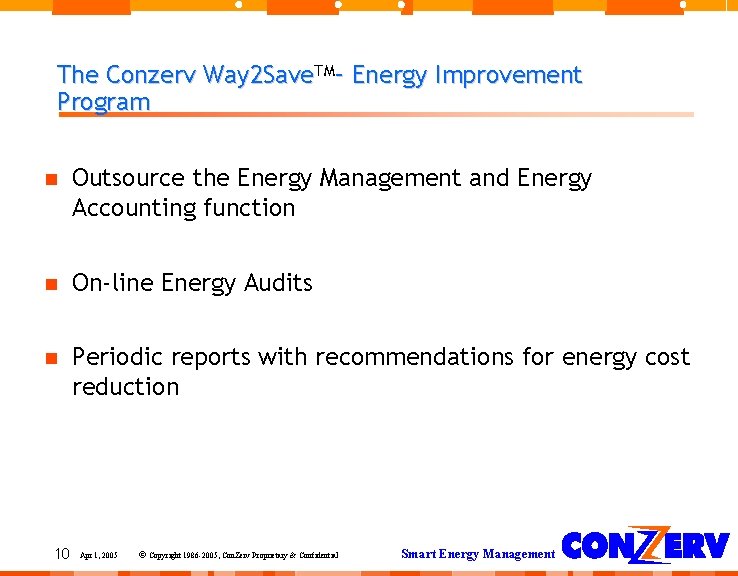
The Conzerv Way 2 Save. TM– Energy Improvement Program Outsource the Energy Management and Energy Accounting function On-line Energy Audits Periodic reports with recommendations for energy cost reduction 10 Apr 1, 2005 © Copyright 1986 -2005, Con. Zerv Proprietary & Confidential Smart Energy Management
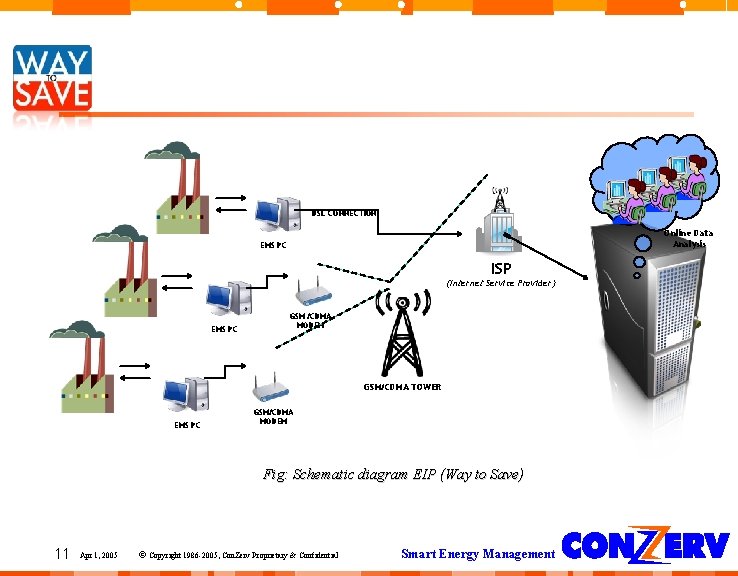
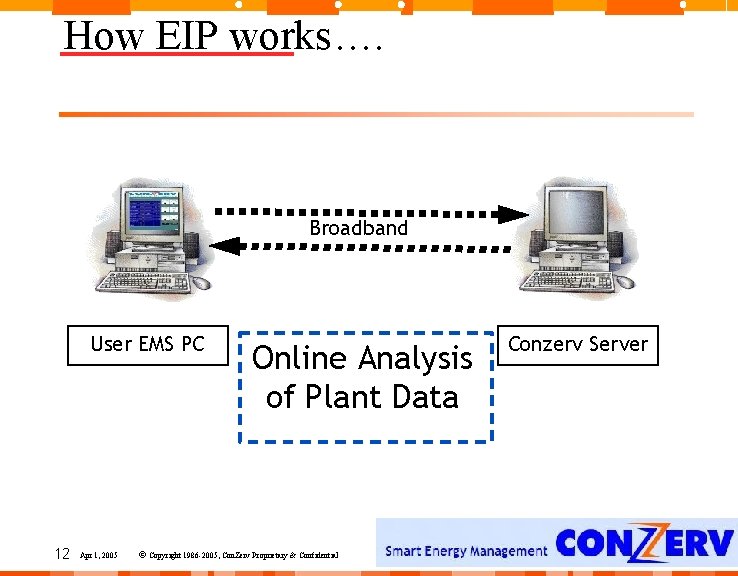
DSL CONNECTION Online Data Analysis EMS PC ISP (Internet Service Provider) EMS PC GSM /CDMA MODEM CONZERV HO GSM/CDMA TOWER EMS PC GSM/CDMA MODEM Fig: Schematic diagram EIP (Way to Save) 11 Apr 1, 2005 © Copyright 1986 -2005, Con. Zerv Proprietary & Confidential Smart Energy Management
How EIP works…. Broadband User EMS PC 12 Apr 1, 2005 Online Analysis of Plant Data © Copyright 1986 -2005, Con. Zerv Proprietary & Confidential Conzerv Server Smart Energy Management
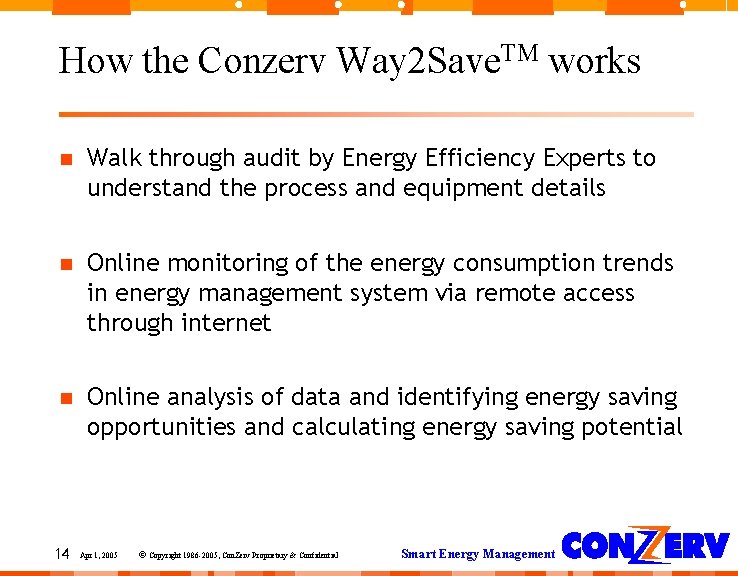
How the Conzerv Way 2 Save. TM works Walk through audit by Energy Efficiency Experts to understand the process and equipment details Online monitoring of the energy consumption trends in energy management system via remote access through internet Online analysis of data and identifying energy saving opportunities and calculating energy saving potential 14 Apr 1, 2005 © Copyright 1986 -2005, Con. Zerv Proprietary & Confidential Smart Energy Management
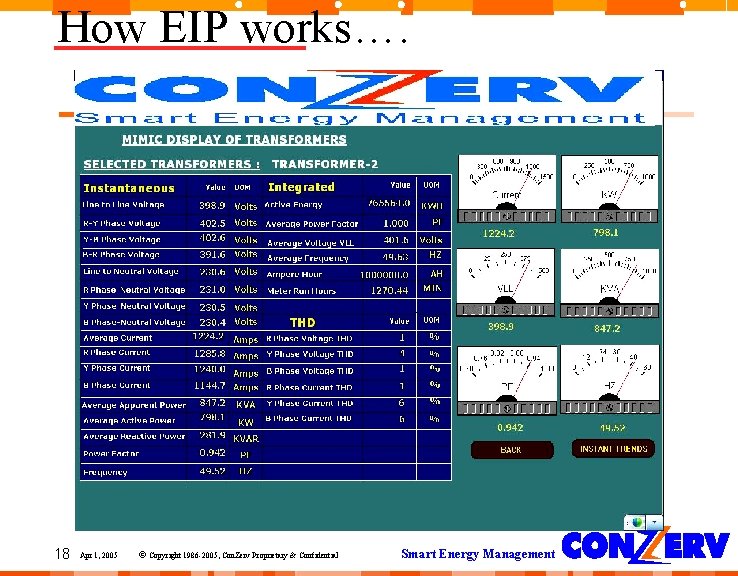
How EIP works…. Load 18 Apr 1, 2005 © Copyright 1986 -2005, Con. Zerv Proprietary & Confidential Load Smart Energy Management
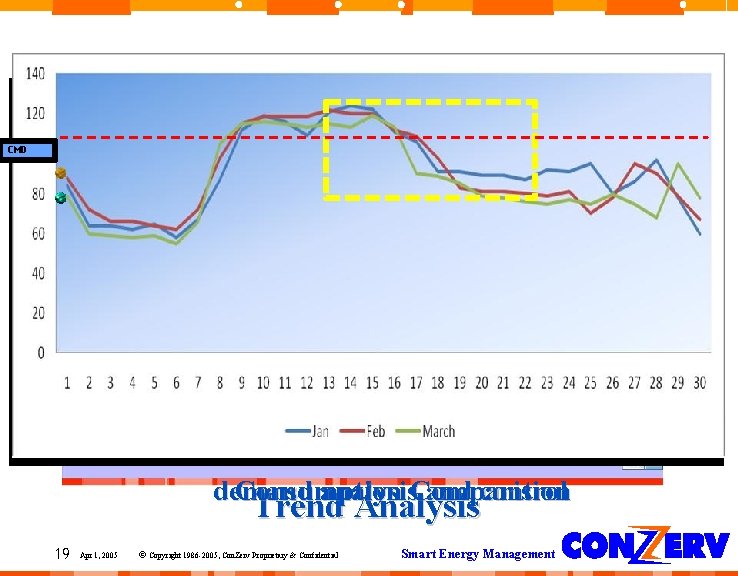
How EIP Works…… CMD How We Analyze Conzerv Server demand Consumption analysis. Comparision and control Trend Analysis 19 Apr 1, 2005 © Copyright 1986 -2005, Con. Zerv Proprietary & Confidential Smart Energy Management
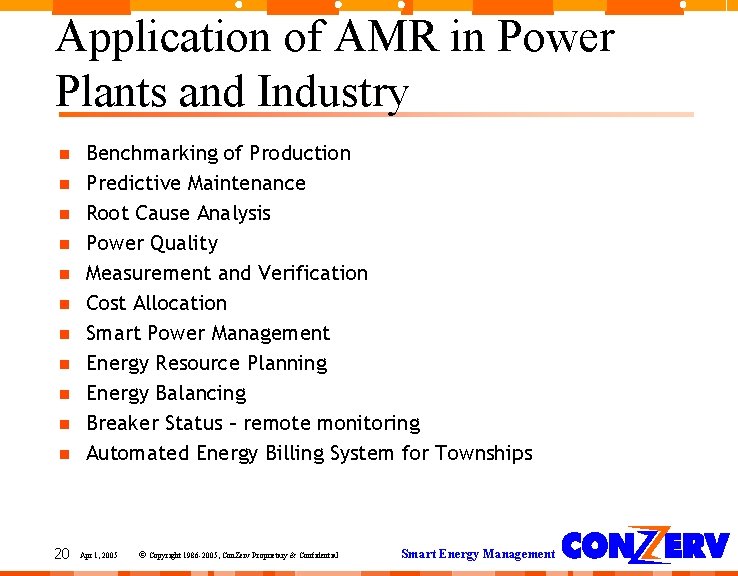
Application of AMR in Power Plants and Industry 20 Benchmarking of Production Predictive Maintenance Root Cause Analysis Power Quality Measurement and Verification Cost Allocation Smart Power Management Energy Resource Planning Energy Balancing Breaker Status – remote monitoring Automated Energy Billing System for Townships Apr 1, 2005 © Copyright 1986 -2005, Con. Zerv Proprietary & Confidential Smart Energy Management
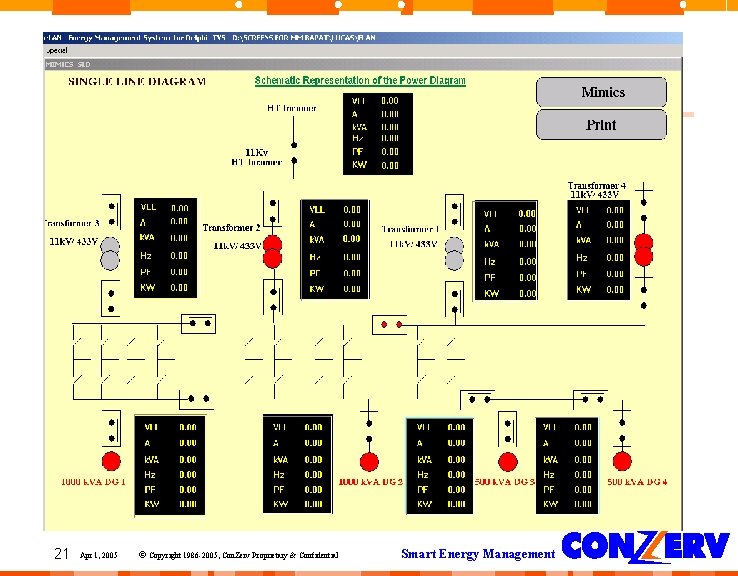
21 Apr 1, 2005 © Copyright 1986 -2005, Con. Zerv Proprietary & Confidential Smart Energy Management
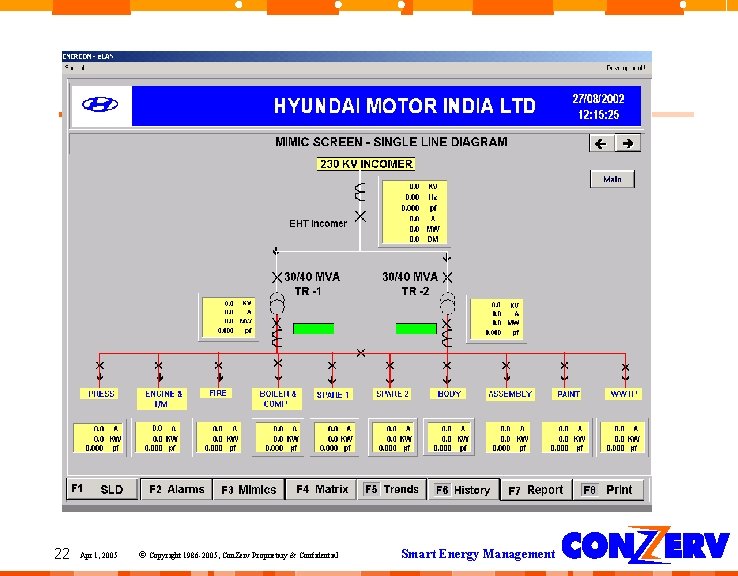
22 Apr 1, 2005 © Copyright 1986 -2005, Con. Zerv Proprietary & Confidential Smart Energy Management
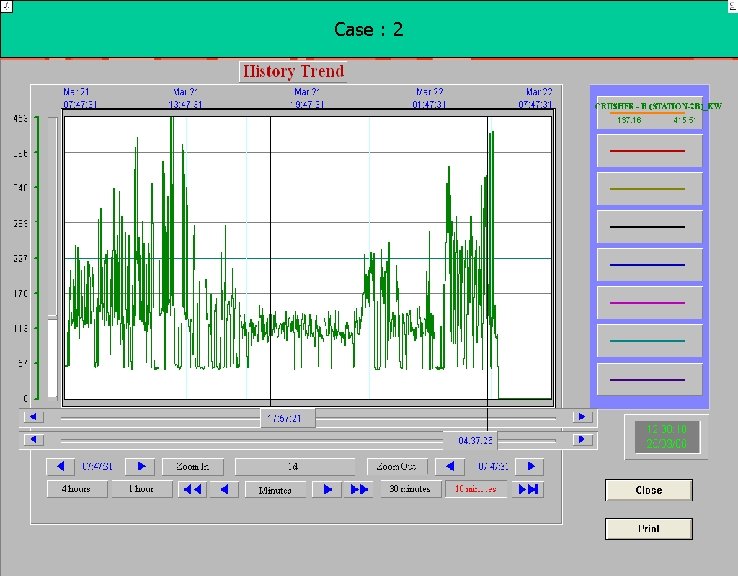
Case : 2 23 Apr 1, 2005 © Copyright 1986 -2005, Con. Zerv Proprietary & Confidential Smart Energy Management
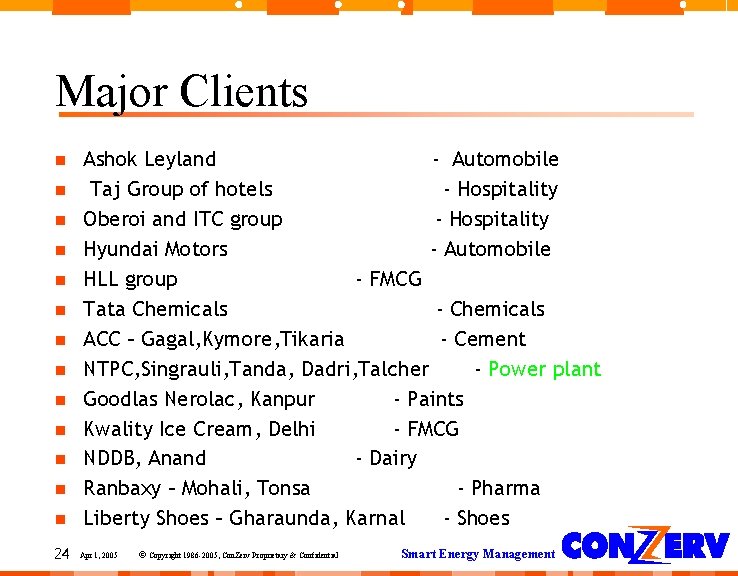
Major Clients 24 Ashok Leyland - Automobile Taj Group of hotels - Hospitality Oberoi and ITC group - Hospitality Hyundai Motors - Automobile HLL group - FMCG Tata Chemicals - Chemicals ACC – Gagal, Kymore, Tikaria - Cement NTPC, Singrauli, Tanda, Dadri, Talcher - Power plant Goodlas Nerolac, Kanpur - Paints Kwality Ice Cream, Delhi - FMCG NDDB, Anand - Dairy Ranbaxy – Mohali, Tonsa - Pharma Liberty Shoes – Gharaunda, Karnal - Shoes Apr 1, 2005 © Copyright 1986 -2005, Con. Zerv Proprietary & Confidential Smart Energy Management
Thermal Power Plants 25 Apr 1, 2005 © Copyright 1986 -2005, Con. Zerv Proprietary & Confidential Smart Energy Management
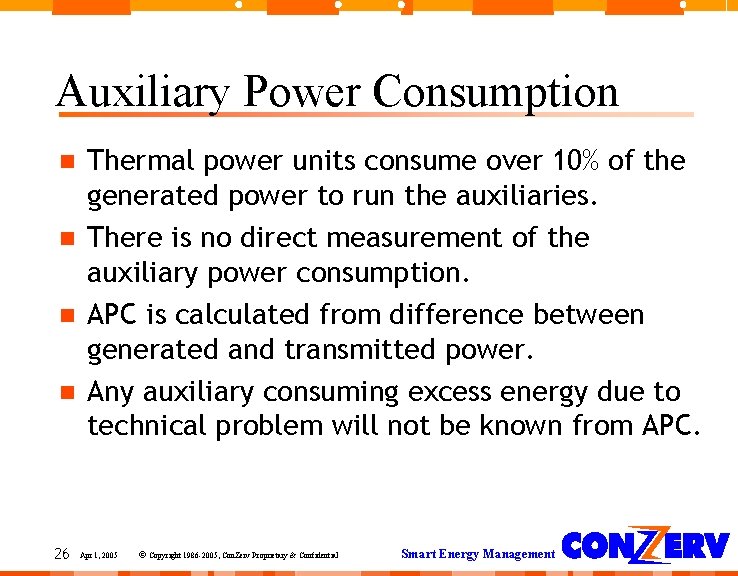
Auxiliary Power Consumption 26 Thermal power units consume over 10% of the generated power to run the auxiliaries. There is no direct measurement of the auxiliary power consumption. APC is calculated from difference between generated and transmitted power. Any auxiliary consuming excess energy due to technical problem will not be known from APC. Apr 1, 2005 © Copyright 1986 -2005, Con. Zerv Proprietary & Confidential Smart Energy Management
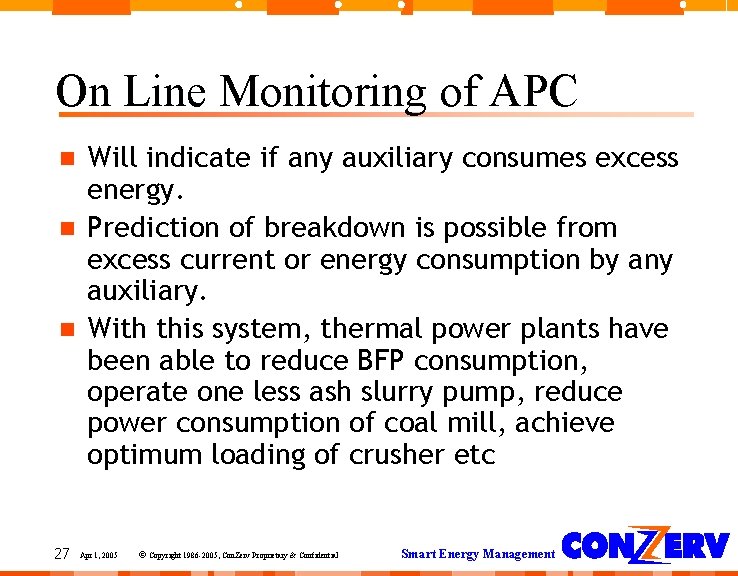
On Line Monitoring of APC 27 Will indicate if any auxiliary consumes excess energy. Prediction of breakdown is possible from excess current or energy consumption by any auxiliary. With this system, thermal power plants have been able to reduce BFP consumption, operate one less ash slurry pump, reduce power consumption of coal mill, achieve optimum loading of crusher etc Apr 1, 2005 © Copyright 1986 -2005, Con. Zerv Proprietary & Confidential Smart Energy Management
CASE STUDY BOILER FEED PUMP 28 Apr 1, 2005 © Copyright 1986 -2005, Con. Zerv Proprietary & Confidential Smart Energy Management
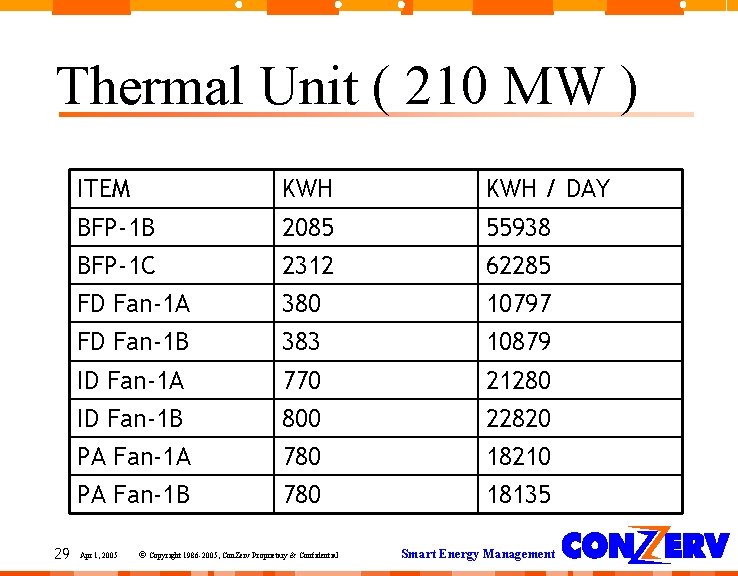
Thermal Unit ( 210 MW ) 29 ITEM KWH / DAY BFP-1 B 2085 55938 BFP-1 C 2312 62285 FD Fan-1 A 380 10797 FD Fan-1 B 383 10879 ID Fan-1 A 770 21280 ID Fan-1 B 800 22820 PA Fan-1 A 780 18210 PA Fan-1 B 780 18135 Apr 1, 2005 © Copyright 1986 -2005, Con. Zerv Proprietary & Confidential Smart Energy Management
Case Study – Boiler Feed Pump 30 Boiler feed pump 1 C showed higher energy consumption. This pump was overhauled in recent past by manufacturer. The pump internals ( cartridge ) was also replaced recently. New technology valve was also fitted in this pump. Apr 1, 2005 © Copyright 1986 -2005, Con. Zerv Proprietary & Confidential Smart Energy Management
Case Study contd. 31 All factors stated should have resulted in lower energy consumption. Obvious conclusion was that measurements were incorrect. Meter was rechecked and recalibrated. Software for on line monitoring was also checked but no fault could be located. Pump continued to show higher consumption. Apr 1, 2005 © Copyright 1986 -2005, Con. Zerv Proprietary & Confidential Smart Energy Management
Case Study contd. 32 As running 210 MW unit could not be shut down, checks were carried out on motor as well as the pump in operation. Results were inconclusive as no defects could be ascertained. Plant authorities decided to wait till next scheduled shut down. For over two months pump operated with excess consumption of 6500 units per day. Apr 1, 2005 © Copyright 1986 -2005, Con. Zerv Proprietary & Confidential Smart Energy Management
Case Study - Conclusion 33 During shut down, the pump was dismantled. Observed that in the recirculating valve there was a gap resulting in higher energy for same pumping requirement. From the BFP itself, On line monitoring system could payback in less than two months. Analogue ammeter of say 500 Amp full scale may not show noticeable difference between 228 and 252 Amps Apr 1, 2005 © Copyright 1986 -2005, Con. Zerv Proprietary & Confidential Smart Energy Management
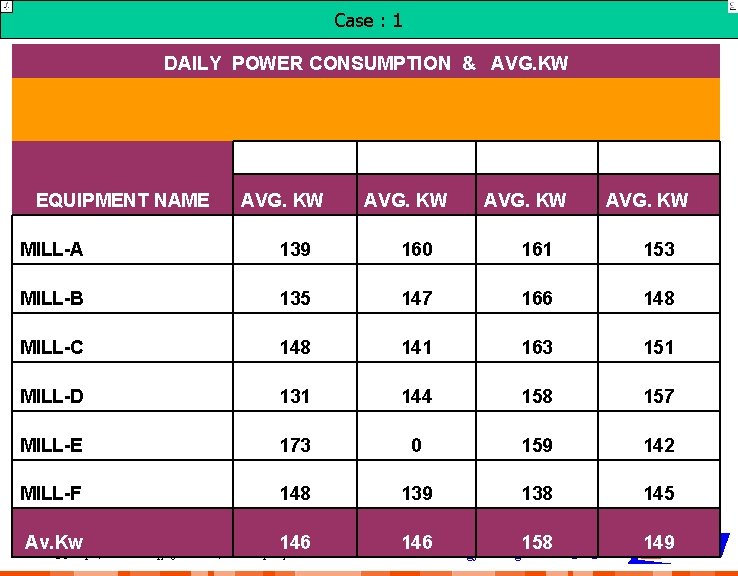
Coal Mill 34 Actual power consumption of a coal mill is shown in next slide. Mill E is showing unusually high consumption. Apr 1, 2005 © Copyright 1986 -2005, Con. Zerv Proprietary & Confidential Smart Energy Management
Case : 1 DAILY POWER CONSUMPTION & AVG. KW EQUIPMENT NAME UNIT-1 UNIT-2 UNIT-3 UNIT-4 AVG. KW MILL-A 139 160 161 153 MILL-B 135 147 166 148 MILL-C 148 141 163 151 MILL-D 131 144 158 157 MILL-E 173 0 159 142 MILL-F 148 139 138 145 146 158 Smart Energy Management 149 Av. Kw. Apr 1, 2005 35 © Copyright 1986 -2005, Con. Zerv Proprietary & Confidential
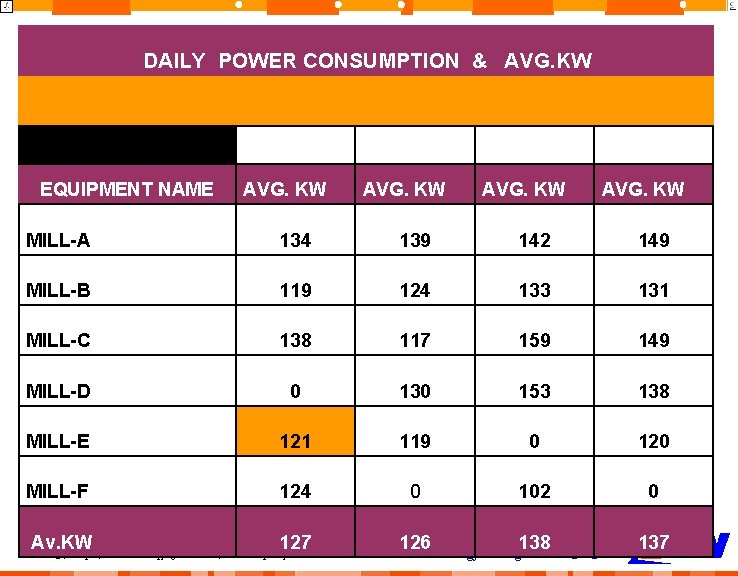
Coal Mill 36 Looking at high consumption mill E is attended to for necessary repair and maintenance. Results of correct operation can be seen in the next slide – a reduction of over 50 KW in one mill. Apr 1, 2005 © Copyright 1986 -2005, Con. Zerv Proprietary & Confidential Smart Energy Management
DAILY POWER CONSUMPTION & AVG. KW EQUIPMENT NAME UNIT-1 UNIT-2 UNIT-3 UNIT-4 AVG. KW MILL-A 134 139 142 149 MILL-B 119 124 133 131 MILL-C 138 117 159 149 MILL-D 0 130 153 138 MILL-E 121 119 0 120 MILL-F 124 0 102 0 Av. KW Apr 1, 2005 37 127 © Copyright 1986 -2005, Con. Zerv Proprietary & Confidential 126 138 Smart Energy Management 137
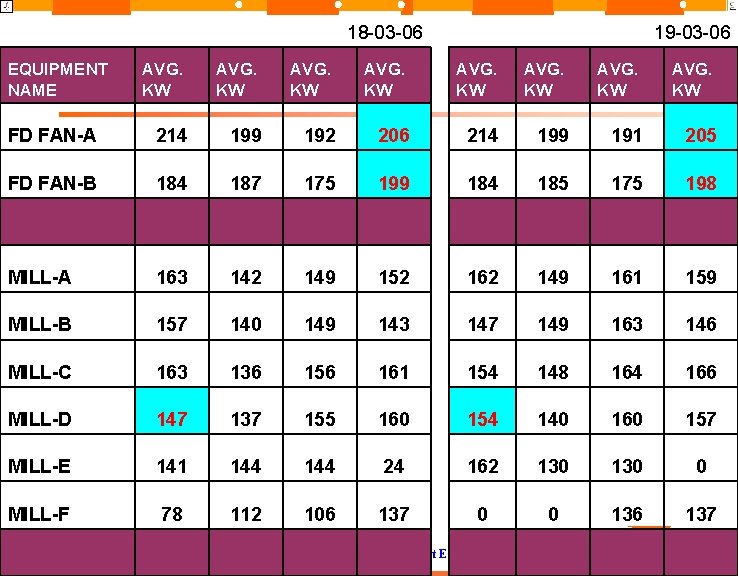
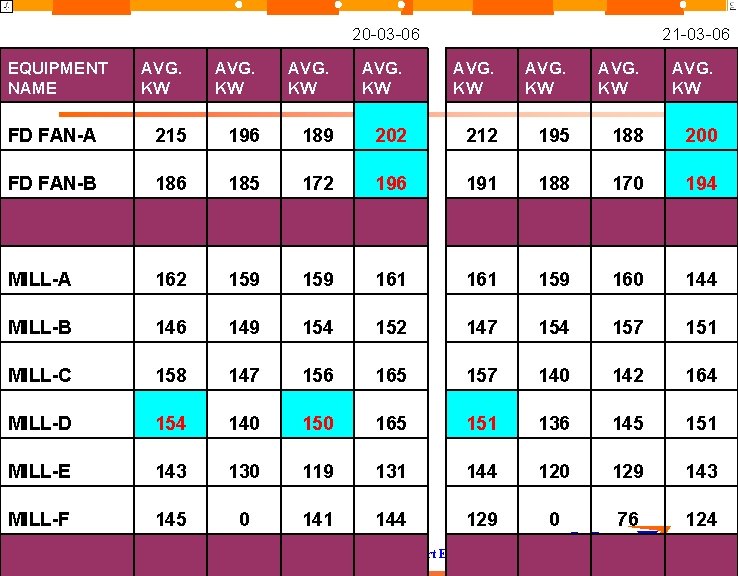
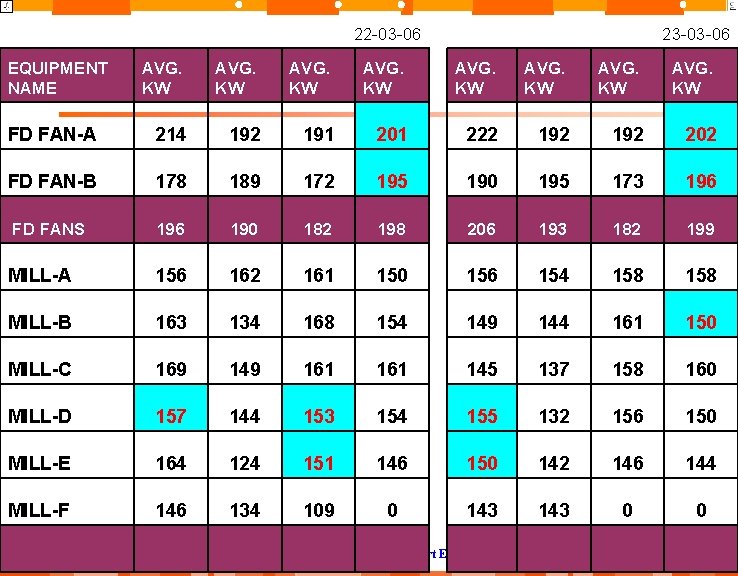
Coal Mill Operation 38 In the next three slides daily report of coal mills is shown. Mill D shows increasing power consumption trend from 18/3 to 23/3. Apr 1, 2005 © Copyright 1986 -2005, Con. Zerv Proprietary & Confidential Smart Energy Management
18 -03 -06 EQUIPMENT NAME 19 -03 -06 AVG. KW AVG. KW FD FAN-A 214 199 192 206 214 199 191 205 FD FAN-B 184 187 175 199 184 185 175 198 MILL-A 163 142 149 152 162 149 161 159 MILL-B 157 140 149 143 147 149 163 146 MILL-C 163 136 156 161 154 148 164 166 MILL-D 147 137 155 160 154 140 160 157 MILL-E 141 144 24 162 130 0 MILL-F 78 112 106 137 0 0 136 137 39 Apr 1, 2005 © Copyright 1986 -2005, Con. Zerv Proprietary & Confidential Smart Energy Management
20 -03 -06 EQUIPMENT NAME 21 -03 -06 AVG. KW AVG. KW FD FAN-A 215 196 189 202 212 195 188 200 FD FAN-B 186 185 172 196 191 188 170 194 MILL-A 162 159 161 159 160 144 MILL-B 146 149 154 152 147 154 157 151 MILL-C 158 147 156 165 157 140 142 164 MILL-D 154 140 150 165 151 136 145 151 MILL-E 143 130 119 131 144 120 129 143 MILL-F 145 0 141 144 129 0 76 124 40 Apr 1, 2005 © Copyright 1986 -2005, Con. Zerv Proprietary & Confidential Smart Energy Management
22 -03 -06 EQUIPMENT NAME 23 -03 -06 AVG. KW AVG. KW FD FAN-A 214 192 191 201 222 192 202 FD FAN-B 178 189 172 195 190 195 173 196 FD FANS 196 190 182 198 206 193 182 199 MILL-A 156 162 161 150 156 154 158 MILL-B 163 134 168 154 149 144 161 150 MILL-C 169 149 161 145 137 158 160 MILL-D 157 144 153 154 155 132 156 150 MILL-E 164 124 151 146 150 142 146 144 MILL-F 146 134 109 0 143 0 0 41 Apr 1, 2005 © Copyright 1986 -2005, Con. Zerv Proprietary & Confidential Smart Energy Management
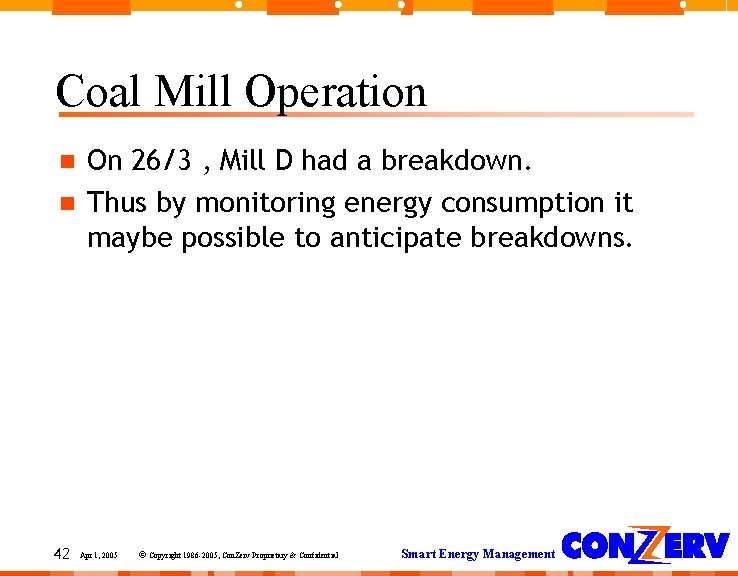
Coal Mill Operation 42 On 26/3 , Mill D had a breakdown. Thus by monitoring energy consumption it maybe possible to anticipate breakdowns. Apr 1, 2005 © Copyright 1986 -2005, Con. Zerv Proprietary & Confidential Smart Energy Management
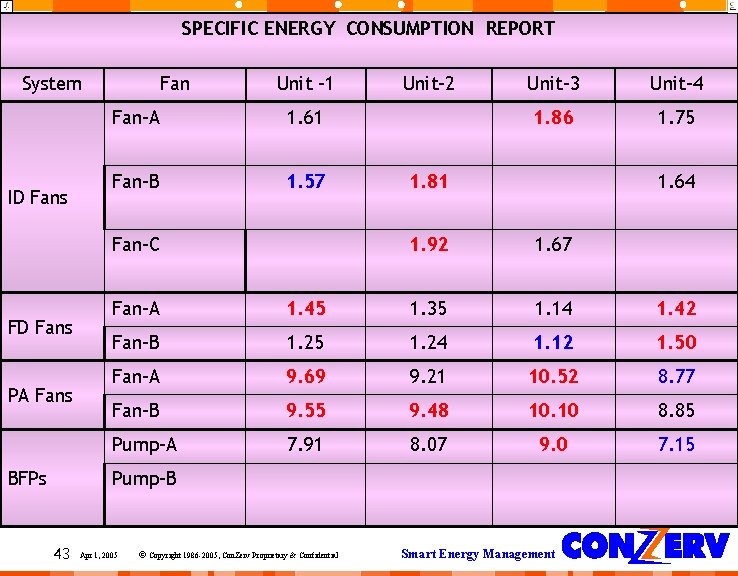
SPECIFIC ENERGY CONSUMPTION REPORT System ID Fans Fan Unit -1 Fan-A 1. 61 Fan-B 1. 57 Fan-C FD Fans PA Fans BFPs Unit-2 Unit-3 Unit-4 1. 86 1. 75 1. 81 1. 64 1. 92 1. 67 Fan-A 1. 45 1. 35 1. 14 1. 42 Fan-B 1. 25 1. 24 1. 12 1. 50 Fan-A 9. 69 9. 21 10. 52 8. 77 Fan-B 9. 55 9. 48 10. 10 8. 85 Pump-A 7. 91 8. 07 9. 0 7. 15 Pump-B 43 Apr 1, 2005 © Copyright 1986 -2005, Con. Zerv Proprietary & Confidential Smart Energy Management
Application of AMR for Energy Efficiency In Industries 44 Apr 1, 2005 © Copyright 1986 -2005, Con. Zerv Proprietary & Confidential Smart Energy Management
Energy Efficiency On the basis of data collected from the facility , following systems / subsystems will be covered in the presentation which follows: >Load and Demand Pattern >Power Factor >Harmonics > Motors > Air Compressors > Air Conditioning and Refrigeration > Pumps and Blowers > Cooling Towers > Boilers > Lighting >DG Sets 45 Apr 1, 2005 © Copyright 1986 -2005, Con. Zerv Proprietary & Confidential Smart Energy Management
Motors 46 Apr 1, 2005 © Copyright 1986 -2005, Con. Zerv Proprietary & Confidential Smart Energy Management
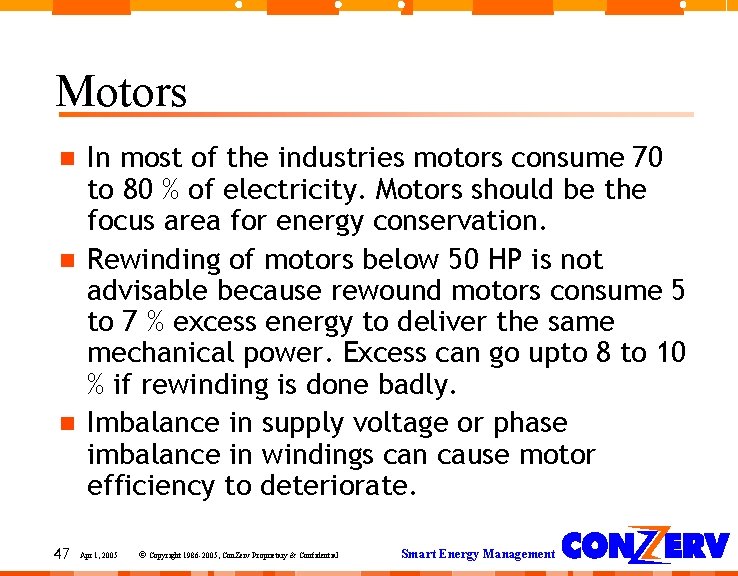
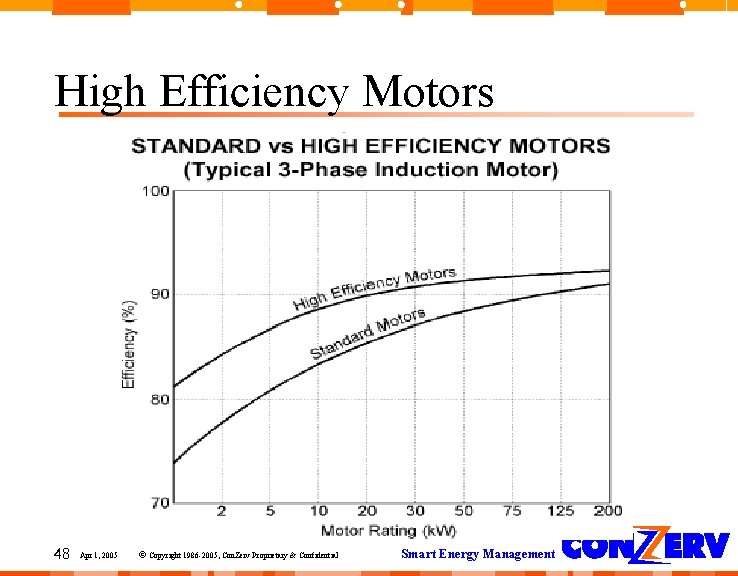
Motors 47 In most of the industries motors consume 70 to 80 % of electricity. Motors should be the focus area for energy conservation. Rewinding of motors below 50 HP is not advisable because rewound motors consume 5 to 7 % excess energy to deliver the same mechanical power. Excess can go upto 8 to 10 % if rewinding is done badly. Imbalance in supply voltage or phase imbalance in windings can cause motor efficiency to deteriorate. Apr 1, 2005 © Copyright 1986 -2005, Con. Zerv Proprietary & Confidential Smart Energy Management
High Efficiency Motors 48 Apr 1, 2005 © Copyright 1986 -2005, Con. Zerv Proprietary & Confidential Smart Energy Management
Monitoring for Energy Efficiency in Motors 49 AMR can provide a trend of current and energy consumption which can be used to know if any motor is heading for a breakdown if the trend shows a sudden or steadily increasing trend. System can indicate any loss of efficiency of heavy motors on a continuous basis and assist in maintenance so that problem can be attended to before burnout. Imbalances in voltages or winding imbalances can be conveniently monitored for corrective action without delay. Apr 1, 2005 © Copyright 1986 -2005, Con. Zerv Proprietary & Confidential Smart Energy Management
Air Compressors 50 Apr 1, 2005 © Copyright 1986 -2005, Con. Zerv Proprietary & Confidential Smart Energy Management
Air Compressors Compressed Air Efficiency: 60 to 80% of the power of the prime mover is converted into an unusable form of energy (HEAT) And to a lesser extent, into friction, misuse and noise. Overall efficiency of compressed air is 10 to 20 % 51 If use of compressed air is unavoidable, it should be closely monitored for energy Smart Energy Management consumption. Apr 1, 2005 © Copyright 1986 -2005, Con. Zerv Proprietary & Confidential
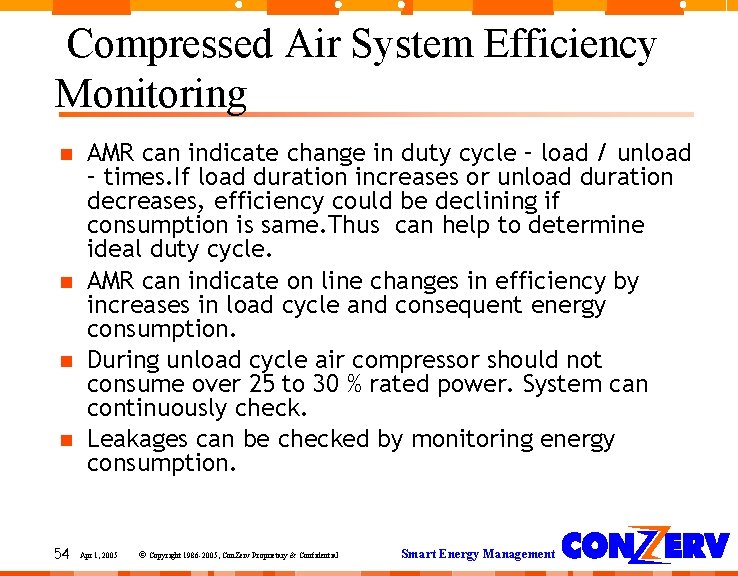
Compressed Air System Efficiency Monitoring 54 AMR can indicate change in duty cycle – load / unload – times. If load duration increases or unload duration decreases, efficiency could be declining if consumption is same. Thus can help to determine ideal duty cycle. AMR can indicate on line changes in efficiency by increases in load cycle and consequent energy consumption. During unload cycle air compressor should not consume over 25 to 30 % rated power. System can continuously check. Leakages can be checked by monitoring energy consumption. Apr 1, 2005 © Copyright 1986 -2005, Con. Zerv Proprietary & Confidential Smart Energy Management
Efficiency of Generating Sets 55 Apr 1, 2005 © Copyright 1986 -2005, Con. Zerv Proprietary & Confidential Smart Energy Management
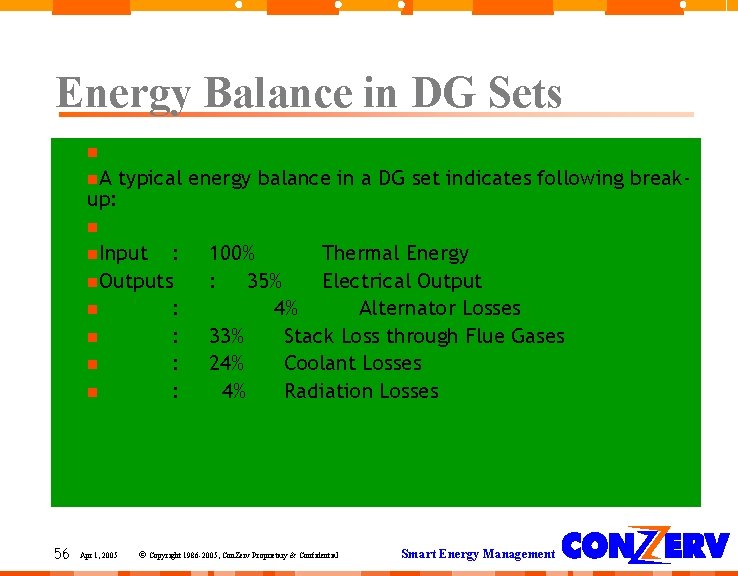
Energy Balance in DG Sets A typical energy balance in a DG set indicates following breakup: Input : 100% Thermal Energy Outputs : 35% Electrical Output : 4% Alternator Losses : 33% Stack Loss through Flue Gases : 24% Coolant Losses : 4% Radiation Losses 56 Apr 1, 2005 © Copyright 1986 -2005, Con. Zerv Proprietary & Confidential Smart Energy Management
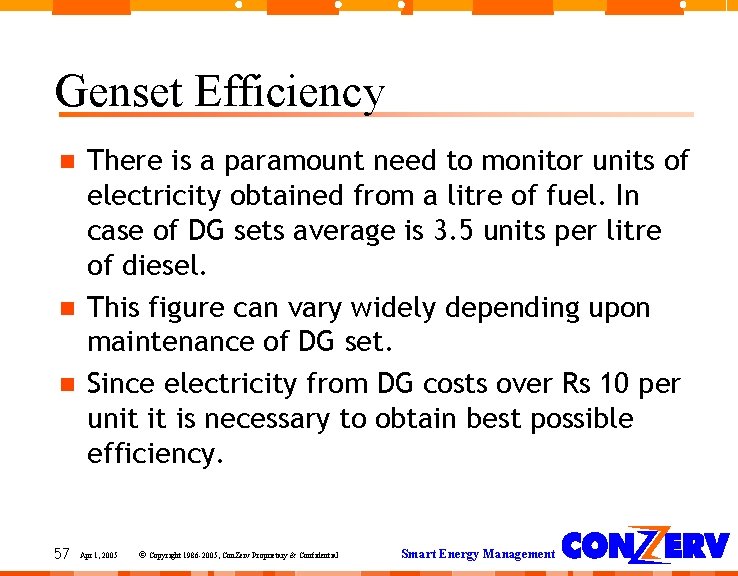
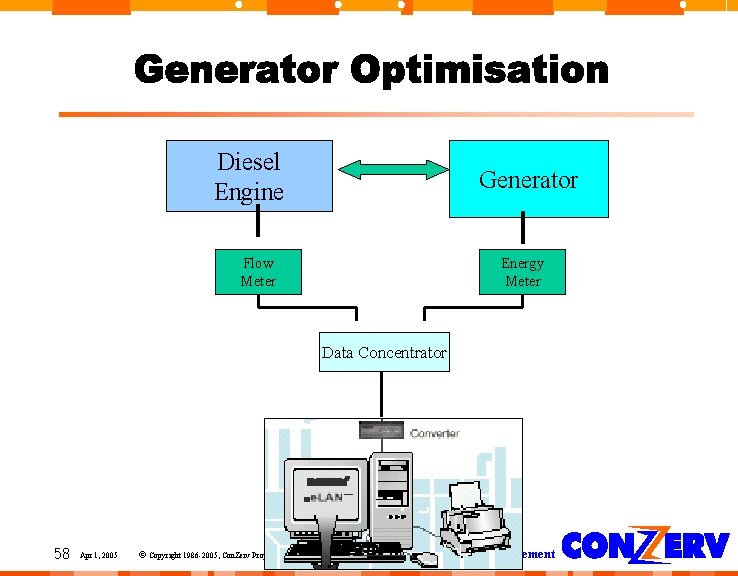
Genset Efficiency 57 There is a paramount need to monitor units of electricity obtained from a litre of fuel. In case of DG sets average is 3. 5 units per litre of diesel. This figure can vary widely depending upon maintenance of DG set. Since electricity from DG costs over Rs 10 per unit it is necessary to obtain best possible efficiency. Apr 1, 2005 © Copyright 1986 -2005, Con. Zerv Proprietary & Confidential Smart Energy Management
Diesel Engine Generator Flow Meter Energy Meter Data Concentrator 58 Apr 1, 2005 © Copyright 1986 -2005, Con. Zerv Proprietary & Confidential Smart Energy Management
Genset Optimisation by On Line Monitoring 59 Online Generator Optimisation is the best way to maintain efficiency as it can immediately indicate any loss in efficiency. System can also be used for Condition Monitoring of gensets by overhauling only when specific fuel consumption goes below a threshold point Apr 1, 2005 © Copyright 1986 -2005, Con. Zerv Proprietary & Confidential Smart Energy Management
Load and Demand Pattern 60 Apr 1, 2005 © Copyright 1986 -2005, Con. Zerv Proprietary & Confidential Smart Energy Management
Electricity Billing The consumer pays for two components. 61 Apr 1, 2005 For the energy k. Wh consumed For the maximum demand (k. VA) registered © Copyright 1986 -2005, Con. Zerv Proprietary & Confidential Smart Energy Management
Load Management Traditionally, Load management is carried out by the following methods: Maximum demand control Reschedule loads Staggering of motor loads Storage of products/in process material/process utilities like refrigeration Shedding of non essential loads Operation of Captive power generation Reactive power compensation 62 Apr 1, 2005 © Copyright 1986 -2005, Con. Zerv Proprietary & Confidential Smart Energy Management
Demand Management 63 Demand can be contained within the level sanctioned by electricity board by maintaining load KVA by various means. There should be staggered starting of heavy motors so that starting current can be kept within limits. Non essential loads can be switched off when the demand is likely to exceed. Apr 1, 2005 © Copyright 1986 -2005, Con. Zerv Proprietary & Confidential Smart Energy Management
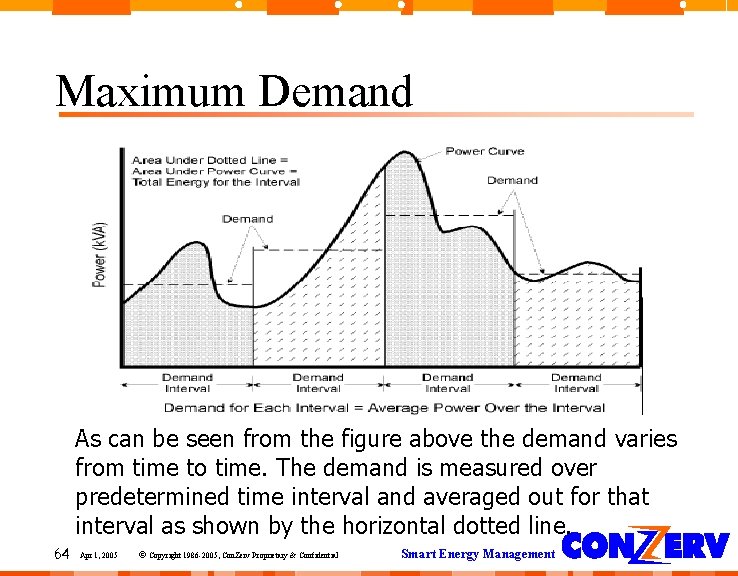
Maximum Demand As can be seen from the figure above the demand varies from time to time. The demand is measured over predetermined time interval and averaged out for that interval as shown by the horizontal dotted line. 64 Apr 1, 2005 © Copyright 1986 -2005, Con. Zerv Proprietary & Confidential Smart Energy Management
AMR in Demand Control 65 AMR can be used to monitor KVA consumption of the plant. Monitoring of instant values of KVA and trend can be used to ensure that sanctioned demand is not exceeded and that facility does not have to pay demand penalty. System can also be useful in ensuring that heavy motors are started sequentially without exceeding demand level System provides historical data of the demand levels reached in the previous few months to ensure proper resource planning. Apr 1, 2005 © Copyright 1986 -2005, Con. Zerv Proprietary & Confidential Smart Energy Management
ACCREDITATION CONZERV is accredited for Energy Audit by Bureau of Energy Efficiency, Ministry of Power, Govt of India under Energy Conservation Act 2001 70 Apr 1, 2005 © Copyright 1986 -2005, Con. Zerv Proprietary & Confidential Smart Energy Management
Thank you 71 Apr 1, 2005 © Copyright 1986 -2005, Con. Zerv Proprietary & Confidential Smart Energy Management
Contact Details 72 Conzerv Systems Pvt Ltd 87, IDC, Mehrauli Road Gurgaon 122 001 Tel 0124 - 4268899 Ramesh Bhatia General Manager (Corporate Sales) Mobile no 098685 29414 Email: ramesh. bhatia@conzerv. com Apr 1, 2005 © Copyright 1986 -2005, Con. Zerv Proprietary & Confidential Smart Energy Management