What are Calories Way food scientists measure food


, fatty")


 Amount Per Serving %DV * Total Calories 230")


 Ø High Blood Pressure Ø")


- Slides: 117
What are Calories? Ø Way food scientists measure food energy Ø Kilocalorie – the amount of heat energy necessary to raise the temperature of a kilogram (1 liter) of water 1 degree Celsius – aka calorie
Sources of Calories Ø Carbohydrates – 4 per gram Ø Protein – 4 per gram Ø Fat – 9 per gram Ø Alcohol – 7 per gram
Essential Nutrients Ø Carbohydrates Ø Protein Ø Fats Ø Vitamins Ø Minerals Ø Water
Carbohydrates Ø Ø Ø Provides energy 4 calories per gram (size of a small paper clip) Simple Carbs Refined sugars Contain no other nutrients – proteins, vitamins, minerals, or fiber Broken down quickly – mostly in small intestines Ø Ø Ø Complex Carbs Broken down slowly Slows down digestion – less hungry Eating proper amount provides energy for body Carbs have less calories gram for gram than dietary fats Human bodies must convert glucose to fats – which in the process causes most of the calories to be lost
Benefits of Complex Carbohydrates Reduce risk of colon cancer Ø Reduce energy consumption – helps with weight control Ø Reduce risk of heart and artery disease Ø Promote feeling of fullness Ø Prevent bacterial infections Ø Keep muscles of digestive tract healthy Ø
Protein Ø Builds and repairs the body Ø 4 calories per gram
Fats Ø Stored energy Ø 9 calories per gram Ø Saturated, polyunsaturated, and monounsaturated fats
Vitamins Ø Regulates body functions Ø Should come from diet Ø No calories or energy value
Minerals Ø act to build and regulate the body's tissues and organs, bones and muscles Ø No calories or energy value
Water Ø Helps regulate body temperature Ø 8 glasses per day Ø Increase with physical activity Ø No calories or energy value
Where calories should come from: Ø 50 -60% from carbohydrates Ø 12 -15% protein Ø less than 30% from fat
Types of energy Protein – gives body energy in same way as carbs – no advantage over carbs Ø Fats – cause problems Ø Carbs – preferred energy souce Ø
Body’s use of “fuels” Ø Ø Ø Ø Uses mix of carbohydrates (glucose), fatty acids, and amino acids (protein) for energy. During rest: ½ from fats ½ from carbs Physical activity: mostly glucose – sends energy throughout body – leads to use of fat and protein A high carb diet can triple an athlete’s endurance High fat diet: 57 minutes of maximum endurance Normal mixed diet: 114 minutes of maximum endurance High carb diet: 167 minutes of maximum endurance
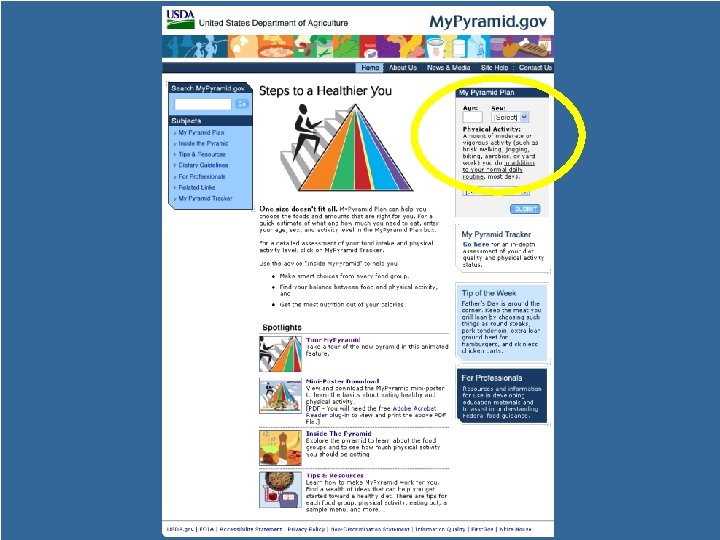
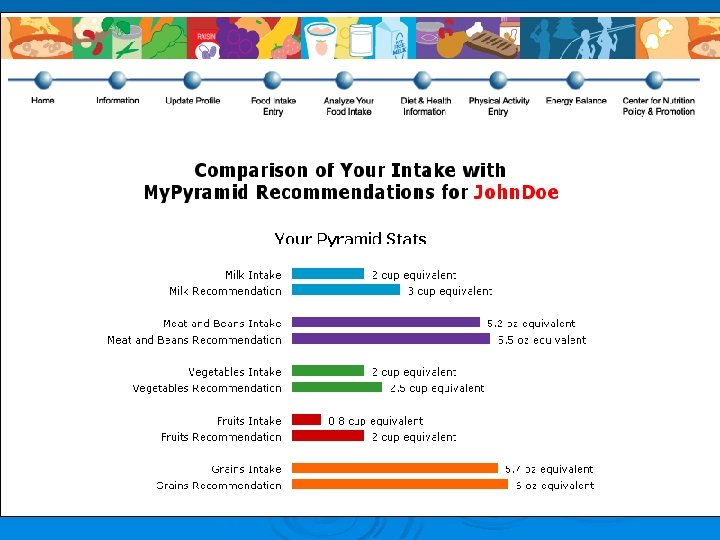
My. Pyramid USDA’s New Food Guidance System United States Department of Agriculture Center for Nutrition Policy & Promotion
What does the 2005 Pyramid tells us?
Anatomy of My Pyramid Activity = by the steps and the person climbing them, the importance of daily physical activity. Moderation = the narrowing of each food group from bottom to top. The wider base stands for foods with little or no solid fats or added sugars. These should be selected more often. The narrower top area stands for foods containing more added sugars and solid fats. The more active you are, the more of these foods can fit into your diet. Personalization = the person on the steps, the slogan, and the URL. Find the kinds of amounts of food to eat each day at My. Pyramid. gov. Proportionality = the different widths of the food group bands. The widths suggest how much food a person should choose from each group. The widths are just a general guide, not exact proportions. Check the Web site for how much is right for you. Variety = symbolized by the 6 color bands representing the 5 food groups of the Pyramid and oils. Foods from all groups are needed each day for good health. Gradual Improvement = encouraged by the slogan. It suggests that individuals can benefit from taking small steps to improve their diet and lifestyle each day.
Message: Physical Activity In the Dietary Guidelines: Ø Engage in regular physical activity and reduce sedentary activities to promote health, psychological well-being, and a healthy body weight. In My. Pyramid graphic: Ø Steps and person on them symbolize that physical activity should be a part of everyday healthy living.
Message: Moderation In the Dietary Guidelines: Ø Limit intake of saturated and trans fats, and choose products low in these fats. Ø Make choices of meat, poultry, dry beans, and milk products that are lean, low-fat, or fat-free. Ø Choose and prepare foods and beverages with little added sugars or calorie sweeteners. In My. Pyramid graphic: Ø Food group bands narrow from bottom to top suggesting to eat nutrient-dense forms of foods.
Additional Messages in the My. Pyramid Graphic To foster implementation Personalization: Ø The name “My. Pyramid” suggests an individual approach. Ø The person climbing the steps mentally links each viewer to the image. Gradual Improvement: Ø The slogan “Steps to a Healthier You” suggests that improvement should happen in stages, over time.
Message: Proportionality In the Dietary Guidelines: Ø Adopt a balanced eating pattern. l l l Sufficient amount of fruits and vegetables, 3 or more ounce equivalents of whole-grain products per day 3 cup equivalents per day of fat-free or low-fat milk or milk products. In My. Pyramid graphic: Ø Differing widths of the color bands suggest about how much food should be eaten from each group.
Message: Variety
Final Graphic Design Activity Moderation Proportionality Variety Personalization Gradual Improvement
Key food group messages from the Dietary Guidelines and My. Pyramid: Focus on fruits. Vary your veggies. Get your calcium-rich foods. Make half your grains whole. Go lean with protein. Know the limits on fats, salt, and sugars.
Pyramid Power Milk, Yogurt, & Cheese Group Choose Often Choose Sometimes Choose Rarely Skim & 1% lowfat milk 2% lowfat milk Whole Milk Products made with skim & 1% low fat milk Products made with 2% lowfat milk Products made with whole milk Cheeses with 2 or fewer grams of fat per ounce Cheeses with 3 to 5 grams of fat per ounce Cheeses with more than 5 grams of fat per ounce Frozen dairy desserts with 2 grams of fat or less per item or per ½ cup serving Frozen dairy desserts with 3 to 5 grams of fat or less per item or per ½ cup serving Frozen dairy desserts with more than 5 grams of fat or less per item or per ½ cup serving
Pyramid Power Meat, Poultry, Fish, Dry Beans, Eggs & Nuts Choose Often Beef: Eye of Round, top round Choose Sometimes Choose Rarely Beef: Tip or bottom round, Beef: Porterhouse steak, sirloin, chuck arm pot roast, brisket, chuck blade roast, top loin, tenderloin, flank, trib-eye, ribs, ground beef, bone steak liver, corned beef, pastrami, bologna, salami, frankfurts Chicken breast w/o skin: turkey breast or leg: turkey wing w/o skin: ground turkey w/o skin Chicken breast with skin: chicken leg, thigh, or wing w/o skin: turkey wing with skin Chicken leg, thigh, or wing with skin: chicken liver: ground turkey with skin; duck & goose Poultry cold cuts with up to 1 gram of fat per ounce Poultry cold cuts with 2 grams of fat per ounce Poultry cold cuts with 3 or more grams of fat per ounce All dried beans, peas & lentils Soybeans, tofu Nuts, peanuts, & other nut butters Egg whites Egg substitutes Whole eggs or yolks All fresh fish & shellfish: canned fish, water-packed, drained Smoked fish: canned fish, oil packed, drained
Pyramid Power Vegetable Group Choose Often Choose Sometimes Choose Rarely Fresh vegetables or frozen vegetables without sauce Canned vegetables, vegetable juices Frozen vegetables in sauce
Pyramid Power Fruit Group Choose Often Choose Sometimes Choose Rarely All fresh fruit (except avocado & olives) Dried fruit, fruit juices, canned fruit in its own juice Avocado & olives Unsweetened applesauce Sweetened applesauce
Pyramid Power Bread, Cereal, Rice & Pasta Group Choose Often Choose Sometimes Choose Rarely Bread, Bagels, Pita Egg breads: French toast: Pancakes: Waffles Bread Stuffing: Croissants Muffins, biscuits, or rolls with 2 or fewer grams of fat Muffins, biscuits, or rolls with 2 to 4 grams of fat Muffins, biscuits, or rolls with more than 4 grams of fat Unbuttered air-popped popcorn, pretzels, rice cakes, bread sticks Crackers with 1 gram or less of fat per ½ ounce Oil popped and/or buttered popcorn Crackers with 2 grams or less of fat per ½ ounce Cold cereals with 2 or fewer Cold cereal high in sugar or grams of fat & 6 or fewer fat grams of sugar per serving: Hot Cereals Pasta Egg Noodles Corn Tortillas Flour Tortillas Crackers with 3 or more grams of fat per ½ ounce
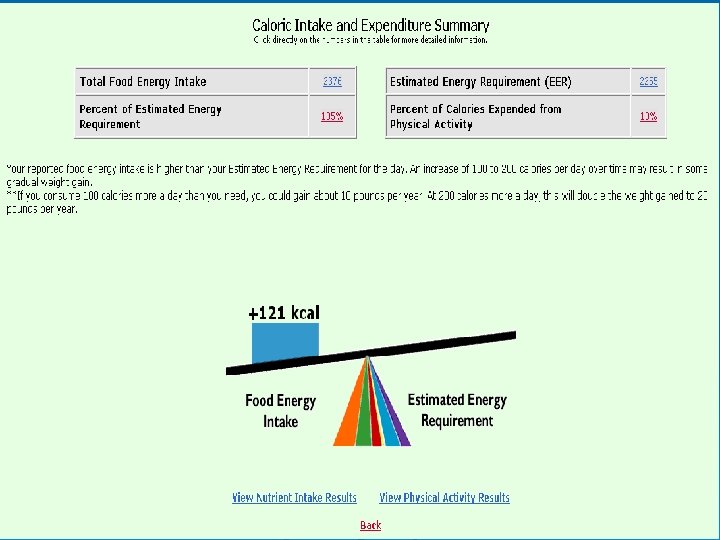
Dietary Guidelines Weight Management Ø 2005 Ø Balance calories from food and beverages w/ calories expended. Ø Follow USDA Food Guide for appropriate calorie requirements based on age and physical activity levels.
Dietary Guidelines Adequate Nutrients Ø Consume a variety of nutrient dense foods and beverages. Follow a balanced eating pattern such as USDA Food Guide or DASH eating plan
The DASH Diet for Control of High Blood Pressure Food group Daily Servings Nutritional Benefit Low-fat or fat-free dairy 2 -3 Calcium, potassium, magnesium and protein Vegetables 4 -5 Potassium, magnesium and fiber Fruits 4 -5 Potassium, magnesium and fiber Grains and grain products 7 -8 Carbohydrates and fiber Meat, Poultry and fish 2 or fewer Protein and magnesium Nuts, seeds and beans 4 -5 per week Magnesium, potassium, protein and fiber Fats and oils** 2 -3 Sweets 5 per week This applies to added fat; all other food choices should be low-fat Make these treats low-fat whenever possible
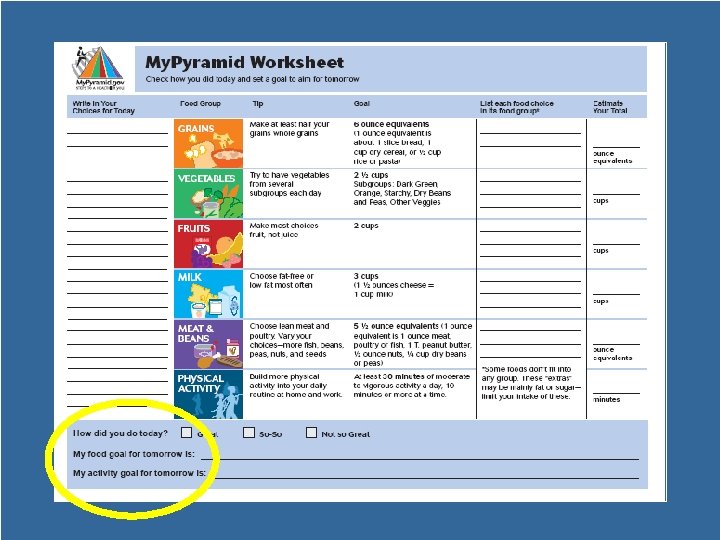
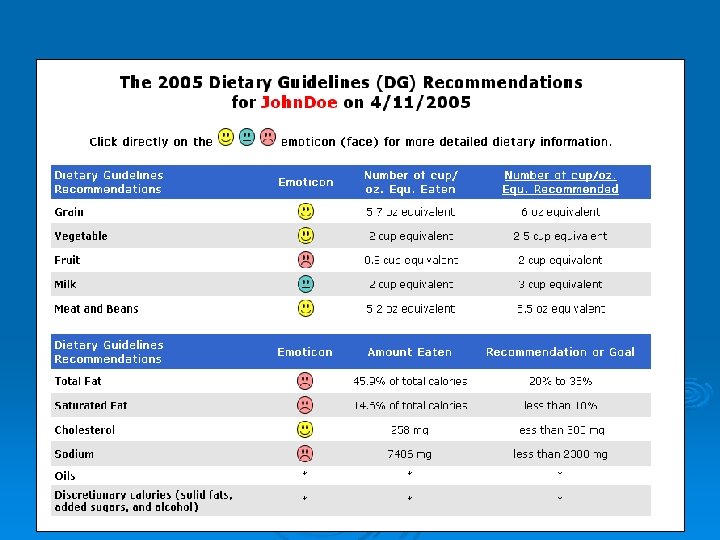
Dietary Guidelines Food Group to Encourage 2 cups fruit Ø 2 ½ veggies, Consume enough fruits and veggies while staying w/i energy needs. Ø At least ½ of grains should be whole grain at least 3 oz. Ø 3 cups of milk fat-free, low-fat or equivalent. Ø
Dietary Guidelines Fat Ø Keep total fat between 20 – 35 % of calories w/ most fats coming from polyunsaturated and monounsaturated fats.
Dietary Guidelines Salt Ø Consume < 2, 300 mg include potassium- rich foods such as fruits and vegetables.
Dietary Guidelines Sugar Ø Choose and prepare food with little added sugar or caloric sweeteners
Dietary Guidelines Physical Activity Ø Engage in activity, 30 minutes a day on most days of the week. To manage weight, engage in activity 60 minutes a day on most days of the week of moderate or vigorous activity w/o exceeding calorie intake requirements
Dietary Guidelines Food Safety Clean hands, surfaces and produce. Meat and poultry should not be washed or rinsed Ø Avoided raw unpasteurized milk or products made from unpasteurized milk, raw or partially raw cooked eggs or food containing raw or undercooked eggs, meat, poultry, unpasteurized juices or raw sprouts. Ø
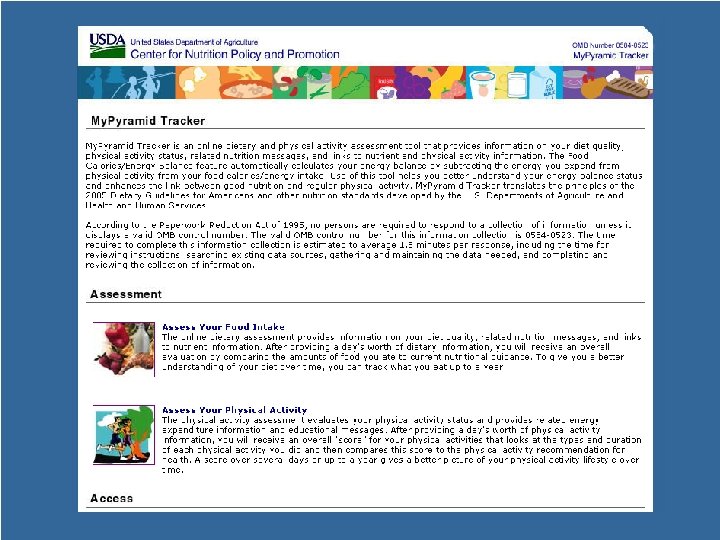
--2005 -My. Pyramid
Reasons for Revising— Updating the Science Ø To ensure that the guidance reflects the latest nutrition science l New nutrient standards—DRI l New Dietary Guidelines l Food consumption and composition data
Developing Food Intake Patterns Determine calorie needs 2. Set nutrient goals 3. Calculate nutrient profiles for each food group, based on • Nutrient content of foods in group • Food consumption 4. Construct food patterns that meet goals 1.
Determine Calorie Needs Estimated Energy Requirements* for males *From the National Academy of Sciences, Institute of Medicine Dietary Reference Intakes Macronutrient Report
Construct Food Intake Patterns Ø Ø Establish initial amount from each food group Compare resulting nutrient content to nutritional goals Change amounts from food groups stepwise l Identify groups or subgroups that are the most feasible nutrient sources l Check amounts recommended against typical consumption Remaining calories after nutrient needs were met were identified as “discretionary calories”
Discretionary Calories May be used to: Increase amount of food selected from a food group Ø Consume foods that are not in the lowest fat form—such as 2% milk or medium-fat meat or items that contain added sugars Ø Add oil, fat, or sugar to foods Ø Consume alcohol (for those who consume alcohol) Ø
Daily Amounts in cups or ounces
Implementation is the challenge ahead. Ø Health/education professionals are vital for success. Ø It will be an ongoing process. Ø Working together, we can help Americans to be healthier. Ø
Convenience Foods What are convenience foods?
Convenience Foods
Convenience Foods Ø What is a convenience food? l Pre- packed frozen entrées l TV dinners l Boxed meals, add meat l Fast Foods – Drive Thru l Carry out l Order & Pick up
Convenience Foods Ø Cons l l 2 x’s more sodium than if food was made from scratch Less nutritionally beneficial ingredients (added sugars and preservatives)
Convenience Foods Ø Pros l l l Allow for quality “family” time for working parents Variety Ease & quick to prepare
Increased Access to Fast Food Ø Ø Ø Ø Fast food, late 1930’s w/ Carl’s, Mc. Donald’s and Burger King 1940’s Wendy’s, KFC, Taco Bell, etc Easy to find Easy for working parents to depend on Fast food, obesity has been on the rise 65% of fast food business is drive-through “For every 6 seconds saved at the drive through, sales increase by 1 %. ” Per Mc. D’s Jack Greenberg
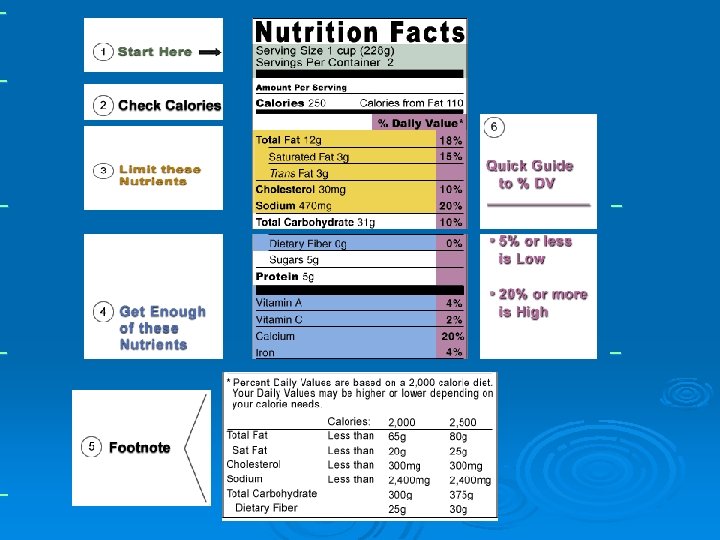
Required on all Labels Name Ø Net weight or net contents Ø Artificial coloring, flavoring, preservatives Ø Name & address of production Ø style/product description Ø Special info affecting those with health problems Ø List of ingredients – most to least Ø
Notes to know Ø Ingredients largest to smallest Ø % of daily value based on 2000 calorie diet (indicated in one serving) Ø Total sodium intake < 2300 mg per day Ø Nutritional facts required when claims made
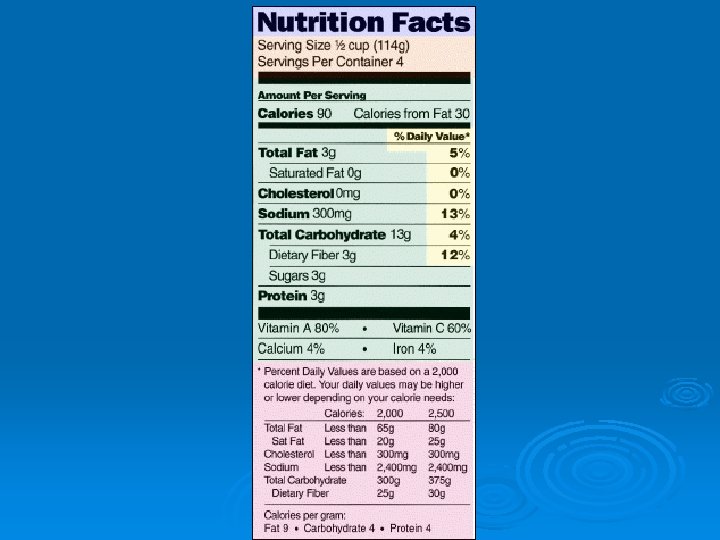
Label Conformity Ø Serving or portion sizes Ø Servings or portions per container Ø Calories from fat per serving Ø % DV – fat, cholesterol, sodium, total carbohydrate Ø % Vit A, C, calcium & iron Ø % DV based on a 2, 000 or 2, 500 cal diet
Labels & Nutritional claims Low in – can be eaten frequently w/o exceeding recommended amount Ø Cal – 40 or less Ø Fat – 3 g or less Ø Sat fat – < 1 g Ø Cholesterol - <20 mg Ø Sodium - <140 mg Ø Reduced, less, or fewer - > 25% less of something than a comparison food Ø Light – reduced by > 1/3 regular product Ø Good source of – 1019% DV for a nutrient Ø High source of fiber - > 20% DV fiber Ø
Label-Ease Step 1 Make a fist Ø Raise one finger for each nutrient - Calcium Fiber Protein Iron Vitamin A Vitamin C that has 10% or more listed for % DV Ø
Label-Ease Step 2 Ø Fingers from step one should be up Ø Choose to focus on fat grams or calories Ø For fat, put one finger down if % DV is > 10% Ø For calories, put one finger down if total calories > 200 per serving
Label-Ease Score Nutrient-plus food – at least one finger remaining Ø Nutrient-minus food – no fingers up Ø
Serving Size 1 bar (43 g) Amount Per Serving %DV * Total Calories 230 Calories from Fat 120 Total Fat 13 g 20% Saturated Fat 9 g 45% Trans Fat 0 g Cholesterol 10 mg 3% Sodium 40 mg 2% Total Carbohydrate 25 g 8% Dietary Fiber 1 g 4% Sugars 22 g Protein 3 g </TD Vitamin A 0% Vitamin C 0% Calcium 8% Iron 2%
Porti n Dist rtion o o “Bigger is Better” Ø Need to get your money’s worth when eating out Ø Ø Example l l Serving of juice = 4 oz. Bottles in a vending machine = 16 oz. • 4 servings in one bottle – consumed in one seating
Bagel Ø 20 Years Ago l l 3 inch diameter 140 calories Ø Today l 6 inch diameter l 350 calories
Cheeseburger Ø 20 Years Ago l 333 calories Ø Today l 590 calories
Check this out 7 Ways to Help Cure Portion distortion 1. 2. 3. 4. 5. 6. 7. Eat portions the size of a small fist Watch out for inflation Snack before dinner Split the entrée Think small Don’t serve from the table Beware of eating in front of the TV
Liquid Calories Ø Where do they come from? l l l Pop Juice Sports Drinks Fruit Drinks Sweetened teas * All calories count!
Orange Juice Ø 4 oz. serving l 60 calories Ø 16 oz bottle l 240 calories
The average high student will drink the equivalent of 4 cans of pop in a day Can of pop = 150 calories x 4 cans a day 600 additional calories x 7 days week 4, 200 additional calories
The average high student will drink the equivalent of 4 cans of pop in a day Can of pop = 150 calories x 4 cans a day 600 additional calories x 7 a week 4, 200 additional calories x 52 weeks in a year ?
The average high student will drink the equivalent of 28 cans of pop in a week 4, 200 calories a week
The year total is 218, 400 calories = 62. 4 lbs a year
3, 500 calories to gain a 1 pound
4 Common high-risk diagnoses Obesity Ø Diabetes (Type II) Ø High Blood Pressure Ø Hyperlipidemia * A direct correlation to poor diet choices, genetics and environment. Early 90’s patterns of risk factors in children started rising upward. Ø
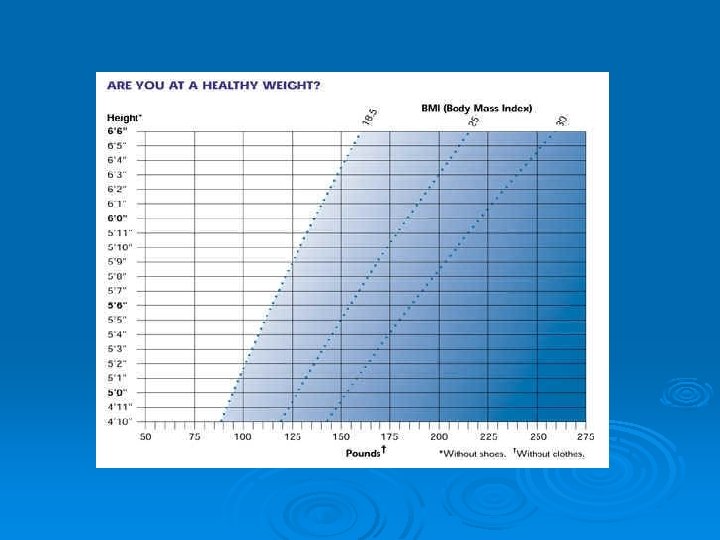
Obesity Ø Ø Ø Ø BMI > 85 to 95 percentile (Adult 25 to 30) Begins commonly at 5 – 6 years old Studies show a children who is obese between the ages 10 to 13 has a 80 % chance of being an obese adult 16 to 33 % children are obese in the US 2/3 of adults in the US Obesity is one of the medical conditions that is easy diagnose but difficult to treat $100 billion annually
Diabetes Ø Ø Ø Was the disease of 50 to 60 years old, NOW effects kids as years as 6. Hispanic & African-Americans 2: 1 1: 3 in the US born in 2000 are at risk 5. 9 million unaware 1990 to 1998 - 33% increase
High Blood Pressure 58 million, 6 and older, or 1 in 5 Ø 1/3 are unaware Ø 120/80 is normal for teens & adults Ø Diagnosis is tricky, no outward symptoms. Three reading to make a average base line reading for a child. Ø
Hyperlipidemia Ø Ø Related to food choices, lifestyle, physical inactivity, genetics, and obesity Lead to heart disease HDL levels >/= 35 Triglycerides >/= 150
Tips to eating out Ø Ø Ø Ø Pass on the bread or tortilla chips Hold the cheese and mayo, 100 calories Ask for ½ of the entrée to be boxed to go prior to serving Salad dressing on side, dip each bite Ask for foods to be cooked with less fat Choose meats that are grilled, baked or broiled Avoid cheese or cream sauces Share
Tips for Fast Food Ø Ø Ø Order a kid’s meal Grilled sandwich Skip the cheese and mayo Skip the fries, add fruit or salad Avoid regular soda, fruit punch or lemonade Use salad dressing sparingly – the big packets of dressing is almost 3 servings compared to a bottle used at home
Improving Physical Activity 1 in 3 do not participate n a regular vigorous activity Ø Regular participate drops from 73 % of freshman to 61 % of seniors. Ø ½ not enrolled in PE, 29 % attend daily PE Ø Contributed to the 100 % increase in childhood obesity since 1980 Ø
Manage weight, balance food intake with exercise output
Evaluating Nutrition Information Ø Who said it? Ø Motivation for the individual giving the information Ø What is said?
Sources of Reliable Nutrition Education Ø Reputable Scientific Journals Ø Reputable Scientific Organizations Ø Research/Public Information Agencies Ø Government Agencies Ø Registered Dieticians Ø People with advanced degrees in HUMAN NUTRITION from a reputable university
Serving Size Quiz What does a serving size look like?
QUIZ: What Makes a Serving? A huge bag of Ruffles is helping you get through your science homework. You polish off about ½ a bag or 50 chips. How many servings of chips have you just eaten? A. 1 B. 2 1/2 C. 5
The Answer: C Ø An official serving of Ruffles is one ounce, which is about 10 chips. Half a bag is 5 servings.
QUIZ: What Makes a Serving? One serving of steak is about as big as: A. A deck of cards B. A Howie Day CD with case c. A paperback book Ø
The Answer: A Ø An official serving of steak is three ounces or about as big as a deck of cards. A typical slab you would get at a steak house would be five times that size.
QUIZ: What Makes a Serving? Ø A. B. C. According to the label on a package of Oreos, one serving has 100 calories and five grams of fat. How many cookies are in a serving? 1 2 3
The Answer: B Ø An official serving of Oreos is 2 cookies. But who can stop at just 2?
QUIZ: What Makes a Serving? The label on your favorite brand of ultrasinful ice cream says that one serving has a killer 300 calories and 15 grams of fat. How many scoops are in one serving? A. 3 B. 2 C. 1 Ø
Answer: C Ø One official serving is one scoop, just ½ a cup.
QUIZ: What Makes a Serving? One “official” serving of french fries contains 3 ounces. How many servings are in a Mc. Donald’s Super Size french fries? A. 1 B. 2 C. 3 Ø
Answer: C Ø A Super Size order of french fries contains three official servings, adding up to 540 calories.
QUIZ: What Makes a Serving? Ø A. B. C. A 7 -Eleven Double Gulp contains how many servings of soda? 2 4 8
Answer: C Ø A Double Gulp has eight servings, more than enough to quench the thirst of a large family. A can of soda contains 1 ½ servings.
Be physically active each day
ØTHE END