Tracing sources of agricultural N using isotopic techniques


 provide a brief introduction to isotope fundamentals. 2) review the")


 value = Ratio sample - Ratio standard x 1000")
 value = Ratio sample - Ratio standard x 1000")


 can")


: Revisited Kohl et al. (1971) Science, 174: 1331 -34. Hauck")

 made 5 main points: 1. Analytical precision")


 Me Vegetarians (Brazil)")

")


 P is an essential")


 There has been a lot of progress with isotope characterization and tracing")
 To tell us things about water")


- Slides: 62
Tracing sources of agricultural N using isotopic techniques: the state of the science Carol Kendall USGS, WRD-National Research Program Menlo Park, CA (650 -329 -4576; ckendall@usgs. gov) December 2004
My job description is “to develop new methods, new concepts, and new applications of environmental isotopes to solve problems of national importance. ” I head a large project that uses our C-H-N-O-S-Cl-Br stable isotope capabilities, and our tritium and S-35 radio-isotopes capacilities, to study watersheds at scales ranging from small pristine watersheds in the Rockies, to large wetlands like the Everglades, to large basins like the Mississippi and San Joaquin River basins.
This presentation will: 1) provide a brief introduction to isotope fundamentals. 2) review the basis of the original vivid debate about the use of nitrate isotopes to determine sources in agricultural basins. 3) discuss how several new isotope tools can better provide critical information about sources of nutrients and associated organic matter, and 4) show examples of the usefulness of these new multitracer approaches for quantifying nitrate and other agricultural products derived from different land uses.
Isotope hydrology/geochemistry textbook: Clark, I. and Fritz, P. 1997. Environmental Isotopes in Hydrogeology. Lewis Publisher (http: //www. science. uottawa. ca/~eih/) Streams/rivers/small watersheds: Kendall, C. and Mc. Donnell, J. J. (eds. ), 1998. Isotope Tracers in Catchment Hydrology. Elsevier (http: //wwwrcamnl. wr. usgs. gov/isoig/is opubs/itchinfo. html) Groundwater: Cook, P. and Herczeg, A. L. (eds. ), 2000. Environmental Tracers in Subsurface Hydrology, Kluwer Academic Publishers.
What are isotopes? Isotopes are part of an element that have different numbers of neutrons (but all the isotopes of an element have the same number of electrons and protons). Example: The element N has 7 electrons and 7 protons. Different isotopes of N can have various numbers of neutrons. The two stable isotopes have 7 and 8 neutrons, respectively (14 N, 15 N). What are stable isotopes? Stable isotopes are ones that are NOT radioactive.
Basic principles behind the use of nutrient isotopes as tracers of sources and sinks: 1) Many different sources of nutrients have distinctive isotope ratios. 2) Many different processes (e. g. , denitrification, nitrification) change the isotope ratios of the reactants and products such that the existence and extent of that specific process can be identified by measurement of the isotope ratios of the product and/or residual reactant. 3) In other words, different sources of nitrate and organic matter often have distinctive isotope “fingerprints” that can provide a better understanding of the system than just using mass balance “black box models”.
Isotope Nomenclature Delta ( ) value = Ratio sample - Ratio standard x 1000 Where Ratio is the ratio of 2 isotopes of an element, such as 15 N/14 N for nitrogen, for a sample or a standard. …in other words…… A DELTA 15 -N = +10 ‰ means there is 10 parts per thousand (or permil) more 15 -N in the sample than in the standard. A DELTA 15 -N = -10 ‰ means there is 10 parts per thousand (or permil) less 15 -N in the sample than in the standard.
Isotope Nomenclature Delta ( ) value = Ratio sample - Ratio standard x 1000 The standard for N isotopes is Air – which is defined as 0. Other standards include: the ocean (for water δ 18 O/ δ 2 H, and ocean carbonate (for δ 13 C).
People usually find the negative values a bit confusing, but they are just a product of what material was chosen as the standard. Example: For N, the ratio of 15 N/14 N in Air is about 1/250. If a sample has 1% more 15 N than Air (=1/250), its ratio would be: 1. 01/250. This 1% corresponds to +10‰. If a sample has 1% less 15 N than Air -- (= 0. 99/250), this is -10‰.
How isotopes are used to trace sources of nitrate: There are 2 stable nitrogen isotopes (15 N, 14 N). Ratios of 15 N/14 N are reported as 15 N. (“ values”, in units of permil = ppt = ‰). There are 3 stable oxygen isotopes (18 O, 17 O, 16 O). Ratios of 18 O/16 O are reported as 18 O. Ratios of 17 O/16 O are reported as 17 O. Therefore, if different sources of nitrate have different 15 N, 18 O, or 17 O values, we can sometimes determine how much nitrate comes from the different sources.
Fretwell’s Law “Warning! Stable isotope data may cause severe and contagious stomach upset if taken alone. To prevent upsetting reviewers’ stomachs and your own, take stable isotope data with a healthy dose of other hydrologic, geologic, and geochemical information. Then, you will find stable isotope data very beneficial. ” (Marvin O. Fretwell, USGS, pers. comm. 1983)
Commonly Used Terms: heavy vs. light isotopes the “heavy” isotope is the one with more neutrons; it is also generally the less abundant isotope. enriched vs. depleted remember to state what isotope is in short supply: does “enriched sulfate” mean that: the sulfate is enriched in heavy sulfur OR the sulfate is enriched in light sulfur? positive vs. negative -10 ‰ is more positive than -20 ‰.
Isotopic Fractionation (the changes in the isotopic compositions of materials because of processes) can make different sources more distinctive or blur differences between sources. v During biological processes (e. g. , assimilation, nitrification, denitrification), the lighter isotope (14 N) ends up being concentrated in the products while the heavier isotope (15 N) ends up being concentrated in the residual reactants. Hence, during the reaction NO 3 N 2, the resulting N 2 has a lower 15 N than the residual NO 3. v Biological fractionations can make it very difficult to identify sources and quantify mixing proportions.
Schematic showing how denitrification can increase the 15 N value of residual NO 3 derived from fertilizer, causing problems for interpretations of sources of N Cannot easily distinguish between: (1) a manure source and (2) a fertilizer source that has denitrified to have the same 15 N as manure. NO 3 15 N Solution: use a multi-isotope approach
Another example of fractionation – but in this case, it is useful and provides a way of tracing sources of NH 4 : Ø The 15 N of NH 4 derived from volatilization of NH 3 from animal waste lagoons is very low compared to the 15 N of other N sources. Ø Nitrification of NH 4 produces NO 3 with a 15 N that is only about 0 to 2‰ higher than the 15 N of the NH 4 (if most of the NH 4 is nitrified). Ø Contributions of atmospheric N from NH 3 emissions, or leakage of lagoon waste into groundwater or streams. can often be readily quantified using 15 N. Volatilization of NH 3 Hog Waste in Lagoon Mature Lagoon Residual waste Lagoon maturation 15 Nhog 15 Nwaste 15 NNH 3 15 NNH 4 +3‰ +2‰ -15 to -25‰ +30‰
While stable isotopes have become common tools for tracing sources of waters and solutes in small watersheds, they are currently under-utilized in larger basins, especially in agricultural and urban rivers. Why is this? Perhaps because one of the first attempts to use natural abundance 15 N to understand the causes of the increases in nitrate concentrations in surface waters in many agricultural areas (Kohl et al. , 1971, Science) elicited a hyper-critical response by 10 prominent soil scientists and agronomists (Hauck et al. , 1972, Science), which concluded that use of 15 N was a “questionable approach. ”
Ranges of soil water 15 N values for different land uses 40 Animal waste Fertilizer Natural Septic 20 average 15 N 30 10 0 -10 (Fogg et al. , 1998) In most instances, nitrate derived from fertilizer (~ 0‰) can be distinguished from nitrate derived from animal and human waste (10 -20‰).
Kohl et al. (1971): Revisited Kohl et al. (1971) Science, 174: 1331 -34. Hauck et al. (1972) Science, 177: 453 -54.
mi Soil N Trends attributed to mixing of NO 3 from nitrification of soil N and fertilizer N xin g 15 NNO 3 drain tiles Fertilizer N lake, rivers, ditch (Kohl et al. , 1971) Average nitrate-N (mg/L) Nitrate samples were collected from drain tile effluent, plus samples from a nearby lake, the Sangamon River, and a drainage ditch. A linear regression through the data intersected the values measured for fertilizer and incubated soils.
The response by Hauck et al. (1972) made 5 main points: 1. Analytical precision of natural abundance measurements insufficient for quantifying sources over the small range of differences in 15 N between fertilizer and soil end-members (0. 004 atom % or 10‰). 2. Fertilizer NH 4 mixes with soil N before it is oxidized to NO 3, thus losing it’s identity. 3. Insufficient soil samples were analyzed to assess the true variability in the 15 N of soils within the >900 square mile basin. 4. It is difficult to correct for the biological fractionation effects that cause great variability in 15 N in soils. 5. The 15 N of NO 3 produced by nitrification of soil organic N is best determined by short-term incubations of soil, not the long-term incubations performed by Kohl et al. Response by Kohl et al. (1972) considered but ultimately dismissed most of the criticisms, saying that despite all the possible confounding complications, the surface water sample data themselves strongly supported their interpretation of mixing of soil and fertilizer NO 3, and that their evaluation method probably under-estimated the true proportion of fertilizer-derived NO 3.
Trends attributed to mixing of NO 3 from nitrification of soil N and fertilizer N can also be explained by denitrification (or assimilatory fractionation) with an enrichment factor of ~5 ‰) Question: How do we better distinguish mixing from denitrification? Answer: Use a multi-tracer approach.
The response to this controversy was that the natural abundance approach for estimating the contributions of fertilizer-derived NO 3 in surface waters was essentially abandoned in the USA for ~ 20 years, and efforts were concentrated on studying N transformations. Interestingly, there were many studies in the 1970 s and 1980 s that estimated contributions of different N sources in groundwater that did not elicit the same kind of negative response. In the late 1980 s and 1990 s, a number of new approaches for studying the impact of agricultural sources of N on groundwater and surface water were developed. Most are based on using a multi-isotope and/or multi-tracer approach to resolving N source vs cycling questions. The result has been several dozen studies tracing sources of N and investigating N transformations in agricultural, urban, and forested watersheds, ranging from small to very large basins.
A MULTIISOTOPE APPROACH Ranges of δ 18 O and δ 15 N values of nitrate from different sources
Analysis of the 15 N of N 2 and NO 3, combined with water age-dating techniques, explains why: (1) different streams in an agricultural watershed in MD have different NO 3 concentrations, and (2) determines how long it will take for natural remediation processes to remove the fertilizer NO 3 from groundwater. Modified from Bohlke and Denver (1995).
Current Isotopic Tools for Nutrient Studies • Nitrate: analyzed for N and O (and sometimes for O). 15 18 17 • POM (particulate organic matter): filtered, acidified, and analyzed for and C (and sometimes for S). • Water: analyzed for O and H. • DIC (dissolved inorganic carbon): analyzed for C. • DOC (dissolved organic carbon): analyzed for C. • DON (dissolved organic nitrogen): analyzed for N. • Ammonium: analyzed for N. • Phosphate: analyzed for O. • Sulfate: analyzed for S (and sometimes for O and O). • O (DO = dissolved oxygen): analyzed for O. 13 34 18 2 13 13 15 15 18 34 2 18 17 18 Some even newer tools: B, Li, Sr, U isotopes 15 N
NEXT: A brief review of several potential applications of isotopes to tracing agricultural pollution (and solving agricultural problems) – with my opinions about whether the applications are: Ø easily usable tools (i. e. , “ready for prime time”), or that they still need more research; Ø under what conditions do the tools work best, Ø what additional isotope and chemical tracers appear to be beneficial for the application, and Ø selected examples. Ø For more information, see my poster and the handout.
Fertilizer vs animal waste source of nitrate: nitrate- 15 N Tool usually works. 40 Animal waste Fertilizer Natural Septic 15 N 30 20 10 0 -10 (Fogg et al. , 1998)
Fertilizer vs animal waste source of nitrate: nitrate- 15 N Tool often works. But it is more costly if the soils are clayey or the groundwater is not well-oxygenated, so that significant denitrification is suspected. In this case, quantification can be successful if … the effects of denitrification can be estimated using: Ø analysis of dissolved N 2 for 15 N (to correct for the N 2 produced by denitrification), Ø nitrate-δ 18 O (this tracer usually is not as useful for this purpose as N 2 - 15 N); and Ø geochemical modeling using chemical data and perhaps DIC- 13 C, SO 4 - 34 S, 87 Sr/86 Sr, etc. Ø use of all 3 methods, along with age-dating of the water using CFCs or 3 He/T, will improve quantification of source contributions.
What about use in rivers, streams, and wetlands?
Fertilizer vs animal waste source of nitrate: nitrate- 15 N Tool often works. But may require a fair amount of biogeochemical and hydrologic data. This can provide semi-quantitative to quantitative estimates of contributions in streams and rivers if: Ø denitrification in the riparian zone and/or hyporheic zone can be ruled out or quantified, Ø nitrate from soil organic matter is insignificant (or its 15 N is similar to fertilizer), Ø uptake of nitrate by phytoplankton is minimal (or data are adjusted for this fractionation), Ø nitrification in the stream is minimal (or data are adjusted for this fractionation).
or … use other chemical and/or isotopic tracers (e. g. , nitrate-δ 18 O or POM- 15 N/ 13 C/ 34 S) in addition to nitrate- 15 N.
The N isotope fractionation between NO 3 and POM is dependent on NO 3 concentration, and varies from ~ 0 ‰ in the Bay when NO 3 is low, to ~ 4 ‰ in the SJR and Delta when NO 3 is high. San Francisco Ecosystem Restoration Program 4 3 POM 15 N nitrate 2 15 N 1 [NO 3] NO 3 -N (mg/L) Transect in October 2002 downstream The data are consistent with algae mainly growing in the SJR in contact with the observed nitrate
Positive correlation of 15 N and land use in major river basins in NE USA from Mayer et al. (2002)
Soil vs animal waste source of nitrate: nitrate- 15 N Tool often works. 40 Animal waste Fertilizer Natural Septic 15 N 30 20 10 0 -10 (Fogg et al. , 1998) But…
Soil vs animal waste source of nitrate: nitrate- 15 N Tool often works… But sometimes does not work because soil nitrates are often quite variable in 15 N and sometimes overlap the 15 N values of animal manure. More likely to work with pigs than other animals because pig waste from lagoons usually has a much higher nitrate- 15 N. Quantification using only nitrate- 15 N can be successful if: Ø the groundwater is well-oxygenated, the soils are sandy instead of clayey, so denitrification can be ruled out, Ø nitrate from soil organic matter is insignificant (or its 15 N is similar to fertilizer), Ø the fertilizer is nitrate, ammonium, or urea (not manure or green manure), and Ø nitrates from representative source areas (under the fields, feedlots, manure lagoons, septic fields, etc) are analyzed to insure that the nitrate- 15 N values of possible sources are a few ‰ different.
Soil vs animal waste source of nitrate: nitrate- 15 N Tool often works. Do you need nitrate-δ 18 O? No … but it probably would help improve the quantification if there is some difference in Ø the water-δ 18 O of soil water vs groundwater or lagoon water, or Ø in the O 2 -δ 18 O in the soil zone or groundwater; Ø these instances are not uncommon). Therefore, obtaining nitrate-δ 18 O is recommended.
Surface water nitrate in the Mississippi River Basin has higher 18 O and lower 15 N values than nitrate in the San Joaquin Basin Mississippi River Basin (Chang et al. , 2002) San Joaquin River Basin (Kratzer et al. , 2003) NE USA rivers, (Mayer et al. , 2002) tion ifica r t i n e d atmospheric nitrate appears to be a significant source in urban and forested catchments, for small and large watersheds
Septic waste vs animal manure: nitrate- 15 N Tool usually does NOT work using only nitrate- 15 N. (because the nitrate- 15 N values are usually overlapping). But…
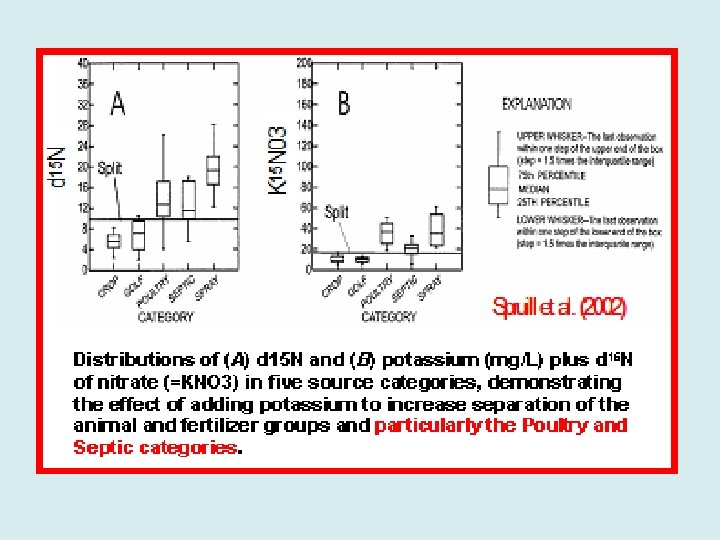
Septic waste vs animal manure: nitrate- 15 N Tool usually does NOT work using only nitrate- 15 N. (because the nitrate- 15 N values are usually overlapping). However, these types of waste can sometimes be distinguished if: Ø the average diets of the humans and animals are at different trophic levels, Ø nitrate-δ 18 O values of the wastes are different, Ø other isotope tracers that are specific for the different sources are used (B, Sr, S, C, Li, U), Ø other chemical tracers that are specific for the different sources are used (caffeine, pharmaceuticals, K, REEs, heavy metals, etc). See example of usefulness of K for distinguishing septic vs poultry waste…
Isotopic compositions of fingernails as a proxy for diet Omnivores (Brazil) Me Vegetarians (Brazil) Omnivores (USA) Vegetarians (USA) Kendall and Martinelli, unpub. data
Nitrate from waste from different kinds of farm animals: Tool maybe will work. There have been several very recent, very promising studies. Therefore, semi-quantification of contributions of nitrate derived from different kinds of farm animals might be possible if: Ø nitrate- 15 N and nitrate-δ 18 O are not expected to provide clear separations without the combined use of other tracers, Ø other isotope tracers that are specific for the different sources are used (B, Sr, S, C, Li), and/or Ø other chemical tracers that are specific for the different sources are used (caffeine, pharmaceuticals, REEs, heavy metals, etc).
Widory et al. (2004)
Why do different kinds of animal waste-derived nitrate have different B-Li-S-Sr isotopic signatures? Mostly because of different sources of washing materials (for B, S, and maybe Sr) used for people vs AFOs (that result in differences in septic waste/WWTPs vs waste lagoons/spraying.
Nitrate from waste from different kinds of farm animals: Tool maybe will work. There have been several very recent, very promising studies. However, we need several more demonstration studies using a multi-isotope, multi-tracer, approach to see what kinds of tracers are most useful for what kinds of animals, under what kinds of conditions.
Ammonia from animal emissions vs other sources: Tool not ready for general use (needs further study). Quantification of ammonia from AFOs vs other sources (car exhaust, power plant exhaust, fertilizer volatilization) might be successful if: Ø there is a lot of volatilization of NH 3 from the waste (like hog lagoons), resulting in downwind ammonium- 15 N values that are very low. Ø the other sources of ammonium have 15 N values that are significantly higher, and Ø the sources show relatively little temporal and spatial variability relative to the difference between the mean 15 N values.
Phosphate from fertilizer vs animal waste/septic waste vs soil organic matter: phosphate-δ 18 O: Tool maybe ready for use (needs further study). There have been a few recent and very promising studies of phosphate sources using various isotope tracers. U isotopes: Uranium is a trace constituent of geologic sources of phosphate. Hence, analysis of 234 U and 238 U can distinguish between “natural” and “geologic” sources. Sr isotopes: Strontium is a trace constituent of geologic sources of phosphate. Different sources of geologic phosphate (phosphorites vs carbonatites) appear to have different concentrations of trace metals and REEs; hence, these can be used as tracers of phosphate and/or fertilizer source. All of these isotope tracers will provide more quantitative information if they are combined with other isotope and chemical tracers.
New isotope tool: the 18 O of phosphate (PO 4) P is an essential nutrient influencing primary productivity, and is therefore an important factor in the cycling of C, N, and S in aquatic systems. P has only 1 stable isotope so it cannot be used as a natural isotopic tracer. However, the O atoms bound to the P are potentially useful tracers of P sources and sinks. Main water management applications: § Quantify mixing of terrestrial vs marine sources. § Identification of point sources of P from waste-water treatment plants and fertilizer.
Organic matter from animal waste vs human waste: Tool often works. Quantification of waste from human vs animals can be successful if: Ø analyzed for 15 N and/or 13 C of the organic matter (both are best), Ø the average diets of the humans and animals are at different trophic levels (i. e. , one group is herbivorous), and/or Ø one group eats a diet primarily composed of C 3 plants (typical human diet in Asia, but not in Brazil; diets in the USA are intermediate), and the other eats a diet primarily composed of C 4 plants (corn and sugar cane are the main C 4 crops); Ø other isotope tracers that are specific for the different sources are used (B, Sr, S, C, Li, U), Ø other chemical tracers that are specific for the different sources are used (caffeine, pharmaceuticals, K, REEs, heavy metals, etc).
Organic matter from animal/human waste vs natural organic matter Tool often works. Quantification can be successful if: Ø analyzed for 15 N and/or 13 C of the organic matter (both are best), Ø the average diets of the humans/animals is partially carnivorous), Ø the humans/animals eats a diet primarily composed of C 3 plants when the natural organic matter is largely C 4 (corn) or marine, Ø 34 S can also be useful for differentiating sources, especially when one source is marine (e. g. , contamination of coastal waters with WWTP or AFO waste). Ø other isotope tracers that are specific for the different sources are used (B, Sr, S, C, Li, U), Ø other chemical tracers that are specific for the different sources are used (caffeine, pharmaceuticals, K, REEs, heavy metals, etc).
Quantification of sewage contributions to coastal sediments
Seasonal changes in the 15 N, 13 C, and C: N of POM 13 C C: N 15 N discharge Most of the variability is caused by seasonal shifts in the isotopic composition of algae caused by seasonal changes in biogeochemical processes and the sources of dissolved C and N
Other useful tools for agricultural studies: Sulfur isotopes: Analysis of sulfate for 34 S and δ 18 O, or organic matter for 34 S, can provide information about fertilizer and waste sources. Water isotopes: Analysis of the water for δ 18 O and δ 2 H (these are almost perfect tracers of the water itself) can provide extremely useful information about the sources of the nitrate and other solutes in the water. Age-dating nitrate contamination of groundwater: One powerful potential application of technological advances in the age-dating of young groundwater is to evaluate the impact of changes in agricultural management practices on water quality. Examples of environmental changes that can be assessed by this method include: changes in the amount and types of fertilizers used, different fertilizer application times, relocation of potential pollutant sources, different remediation strategies, determination of timescales for remediation, and the installation of drainage systems.
Simplified representation of groundwater flow from an upland agricultural recharge area to a riparian wetland. Arrows indicate directions of flow as determined from gradients in hydraulic heads and groundwater ages (ranging from about 0– 50 years). Bohlke (2002)
Other useful tools for agricultural studies: Isotope biomonitoring: analysis of the 15 N of algae, terrestrial plants, and animals as “proxies” for the isotopic compositions of nitrate and/or ammonium – and hence sources and land uses. Statistical, geochemical, and hydrologic modeling: We are past the time when simple bivariate plots and linear regressions are sufficient for interpreting data. Other approaches: EMMA (End Member Mixing Analysis), geochemical reaction path modeling, principal components analysis, and classification trees. Other chemical constituents: pharmaceuticals specific to different animal types, trace elements and REE for tracing fertilizers, and basic chemistry. You can do a lot with just simple Cl concentrations for identifying animal waste contamination of rivers and groundwaters.
Summary: 1) There has been a lot of progress with isotope characterization and tracing of agricultural contaminant sources in the last few years, particularly with regard to distinguishing between different kinds of animals (including humans) with “uncommonly” used isotopes. 2) You should not rely on a single isotope (d 15 N) but instead use a multi-isotope, multi-tracer, approach if you want to answer questions about sources in complicated systems. 3) Use a multiple lines of evidence (and multiple testable hypotheses). 4) And don’t forget that you need to consider the hydrology and basic chemistry of the system – not just isotopes or organics.
Value of isotopes for water resources management 1) To tell us things about water resources that we didn’t know before. 2) To tell us things about water resources that CONTRADICT what we thought we knew before.
Where to get isotope analyses? Ø EPA has several isotope labs. Ø USGS has 3 big stable isotope labs. Ø USDA has several labs. Ø Many universities have isotope labs in various departments. Some of these are mainly research labs, some are mainly service labs, and many do both. You will probably get better quality data if you send samples only to labs where they are using the same methods for their own research.
Lab costs? Isotopes are not very expensive – and they are a LOT cheaper than being wrong! How much do such isotope analyses cost? $10 -$200, depending on manpower requirements and market forces. (I could give some ranges of values). Prices are dropping rapidly (or will!) due to increased automation and new microbial techniques. The best bargain is to interest someone who has an isotope lab – who might add in lots of extra analyses if he/she becomes intrigued or has spare mass spec and/or tech time.
Some good advice: Many of these stable isotope tools archive very well -filtered, preserved, or frozen (depending on type). DIC and DO are the exceptions; they are good for months not years (unless you make special precautions). So collect many more samples that you can afford to analyze, and archive them. Then used an “adaptive management practice” to decide what to analyze first. You might also want to archive samples for possible analysis for metal and semi-metal isotopes. In general, these are filtered thru 0. 2 micron and then acidified – using very pure reagents that don’t contain K or anything that might contribute radiogenic materials.
Proposed sampling scheme for all future river nutrient studies Each time chemistry samples are collected at each site, collect and archive the following samples: 1) Nitrate isotope samples: Collect and archive ~20 ml, filtered (0. 2 um), frozen, water samples. 2) POM isotope samples: Filter ~1 L of water through a flat, pre-combusted, glass fiber filter (0. 7 um), freeze the filters, and archive them. 3) Water isotope samples: Collect and archive 10 -25 ml of water (unfrozen). 4) DOC/DON isotope samples: Collect and archive ~50 ml, filtered (0. 2 um), frozen, water samples. 5) SO 4 isotope samples: Collect, concentrate on resins, and archive. 6) Biota isotope samples: Archive ~1 cc frozen aliquots of biological samples (algae, riparian terrestrial plants, aquatic invertebrates, fish), especially ones collected along river reaches. After chemical data are examined and modeled, these archived samples can be used to test hypotheses with new isotope data.