How To Use Event Tracing For Windows For





- Slides: 45

How To Use Event Tracing For Windows For Performance Analysis

Outline Why use Event Tracing? How to use Event Tracing vs. Perf. Counters What events should be logged An example The kernel logger The Future of ETW

Goals A better understanding Event Tracing for Windows How to use Event Tracing to increase driver quality How to help your customers use your software efficiently

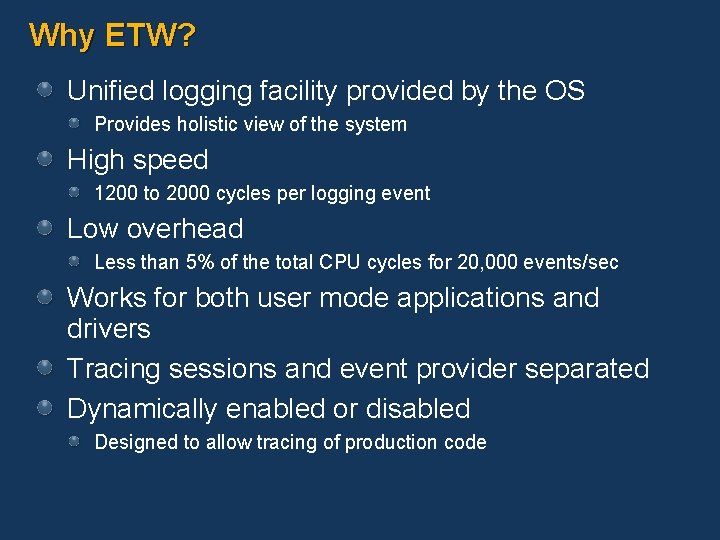
Why ETW? Unified logging facility provided by the OS Provides holistic view of the system High speed 1200 to 2000 cycles per logging event Low overhead Less than 5% of the total CPU cycles for 20, 000 events/sec Works for both user mode applications and drivers Tracing sessions and event provider separated Dynamically enabled or disabled Designed to allow tracing of production code

How Event Tracing Works

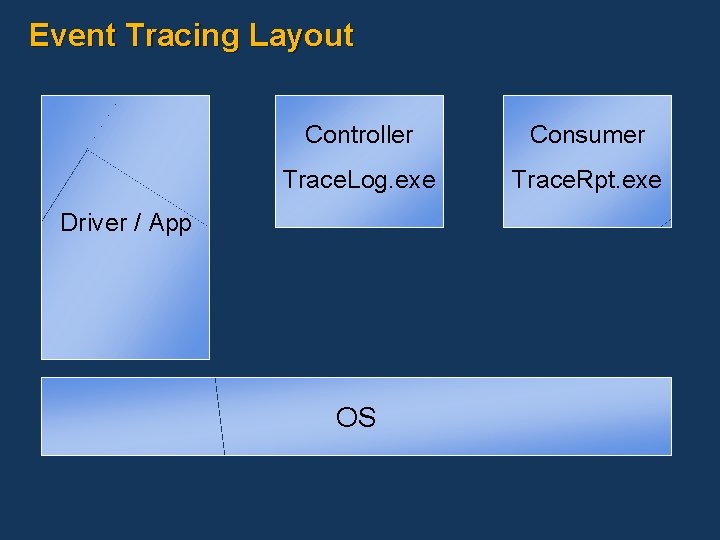
Event Tracing Layout Controller Consumer Trace. Log. exe Trace. Rpt. exe Driver / App OS

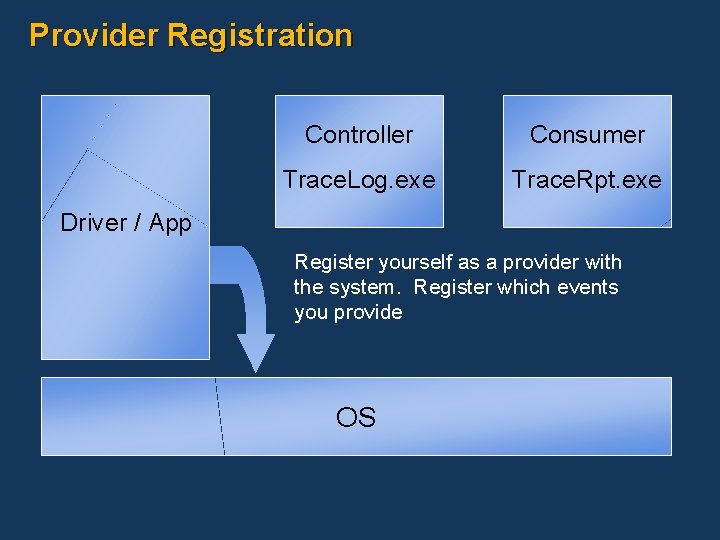
Provider Registration Controller Consumer Trace. Log. exe Trace. Rpt. exe Driver / App Register yourself as a provider with the system. Register which events you provide OS

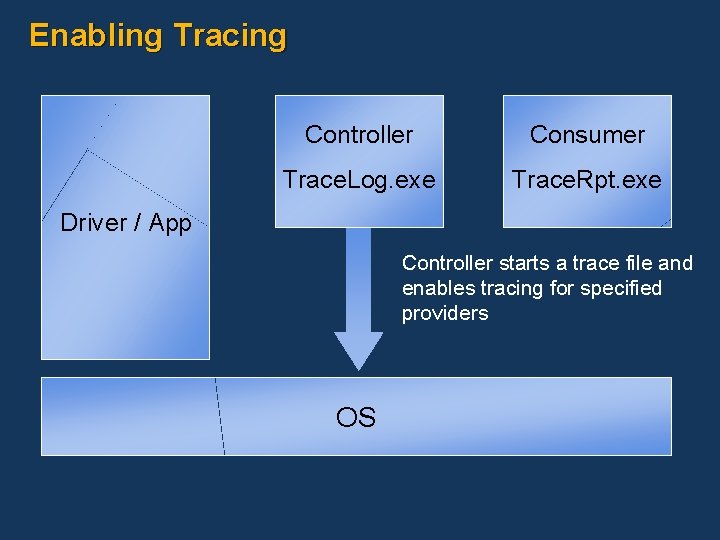
Enabling Tracing Controller Consumer Trace. Log. exe Trace. Rpt. exe Driver / App Controller starts a trace file and enables tracing for specified providers OS

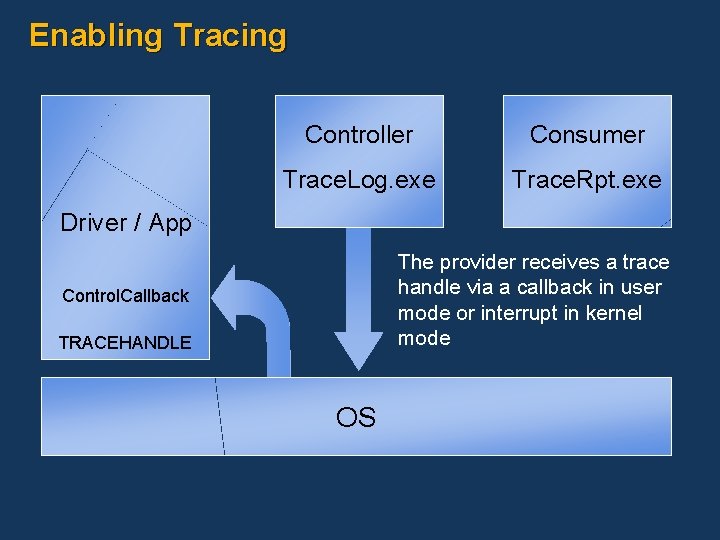
Enabling Tracing Controller Consumer Trace. Log. exe Trace. Rpt. exe Driver / App The provider receives a trace handle via a callback in user mode or interrupt in kernel mode Control. Callback TRACEHANDLE OS

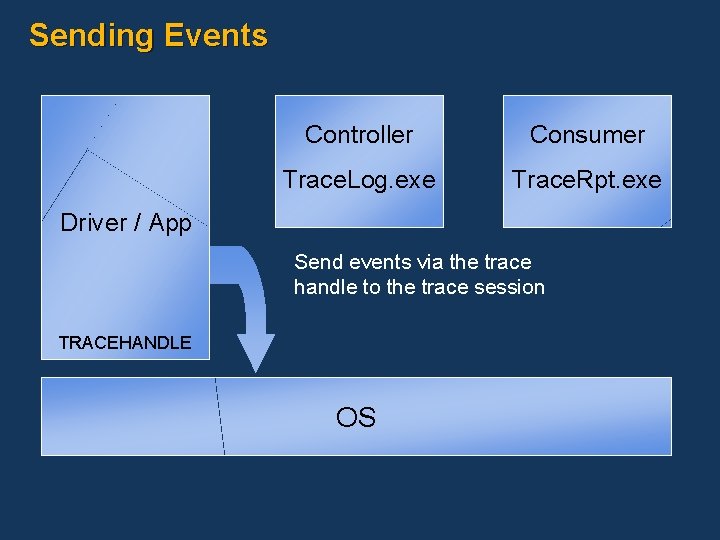
Sending Events Controller Consumer Trace. Log. exe Trace. Rpt. exe Driver / App Send events via the trace handle to the trace session TRACEHANDLE OS

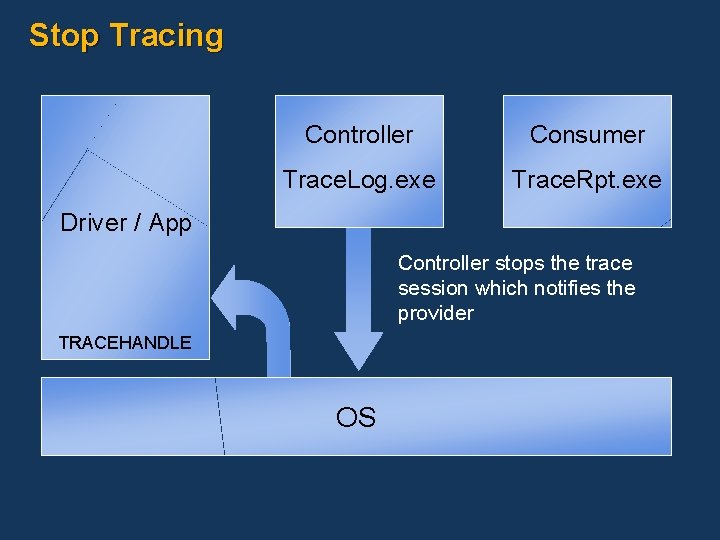
Stop Tracing Controller Consumer Trace. Log. exe Trace. Rpt. exe Driver / App Controller stops the trace session which notifies the provider TRACEHANDLE OS

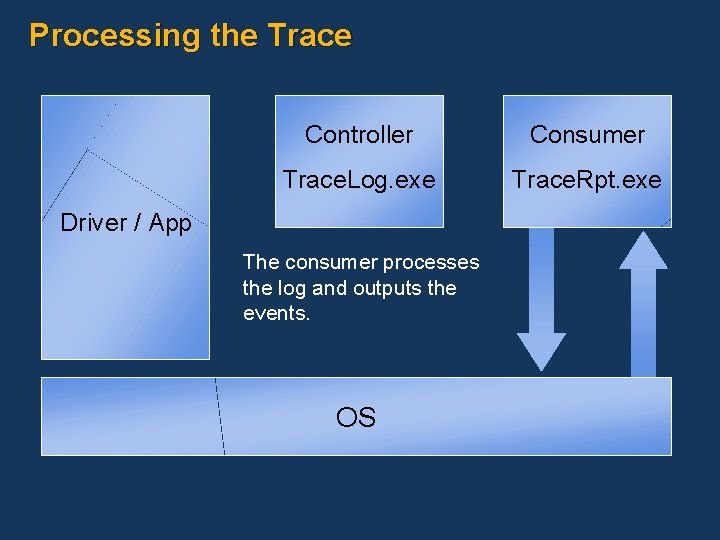
Processing the Trace Controller Consumer Trace. Log. exe Trace. Rpt. exe Driver / App The consumer processes the log and outputs the events. OS

Events vs. Perf. Counters

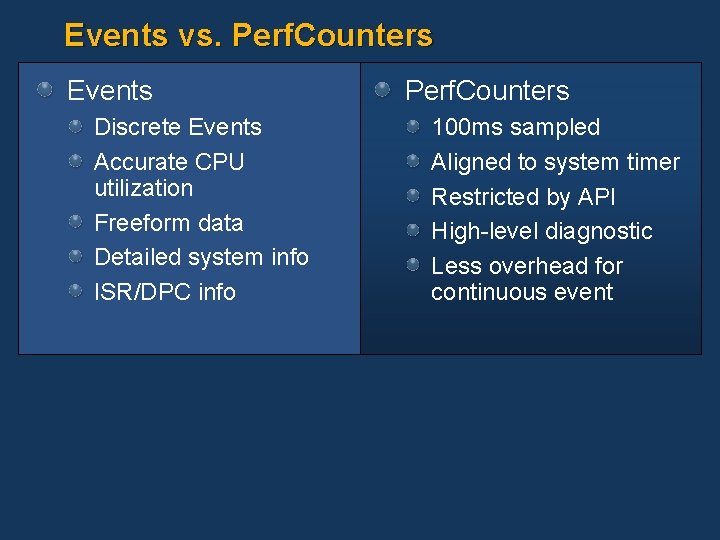
Events vs. Perf. Counters Events Discrete Events Accurate CPU utilization Freeform data Detailed system info ISR/DPC info Perf. Counters 100 ms sampled Aligned to system timer Restricted by API High-level diagnostic Less overhead for continuous event

Logging Events

Logging Events State Changes Begin/End of significant operations Resource creation/deletion Other events related to performance or reliability Debug events

Event Header Layout Event header is required for all ETW events GUID for the Event Class UCHAR for the Event Type USHORT for Version

Flags and Levels Developer-defined values to control event generation of the provider The Provider gets the current flag and level from the Controller Flags are logical groupings of events Levels are gradations of severity Ex Debug events would be high level. Used only in exceptional cases.

An Example ETW Application

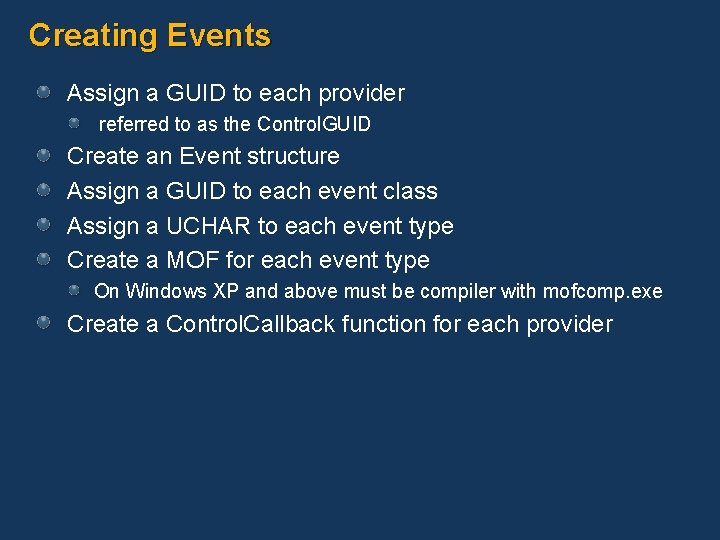
Creating Events Assign a GUID to each provider referred to as the Control. GUID Create an Event structure Assign a GUID to each event class Assign a UCHAR to each event type Create a MOF for each event type On Windows XP and above must be compiler with mofcomp. exe Create a Control. Callback function for each provider

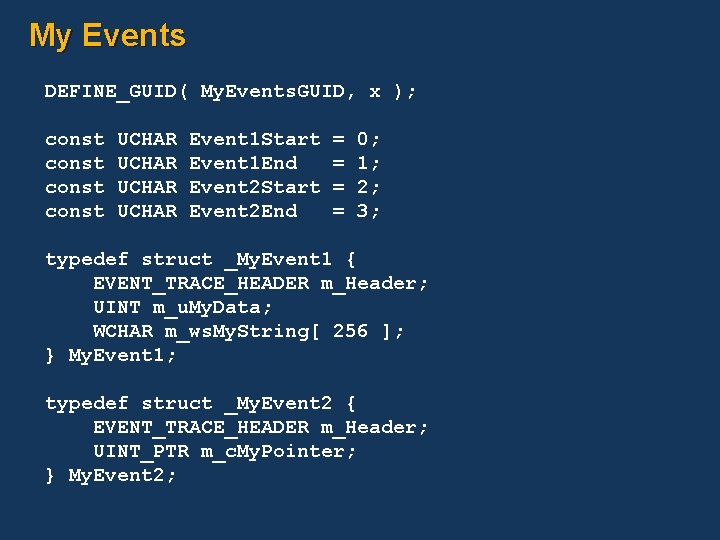
My Events DEFINE_GUID( My. Events. GUID, x ); const UCHAR Event 1 Start Event 1 End Event 2 Start Event 2 End = = 0; 1; 2; 3; typedef struct _My. Event 1 { EVENT_TRACE_HEADER m_Header; UINT m_u. My. Data; WCHAR m_ws. My. String[ 256 ]; } My. Event 1; typedef struct _My. Event 2 { EVENT_TRACE_HEADER m_Header; UINT_PTR m_c. My. Pointer; } My. Event 2;

MOF Description

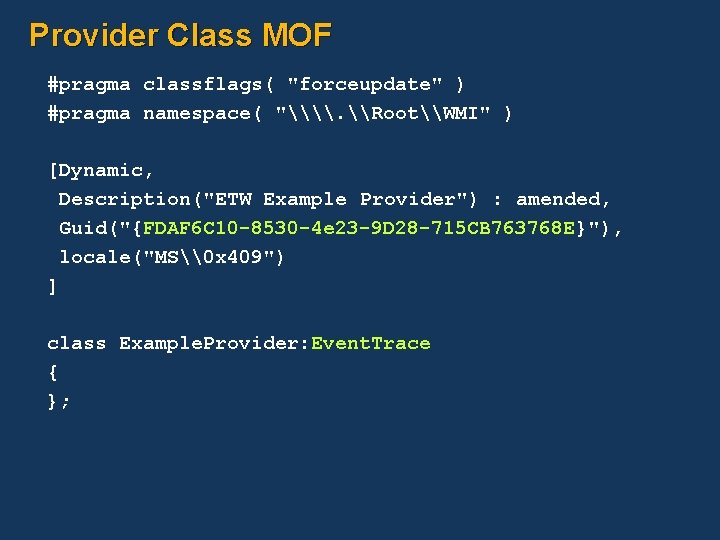
Provider Class MOF #pragma classflags( "forceupdate" ) #pragma namespace( "\\. \Root\WMI" ) [Dynamic, Description("ETW Example Provider") : amended, Guid("{FDAF 6 C 10 -8530 -4 e 23 -9 D 28 -715 CB 763768 E}"), locale("MS\0 x 409") ] class Example. Provider: Event. Trace { };

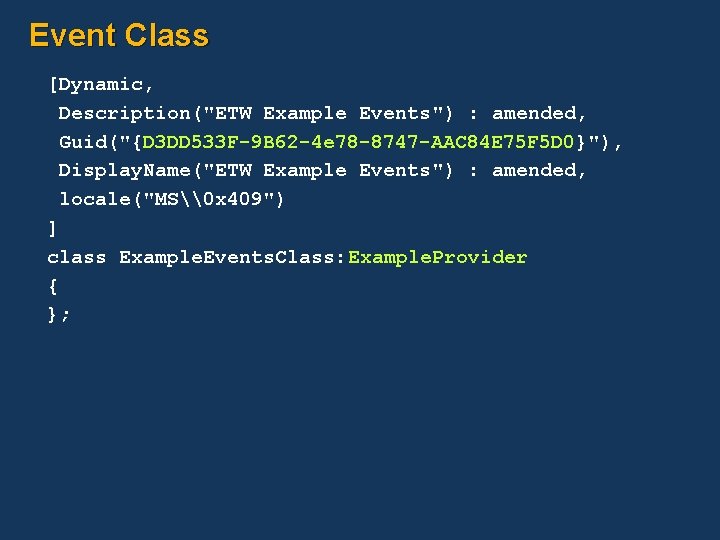
Event Class [Dynamic, Description("ETW Example Events") : amended, Guid("{D 3 DD 533 F-9 B 62 -4 e 78 -8747 -AAC 84 E 75 F 5 D 0}"), Display. Name("ETW Example Events") : amended, locale("MS\0 x 409") ] class Example. Events. Class: Example. Provider { };

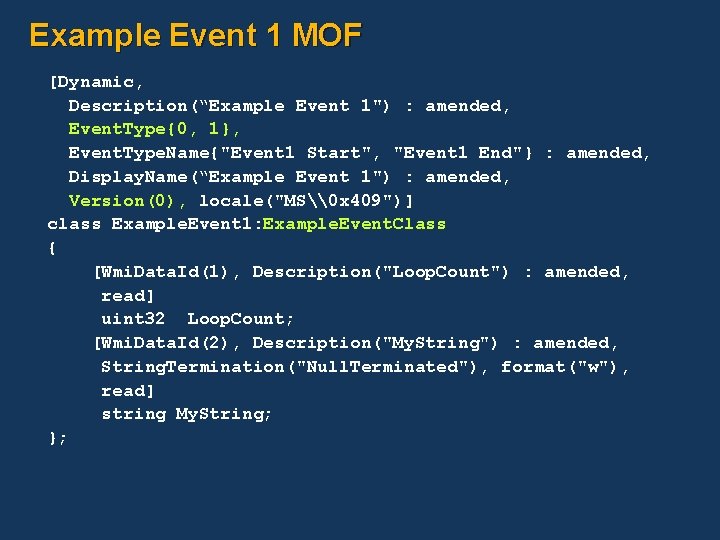
Example Event 1 MOF [Dynamic, Description(“Example Event 1") : amended, Event. Type{0, 1}, Event. Type. Name{"Event 1 Start", "Event 1 End"} : amended, Display. Name(“Example Event 1") : amended, Version(0), locale("MS\0 x 409")] class Example. Event 1: Example. Event. Class { [Wmi. Data. Id(1), Description("Loop. Count") : amended, read] uint 32 Loop. Count; [Wmi. Data. Id(2), Description("My. String") : amended, String. Termination("Null. Terminated"), format("w"), read] string My. String; };

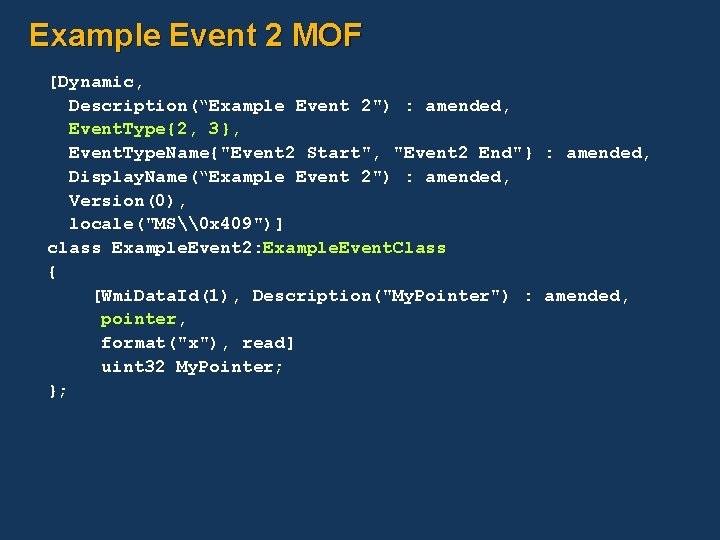
Example Event 2 MOF [Dynamic, Description(“Example Event 2") : amended, Event. Type{2, 3}, Event. Type. Name{"Event 2 Start", "Event 2 End"} : amended, Display. Name(“Example Event 2") : amended, Version(0), locale("MS\0 x 409")] class Example. Event 2: Example. Event. Class { [Wmi. Data. Id(1), Description("My. Pointer") : amended, pointer, format("x"), read] uint 32 My. Pointer; };

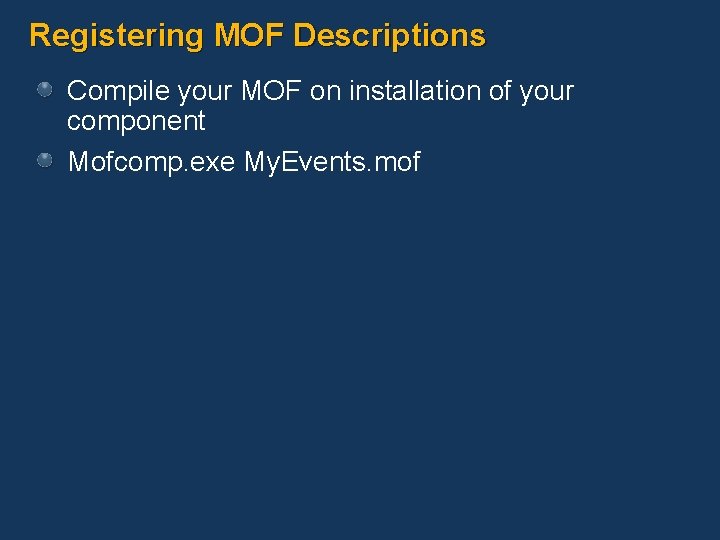
Registering MOF Descriptions Compile your MOF on installation of your component Mofcomp. exe My. Events. mof

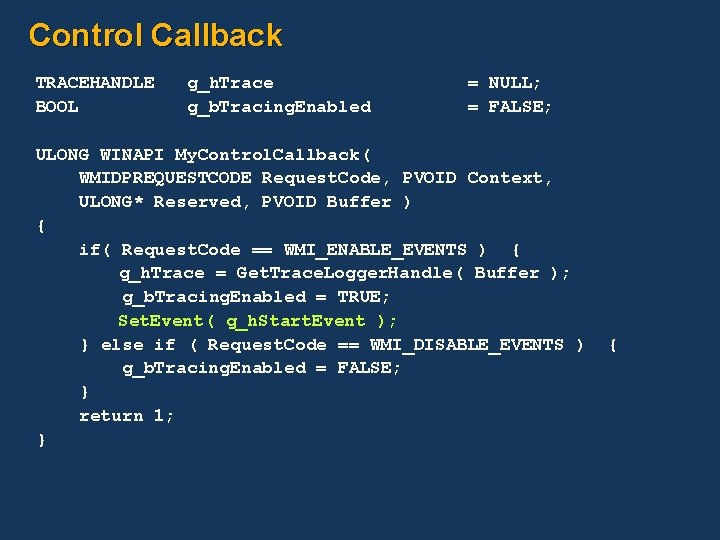
Control Callback TRACEHANDLE BOOL g_h. Trace g_b. Tracing. Enabled = NULL; = FALSE; ULONG WINAPI My. Control. Callback( WMIDPREQUESTCODE Request. Code, PVOID Context, ULONG* Reserved, PVOID Buffer ) { if( Request. Code == WMI_ENABLE_EVENTS ) { g_h. Trace = Get. Trace. Logger. Handle( Buffer ); g_b. Tracing. Enabled = TRUE; Set. Event( g_h. Start. Event ); } else if ( Request. Code == WMI_DISABLE_EVENTS ) g_b. Tracing. Enabled = FALSE; } return 1; } {

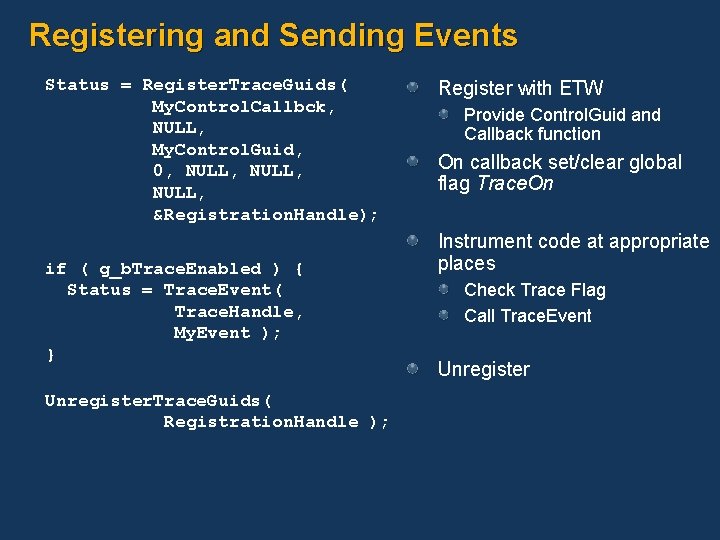
Registering and Sending Events Status = Register. Trace. Guids( My. Control. Callbck, NULL, My. Control. Guid, 0, NULL, &Registration. Handle); if ( g_b. Trace. Enabled ) { Status = Trace. Event( Trace. Handle, My. Event ); } Unregister. Trace. Guids( Registration. Handle ); Register with ETW Provide Control. Guid and Callback function On callback set/clear global flag Trace. On Instrument code at appropriate places Check Trace Flag Call Trace. Event Unregister

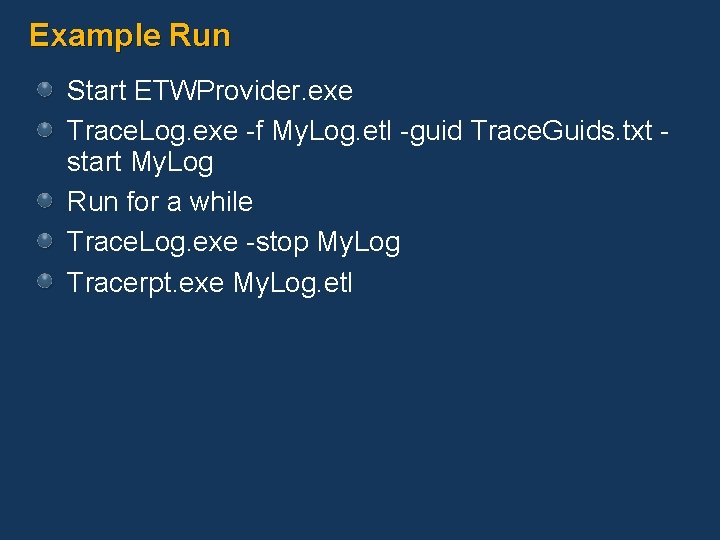
Example Run Start ETWProvider. exe Trace. Log. exe -f My. Log. etl -guid Trace. Guids. txt start My. Log Run for a while Trace. Log. exe -stop My. Log Tracerpt. exe My. Log. etl

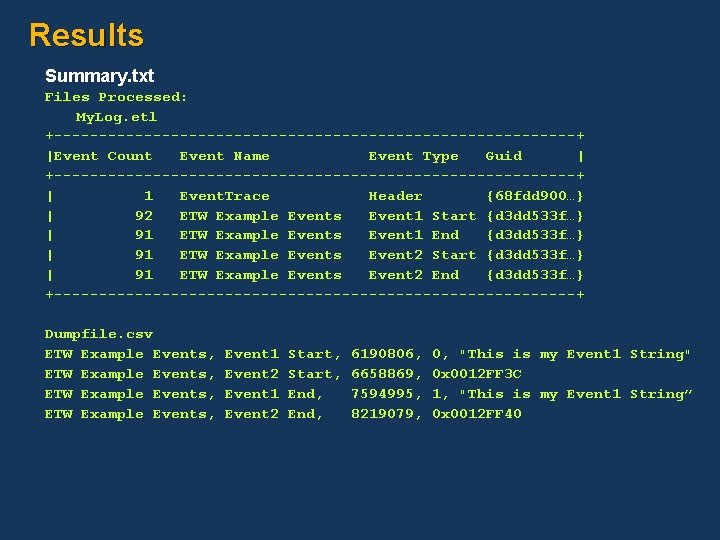
Results Summary. txt Files Processed: My. Log. etl +-----------------------------+ |Event Count Event Name Event Type Guid | +-----------------------------+ | 1 Event. Trace Header {68 fdd 900…} | 92 ETW Example Events Event 1 Start {d 3 dd 533 f…} | 91 ETW Example Events Event 1 End {d 3 dd 533 f…} | 91 ETW Example Events Event 2 Start {d 3 dd 533 f…} | 91 ETW Example Events Event 2 End {d 3 dd 533 f…} +-----------------------------+ Dumpfile. csv ETW Example Events, Event 1 Event 2 Start, End, 6190806, 6658869, 7594995, 8219079, 0, "This is my Event 1 String" 0 x 0012 FF 3 C 1, "This is my Event 1 String” 0 x 0012 FF 40

Kernel Mode / Managed Code Providers

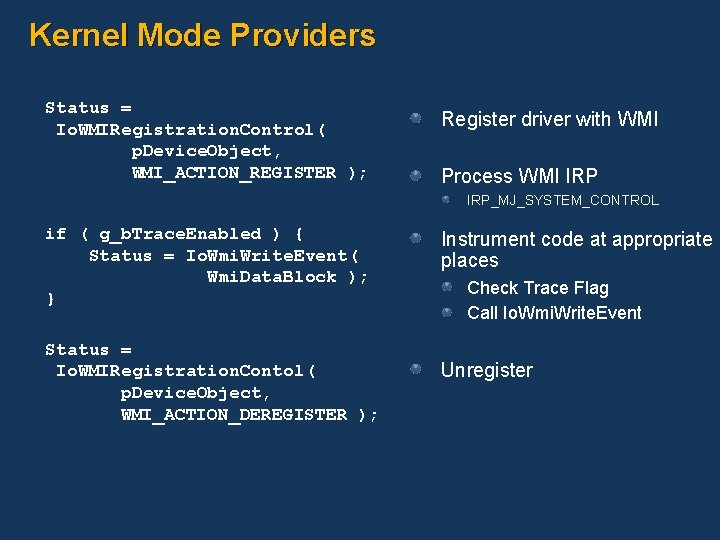
Kernel Mode Providers Status = Io. WMIRegistration. Control( p. Device. Object, WMI_ACTION_REGISTER ); Register driver with WMI Process WMI IRP_MJ_SYSTEM_CONTROL if ( g_b. Trace. Enabled ) { Status = Io. Wmi. Write. Event( Wmi. Data. Block ); } Status = Io. WMIRegistration. Contol( p. Device. Object, WMI_ACTION_DEREGISTER ); Instrument code at appropriate places Check Trace Flag Call Io. Wmi. Write. Event Unregister

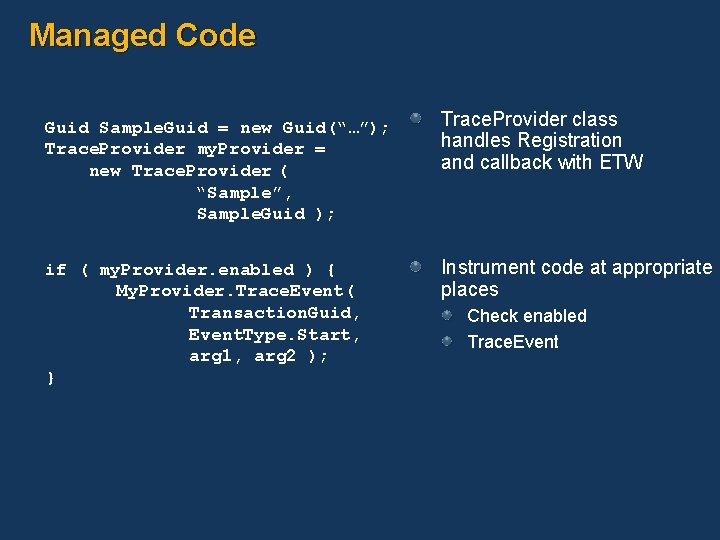
Managed Code Guid Sample. Guid = new Guid(“…”); Trace. Provider my. Provider = new Trace. Provider ( “Sample”, Sample. Guid ); if ( my. Provider. enabled ) { My. Provider. Trace. Event( Transaction. Guid, Event. Type. Start, arg 1, arg 2 ); } Trace. Provider class handles Registration and callback with ETW Instrument code at appropriate places Check enabled Trace. Event

The Kernel Logger

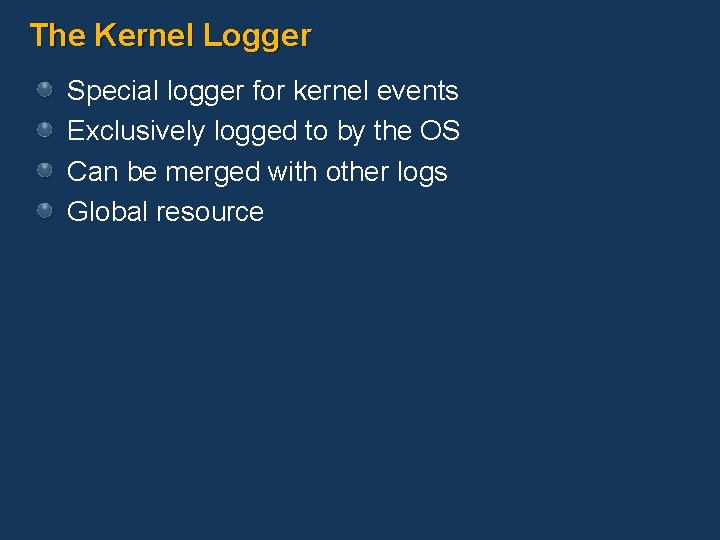
The Kernel Logger Special logger for kernel events Exclusively logged to by the OS Can be merged with other logs Global resource

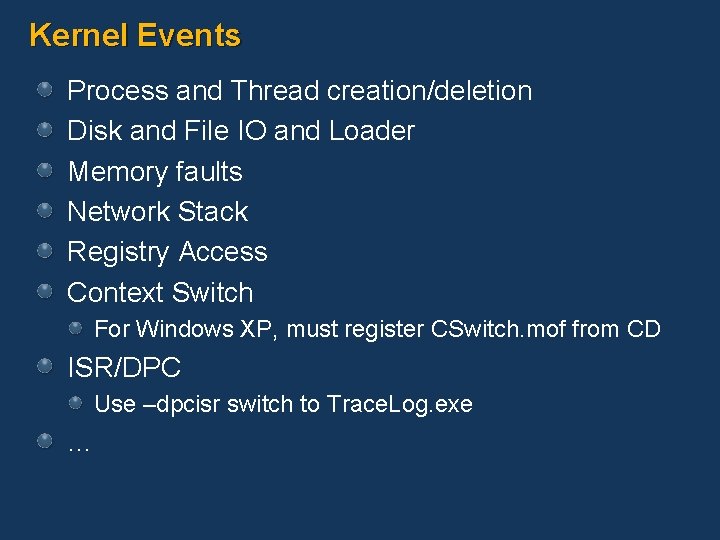
Kernel Events Process and Thread creation/deletion Disk and File IO and Loader Memory faults Network Stack Registry Access Context Switch For Windows XP, must register CSwitch. mof from CD ISR/DPC Use –dpcisr switch to Trace. Log. exe …

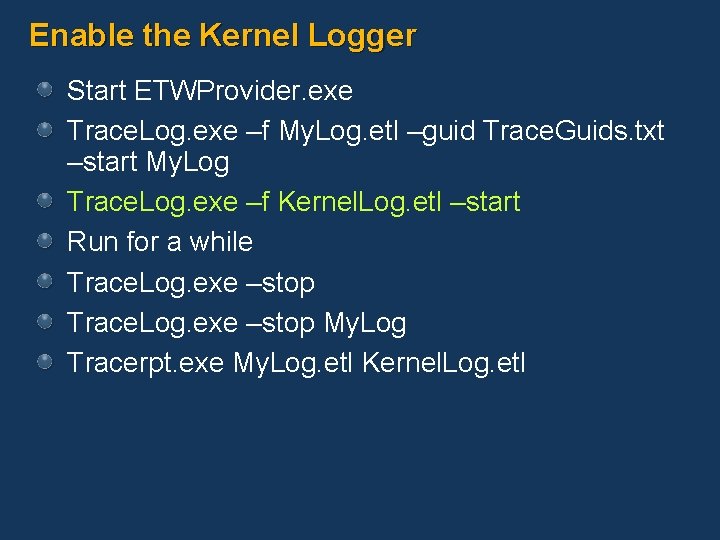
Enable the Kernel Logger Start ETWProvider. exe Trace. Log. exe –f My. Log. etl –guid Trace. Guids. txt –start My. Log Trace. Log. exe –f Kernel. Log. etl –start Run for a while Trace. Log. exe –stop My. Log Tracerpt. exe My. Log. etl Kernel. Log. etl

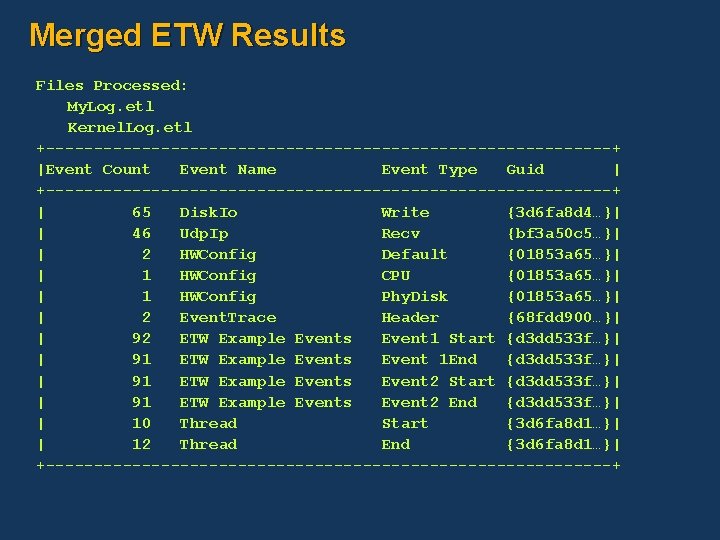
Merged ETW Results Files Processed: My. Log. etl Kernel. Log. etl +------------------------------+ |Event Count Event Name Event Type Guid | +------------------------------+ | 65 Disk. Io Write {3 d 6 fa 8 d 4…}| | 46 Udp. Ip Recv {bf 3 a 50 c 5…}| | 2 HWConfig Default {01853 a 65…}| | 1 HWConfig CPU {01853 a 65…}| | 1 HWConfig Phy. Disk {01853 a 65…}| | 2 Event. Trace Header {68 fdd 900…}| | 92 ETW Example Events Event 1 Start {d 3 dd 533 f…}| | 91 ETW Example Events Event 1 End {d 3 dd 533 f…}| | 91 ETW Example Events Event 2 Start {d 3 dd 533 f…}| | 91 ETW Example Events Event 2 End {d 3 dd 533 f…}| | 10 Thread Start {3 d 6 fa 8 d 1…}| | 12 Thread End {3 d 6 fa 8 d 1…}| +------------------------------+

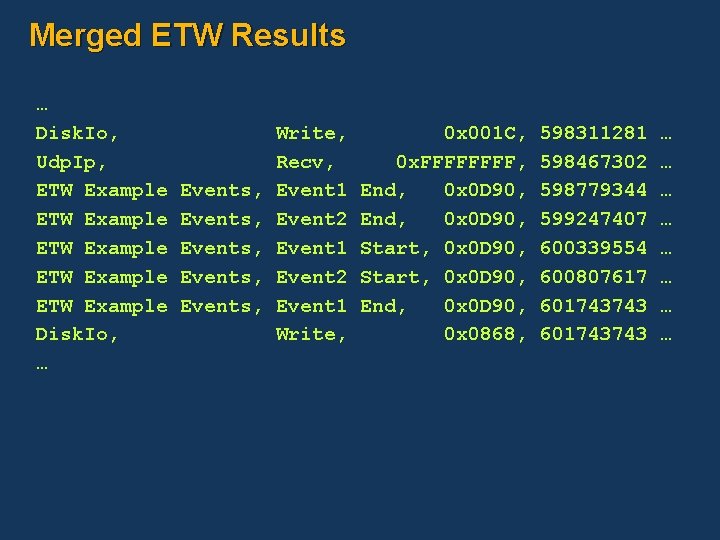
Merged ETW Results … Disk. Io, Udp. Ip, ETW Example ETW Example Disk. Io, … Events, Events, Write, Recv, Event 1 Event 2 Event 1 Write, 0 x 001 C, 0 x. FFFF, End, 0 x 0 D 90, Start, 0 x 0 D 90, End, 0 x 0 D 90, 0 x 0868, 598311281 598467302 598779344 599247407 600339554 600807617 601743743 … … … …

ETW Consumers Event Log ( Windows codenamed “Longhorn” ) RATT PIX for Windows ( Q 4 ) Sys. Internals TCPView and Disk. Mon VS Whidbey

ETW on Longhorn Overview Key piece of Longhorn Instrumentation Infrastructure New Enhanced and Simplified API Enhanced discovery of instrumented components One set of APIs for tracing (ETW) and eventing (Longhorn Event. Log Service) New features and improvements for Longhorn Provider security to protect sensitive data Multiplexing of events to multiple consumers Activity ID support for correlating events TDH library for a unified way to decode events More Events from Windows components More Third-Party ETW produces and consumers

Call To Action Use tracing to understand what is happening on the system Instrument your software for performance analysis and debugging Ship ETW enabled software Consider exposing selected events for your customers and partners

Additional Resources Web Resources Event Tracing Reference http: //msdn. microsoft. com/library/default. asp? url=/library/enus/perfmon/base/about_event_tracing. asp MOF Reference http: //msdn. microsoft. com/library/default. asp? url=/library/enus/perfmon/base/data_types_for_event_data. asp WDK Tools: Trace. Log. exe http: //msdn. microsoft. com/library/default. asp? url=/library/enus/ddtools/hh/ddtools/tracelog_b 6 beb 1 b 9 -7356 -4975 -8 f 532 f 2338 ae 1927. xml. asp Trace. Rpt. exe available in windowssystem 32

© 2005 Microsoft Corporation. All rights reserved. This presentation is for informational purposes only. Microsoft makes no warranties, express or implied, in this summary.