To Freeze or Not to Freeze Strategies and


 2")

 1 0 Tb Profile During Freezing Exposure Rebound Temperature -1 -2")


 serve")
 inhibited by freezing GLUCOSE-1")

,")
 Tissue Glucose Unfrozen Frozen Summer 300 250 16 50")
 Total Phos ( mol min-1 g. FW-1)")


 inhibited by freezing GLUCOSE-1")
 no change with freezing")


 and rate of cooling •")


- Slides: 49
To Freeze or Not to Freeze: Strategies and Mechanisms of Overwintering in Terrestrial Anurans David Swanson Dept. of Biology, Univ. South Dakota
Anuran Overwintering Strategies • Aquatic • Terrestrial Burrowers • Terrestrial - Shallow • Freezing Tolerance vs. Freezing Avoidance
Freezing Tolerance in Anurans • Present in species using shallow terrestrial hibernacula • Absent in burrowers or aquatic overwintering species • Burrowing anurans little studied Exposed to subfreezing temps?
12 Average Minimum 100 cm 50 cm 20 cm 5 cm 8 Soil Temperature (°C) 4 0 -4 -8 12 Extreme Minimum 6 0 -6 -12 -18 O N D J F M
STUDY SPECIES • Terrestrial Burrowers – Great Plains Toad, Bufo cognatus – Woodhouse’s Toad, Bufo woodhousii – Plains Spadefoot, Spea bombifrons • Terrestrial - Shallow – Chorus Frog, Pseudacris triseriata
Pseudacris triseriata Range: New Mexico to Canada Mass = 0. 5 - 2. 0 g ; SVL = 1. 9 - 3. 5 cm
Spea bombifrons Range: n. Mexico to s. Canada; Mass = 2 -20 g
Bufo cognatus Range: n. Mexico to s. Canada; Mass = 3 -35 g
Bufo woodhousii Range: Texas to North Dakota, Montana; Mass = 2 -35 g
Hypothesis # 1 • Toads and Spadefoot will not be freezing tolerant • Chorus Frog will be freezing tolerant
Acclimation Protocol 1 Captured in Sept-Oct 2 Food & water, natural photoperiod, room temperature (23 o. C) until early November 3 Food removed, 10 o. C, total darkness for 2 weeks 4 Temperature reduced to 2 o. C in mid. November 5 Freezing expts. in Jan-Feb
Freezing Protocol 1 Placed in chamber at -1 o. C (dry or moist) 2 Chamber temperature decreased 1 o. C/h 3 Chamber temperature dropped until freezing exotherm occurs (sometimes initiated by contact with external ice) 4 Chamber temperature maintained at -2. 5 o. C to -4. 5 o. C for 24 h 5 Thawing at 2 o. C and Recovery Tests
Freezing Apparatus
Temperature (o. C) 1 0 Tb Profile During Freezing Exposure Rebound Temperature -1 -2 -3 -4 Supercooling Point Time
Freezing Survival
100 4 Chorus Frog Survival % Survival 80 5 60 40 4 20 0 4 -4 to -6 -3 to -4 -2 to -3 -1 to -2 Crystallization Temperature ( o C)
Freezing Tolerance in Anurans • Documented in 5 species of frogs • Can tolerate up to 65 -70% of total body water as ice • How is this accomplished?
Aspects of Anuran Freezing Tolerance • Low molecular weight carbohydrates (glucose and glycerol) serve anti-freeze and cryoprotectant functions • Accumulation not anticipatory for those frogs using glucose • Liver glycogen is the source • Accumulation associated with changes in enzyme activities
Wood frog Liver GLYCOGEN glycogen synthetase Pi glycogen phosphorylase (a) inhibited by freezing GLUCOSE-1 -P freezing induces g-phos activity phosphoglucomutase Glucose GLUCOSE-6 -P F-6 -P PFK-1 F-1, 6 -P 2 inhibited by freezing Pi glucose-6 -phosphatase GLUCOSE glucose conc. in tissues
Hypothesis # 2 • Chorus Frogs will mobilize glucose and show a pattern of enzyme activation during freezing similar to Wood Frogs • Toads will fail to mobilize glucose and enhance enzyme activities during freezing
Methods • Acclimation and Freezing Exposure treatments similar (– 2. 5°C for 24 h), except inoculated freezing; Frozen compared to unfrozen controls • Leg muscle and liver were removed on ice for both frozen and control groups • Assays for tissue glucose and glycogen phosphorylase activity • Also measured unfrozen summer animals
Glucose ( mol g. FW-1) Tissue Glucose Unfrozen Frozen Summer 300 250 16 50 12 40 8 30 20 4 10 0 0 Muscle Liver Chorus Frog Muscle Liver Toad
Phos a ( mol min-1 g. FW-1) Total Phos ( mol min-1 g. FW-1) 40 Unfrozen Frozen Summer 30 20 10 0 60 40 20 0 Muscle Liver Frog Muscle Liver Toad
Results and Conclusions - 1 • Chorus Frogs accumulate glucose, toads don’t • Glucose accumulation associated with higher liver phos activity in frogs • Development of freezing tolerance likely associated with winter increase in phos activity
Results and Conclusions - 2 • Liver phosphorylase activity did not increase after freezing in chorus frogs • Differs from other freeze-tolerant frogs • One possible reason for this difference: transient increase in chorus frogs (increased activity for several hrs after freezing, but return to normal by 24 h in frozen state)
Hypothesis # 3 • No transient elevation in phosphorylase activity will occur in chorus frogs • Glycogen synthetase will not be inhibited by freezing
Methods • Same acclimation and freezing methods as previously • Freezing Exposure Treatments: – 5 min – 2 hr – 24 hr • Measured Tissue Glucose, Glycogen, Phosphorylase, Synthetase
350 Liver glucose b mol g. FW-1 300 250 200 150 100 50 a a a 5 min 2 hr 0 Control 24 hr
35 Muscle glucose b 30 b mol g. FW-1 25 20 15 10 a a 5 0 Control 5 min 2 hr 24 hr
Liver glycogen phosphorylase mol min-1 g. FW-1 80 100 Control 5 min 2 hr 24 hr 80 60 60 40 40 20 20 0 0 active total percent active Percent active form 100
Liver glycogen synthetase 900 nmol min-1 g. FW-1 800 700 Control 5 min 2 hr 24 hr 600 500 400 300 200 100 0 Independent Dependent
1800 Liver glycogen mol g. FW-1 glucosyl units 1600 1400 1200 1000 800 600 400 200 0 Control 5 min 2 hr 24 hr
140 Muscle glycogen mol g. FW-1 glucosyl units 120 100 80 60 40 20 0 Control 5 min 2 hr 24 hr
Results Summary • Glucose accumulated rapidly • Neither phosphorylase nor synthetase activities varied with time in liver • Liver glycogen did not vary with time, but muscle glycogen increased – so muscle glycogen is not the source for increasing glucose in muscle
Wood frog Liver GLYCOGEN glycogen synthetase Pi glycogen phosphorylase (a) inhibited by freezing GLUCOSE-1 -P freezing induces g-phos activity phosphoglucomutase Glucose GLUCOSE-6 -P F-6 -P PFK-1 F-1, 6 -P 2 inhibited by freezing Pi glucose-6 -phosphatase GLUCOSE glucose conc. in tissues
Chorus frog Liver GLYCOGEN glycogen synthetase Pi glycogen phosphorylase (a) no change with freezing GLUCOSE-1 -P phosphoglucomutase Glucose GLUCOSE-6 -P F-6 -P PFK-1 F-1, 6 -P 2 inhibited by freezing ? ? Pi glucose-6 -phosphatase GLUCOSE glucose conc. in tissues
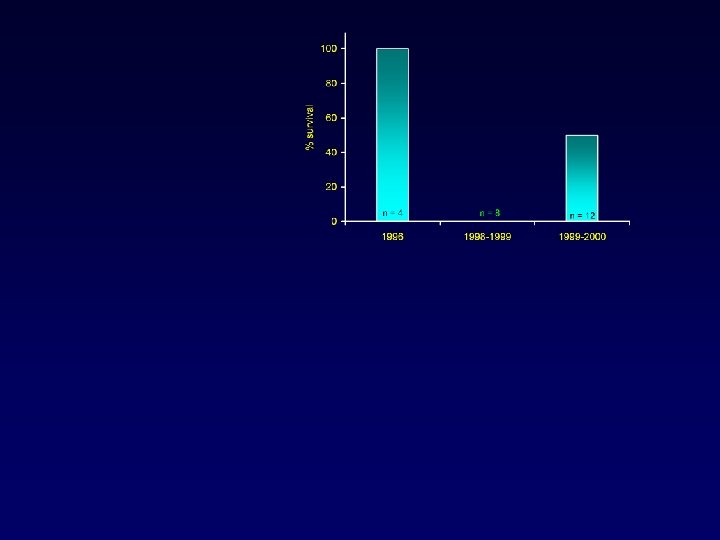
Freezing Survival differed among Winters in Chorus Frogs Chorus Frog Freezing Survival
Methods • Poor survival in some years led us to question why survival differs among years • 1998 -99 and 1999 -2000 frogs: 24 -h frozen treatment – immediately euthanized – measured glucose and liver glycogen • Compare values to 1996 winter data where frogs had good survival
Body size and freezing survival • Body size (mass) and rate of cooling • smaller frogs may cool faster • cooling rate in 1998 -1999 and 19992000 was lower than in 1996 • Liver glycogen reserves may be limited by body size • Comparisons of 1998 and 1999 studies with 1996.
R 2 = 0. 143, P = 0. 033 Liver Glycogen ( mol/g. FW ) 1200 1000 800 600 400 200 0 0. 4 0. 6 0. 8 1. 0 Body Mass (g) 1. 2 1. 4
Year: 2001 1. 2 Liver Glucose Liver Glycogen 0. 8 0. 4 0. 0 Glucose ( mol/g. FW) Sp S F 800 700 40 600 30 500 20 400 300 10 200 0 100 Spring Summer Fall Glycogen ( mol/g. FW) 50 Mass (g) 1. 6
Results and Conclusions • High mortality in 1998 -1999 and 1999 -2000 likely related to low glucose levels • Low glucose levels result from low liver glycogen, not low glycogen phosphorylase activity