Statistics Probability Precision Recall Lecture 17 Meaning of

Statistics, Probability, Precision, Recall Lecture 17

Meaning of statistics • Definition-01 • Science of collection, presentation, analysis, and reasonable interpretation of data. • Definition-02 • Statistics consists of a body of methods for collecting and analyzing data. (Agresti & Finlay, 1997) • Questions: • What kind and how much data • How to organize the data • How we can analyze the data • That is, statistics provides methods for • Design: of research studies • Description: summarizing and exploring data • Inference: Making predictions

Types Descriptive and inferential Statistics • Descriptive statistics • Defination-01: The descriptive statistics is concerned with describing or summarizing and the numerical properties of data • Defination-02: Descriptive statistics consist of methods for organizing and summarizing information (Weiss, 1999) • The methodology of descriptive statistics includes • classification, tabulation, graphical representation and calculation of certain indicators such as mean, median, range, etc. which summaries certain important features of data • Inferential statistics, which is also referred to as statistical inference, is concerned with derivation of scientific inference about generalization of results from the study of a few particular cases. • The methodology of inferential statistics includes • point estimation, interval estimation and hypothesis testing

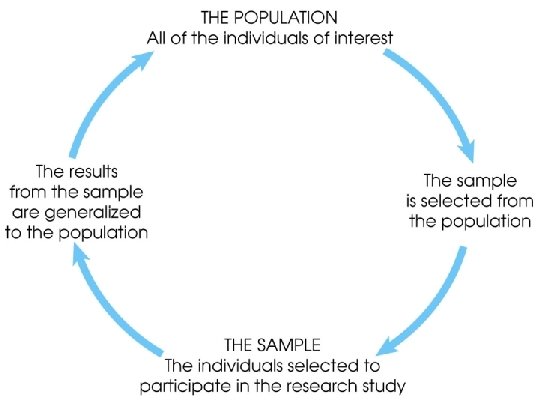
Population • The entire group of individuals is called the population. • For example, a researcher may be interested in the relation between class size (variable 1) and academic performance (variable 2) for the population of third-grade children. Sample • Usually populations are so large that a researcher cannot examine the entire group. Therefore, a sample is selected to represent the population in a research study. The goal is to use the results obtained from the sample to help answer questions about the population. 4

A Taxonomy of Statistics

Some Definitions Variable - In statistics, a variable has two defining characteristics: • A variable is an attribute that describes a person, place, thing, or idea. • The value of the variable can "vary" from one entity to another. • For example, a person's hair color is a potential variable, which could have the value of "blond" for one person and "brunette" for another. 1. Categorical/qualitative – • Qualitative variables take on values that are names or labels. The color of a ball (e. g. , red, green, blue) or the breed of a dog (e. g. , collie, shepherd, terrier) would be examples of qualitative or categorical variables. 2. Numeric/quantitative – • Quantitative variables are numeric. They represent a measurable quantity. For example, when we speak of the population of a city, we are talking about the number of people in the city - a measurable attribute of the city. Therefore, population would be a quantitative variable.
")
In an Algebraic situation, equation, table, or graph, the variables (usually x and y) can be classified as either independent _____ or _____. dependent

Independent Variable The independent variable is always located on the x-axis _____ of a graph. Input (domain) The independent variable is the ________. “x” It is usually the ____ in a table or equation. The independent variable STANDS ALONE (______). Does not depend first The dependent variable is what happens _______.

Independent Variable. The variable in a function whose value is subject to choice is the independent variable. The independent variable affects the value of the dependent variable.

Dependent Variable The dependent variable is always located on the _____ of a graph. y-axis The dependent variable is the _______. Output (Range) “y” It is usually the _______ in a table or equation. The dependent variable DEPENDS on the ________. independent variable The dependent variable is what happens _______. 2 nd

The variable in a function whose value is determined by the independent variable.

Let’s Practice! 1. A student’s grade depends on how much she studies. Time studying Independent variable: _____ Dependent variable: ______ grade 2. The height of a plant and the amount you water it. Amount watered Independent variable: ______ height Dependent variable: _______

3. The amount of money you make and the number of hours you work. Hours worked Independent variable: _______ Amount of money Dependent variable: _______ 4. The number of sodas you buy and the total money spent. Number of sodas Independent variable: _______ Total money Dependent variable: ________ 5. The number of houses you can paint depends on how much time you have. Amount of time Independent variable: _______ Number of houses Dependent variable: ________

Continuous Data continuously Data that is continuous is data that _____ happens. You can usually tell that your data is measuring continuous if you are _____ something (i. e. time, distance, length, height, etc. ). If your data is continuous, then you will _____ the connect points on your graph.

Discrete Data You can tell that your data is discrete if counting or measuring in whole numbers you are ____________ (i. e. number of people, cars, or stories of a building). If your data is discrete, then NOT connect you will _______ the points on your graph.

Let’s Practice Look at the situations given in examples 1 -5. Decide if the situation would best be classified as either discrete or continuous data. 1. A student’s grade depends on how much she studies. continuous 2. The height of a plant and the amount you water it. continuous 3. The amount of money you make and the number of hours you work. discrete 4. The number of sodas you buy and the total money spent. discrete 5. The number of houses you can paint depends on how much time you have. continuous

Example Kadence collected data on the number of push-ups she could do in 2 minutes. The table below shows her data. Time (seconds) 0 10 20 30 40 50 60 70 80 90 100 110 120 Total # Push-ups 0 4 7 31 9 12 17 20 22 24 27 30 35 a. What is the independent variable? Time (seconds) b. Is the data continuous or discrete? Discrete – counting push-ups
.")
Correlation • It is the relationship that exists between two variables (Independent and dependent).

Positive Correlation • As one variable increases, so does the other. y x

Example of positive correlation… The longer you exercise, the more calories you burn. *As exercise increases, calories burned increases Can you think of one?

Negative Correlation: • As one variable increases, the other decreases. y x

Example of negative correlation… The longer the air conditioner is turned on, the colder the temperature. *As time increases, the temperature decreases Can you think of one?

No Correlation: • As one variable increases, you cannot tell what the other is doing. y x

Example of no correlation… The number of students in the classroom and the average height. *As the number of students increases, you cannot tell what the average height will do.

Everything… The amount of time you spend in an airplane and the distance between your departure and your destination. 1. What are the independent and dependent variables? Independent: Distance Dependent: Time 2. Would this situation represent a discrete or continuous situation? Continuous 3. What type of correlation is represented in this situation? Negative correlation

Everything again… The number of times you dip a wick into hot wax and the diameter of a handmade candle 1. What are the independent and dependent variables? Independent: The number of dips Dependent: diameter of candle 2. Would this situation represent a discrete or continuous situation? Discrete 3. What type of correlation is represented in this situation? Positive correlation

28

29

30

31

32

33

34

Principal component analysis is a statistical procedure that uses an orthogonal transformation to convert a set of observations of possibly correlated variables into a set of values of linearly uncorrelated variables called principal components PCA was invented in 1901 by Karl Pearson. 35

Factor analysis is a statistical procedure that is used to describe variability among observed, correlated variables in terms of potentially lower number of unobserved variables called factors. e. g; it may be possible that variations in six observed variables mainly reflects the variations in two unobserved variables. 36

37

Some Definitions Random variable • If a variable can take on any value between its minimum value and its maximum value, it is called a continuous variable A Ranked variable– • Variables that can only take on a finite number of values are called "discrete variables. " All qualitative variables are discrete. Some quantitative variables are discrete, such as performance rated as 1, 2, 3, 4, or 5, or temperature rounded to the nearest degree.

Some Definitions Univariate Data • When we conduct a study that looks at only one variable, we say that we are working with univariate data. Suppose, for example, that we conducted a survey to estimate the average weight of high school students. Since we are only working with one variable (weight), we would be working with univariate data. Bivariate data– • When we conduct a study that examines the relationship between two variables, we are working with bivariate data. Suppose we conducted a study to see if there were a relationship between the height and weight of high school students. Since we are working with two variables (height and weight), we would be working with bivariate data. Multivariate data– • Multivariate Data Analysis refers to any statistical technique used to analyze data that arises from more than one variable. This essentially models reality where each situation, product, or decision involves more than a single variable.

Some Definitions Variable - any characteristic of an individual or entity. A variable can take different values for different individuals. Variables can be categorical or quantitative. (Per S. S. Stevens)… • Nominal - Categorical variables with no inherent order or ranking sequence such as names or classes (e. g. , gender). Value may be a numerical, but without numerical value (e. g. , I, III). The only operation that can be applied to Nominal variables is enumeration. • Ordinal - Variables with an inherent rank or order, e. g. mild, moderate, severe. Can be compared for equality, or greater or less, but not how much greater or less. • Interval - Values of the variable are ordered as in Ordinal, and additionally, differences between values are meaningful, however, the scale is not absolutely anchored. Calendar dates and temperatures on the Fahrenheit scale are examples. Addition and subtraction, but not multiplication and division are meaningful operations. • Ratio - Variables with all properties of Interval plus an absolute, non-arbitrary zero point, e. g. age, weight, temperature (Kelvin). Addition, subtraction, multiplication, and division are all meaningful operations.

Observation and variables • observation • We call a set of data derived from an object (experimental unit) an observation. Each object is measured according to various aspects, such as temperature, concentration of some constituents, frequency of occurrence of some phenomenon, etc

Probability is the measure of the likelihood/possibility/chance that an event will occur.

Conditional Probability

Conditional Probability
 = (mistake and disturbed) / disturbed = 4/6 P(disturbed")
Conditional Probability P(mistake | disturbed) = (mistake and disturbed) / disturbed = 4/6 P(disturbed | mistake) = (disturbed and mistake) / mistake = 4/5

Conditional Probability Product Rule

Conditional Probability

Baye’s Rule probability of A given B is equal to the probability of A, multiplied by the probability of B given A, divided by the probability of B.

Baye’s Rule Thomas Bayes 1701 – 1761

Example

Example = 30/40 = 50/80 = 0. 6

Precision, Recall, and the F measure

Errors • The process we just went through was based on fixing two kinds of errors • Matching strings that we should not have matched (there, then, other) • False positives (Type I) • Not matching things that we should have matched (The) • False negatives (Type II) • In NLP we are always dealing with these kinds of errors. • Reducing the error rate for an application often involves two antagonistic efforts: • Increasing accuracy or precision (minimizing false positives) • Increasing coverage or recall (minimizing false negatives).

Precision and Recall Precision: How many selected items are relevant Recall: How many relevant items are selected 54

Accuracy and Precision • Accuracy refers to the closeness of a measured value to a standard or known value. For example, if in lab you obtain a weight measurement of 3. 2 kg for a given substance, but the actual or known weight is 10 kg, then your measurement is not accurate. In this case, your measurement is not close to the known value. • Precision refers to the closeness of two or more measurements to each other. Using the example above, if you weigh a given substance five times, and get 3. 2 kg each time, then your measurement is very precise. Precision is independent of accuracy. You can be very precise but inaccurate, as described above. You can also be accurate but imprecise. • https: //labwrite. ncsu. edu/Experimental%20 Design/accuracyprecision. htm 55

Accuracy and Precision • Accuracy refers to how close a measurement is to the true value. • Precision is how consistent results are when measurements are repeated • An easy way to remember the difference between accuracy and precision is: ACcurate is Correct (or Close to real value) PRecise is Repeating (or Repeatable) • . 56

57

The 2 -by-2 contingency table selected not selected correct tp fn not correct fp tn

Precision and recall • Precision: % of selected items that are correct Recall: % of correct items that are selected not selected correct tp fn not correct fp tn

A combined measure: F • A combined measure that assesses the P/R tradeoff is F measure (weighted harmonic mean): • The harmonic mean is a very conservative average; • People usually use balanced F 1 measure • i. e. , with = 1 (that is, = ½): F = 2 PR/(P+R)

Text Classification: Evaluation

Confusion matrix c • For each pair of classes <c 1, c 2> how many documents from c 1 were incorrectly assigned to c 2? • c 3, 2: 90 wheat documents incorrectly assigned to poultry Docs in test set Assigned UK Assigned poultry Assigned wheat Assigned coffee Assigned interest Assigned trade True UK 95 1 13 0 1 0 True poultry 0 1 0 0 True wheat 10 90 0 1 0 0 True coffee 0 0 0 34 3 7 True interest - 1 2 13 26 5 True trade 0 0 2 14 5 10

Per class evaluation measures Recall: Fraction of docs in class i classified correctly: Precision: Fraction of docs assigned class i that are actually about class i: Accuracy: Fraction of docs classified correctly: Sec. 15. 2. 4

Micro- vs. Macro-Averaging Sec. 15. 2. 4 • If we have more than one class, how do we combine multiple performance measures into one quantity? • Macroaveraging: Compute performance for each class, then average. • Microaveraging: Collect decisions for all classes, compute contingency table, evaluate.

Sec. 15. 2. 4 Micro- vs. Macro-Averaging: Example Class 1 Class 2 Truth: yes Truth: no Classifier: yes 10 10 Classifier: no 10 970 • • • Micro Ave. Table Truth: yes Trut h: no Classifier: yes 90 10 Classifier: no 10 890 Truth: yes Truth: no Classifier: yes 100 20 Classifier: no 20 1860 Macroaveraged recall : (0. 5 + 0. 9)/2 = 0. 7 Microaveraged recall : 100/120 =. 83 Microaveraged score is dominated by score on common classes

Development Test Sets and Cross-validation Training set Development Test Set • Metric: P/R/F 1 or Accuracy • Unseen test set • avoid overfitting (‘tuning to the test set’) • more conservative estimate of performance • Cross-validation over multiple splits • Handle sampling errors from different datasets • Pool results over each split • Compute pooled dev set performance Test Set Training Set Dev Test Training Set Test Set
- Slides: 66