Statistical Genomics Lecture 6 Genotype Zhiwu Zhang Washington


 dd. NTP: (dideoxynucleotides): chain reaction terminator")


. 1")


 Acoustic shearing 2) Sonication 3) Hydrodynamic shear Enzymatic Methods")


 3. Pool DNAs 4. PCR . . . 1. Digest")


")
![Distribution of length n=100000 size=30000 x=round(runif(n, 1, size)) y=sort(x) interval=y[-1]-y[-n] hist(interval) Ex=size/n Va=Ex*Ex m=mean(interval)](https://slidetodoc.com/presentation_image_h/f0911a0f76c9b714e518e44bfa9fa41a/image-30.jpg "Distribution of length n=100000 size=30000 x=round(runif(n, 1, size)) y=sort(x) interval=y[-1]-y[-n] hist(interval) Ex=size/n Va=Ex*Ex m=mean(interval)")
: 1073 -81")


")
")

- Slides: 39
Statistical Genomics Lecture 6: Genotype Zhiwu Zhang Washington State University
Outline Genetic markers Sequencing Full vs. reduced Experiment Data process and format
Human genome project Funded by DOE, NIH and Welcome Trust in the UK Begun in 1990 Original planed to last 15 years. Institute for Genomic Research and U. of Washington provided over 450 K BAC each was tagged and contain 3~4 K bp across the entire human genome
Human genome project Accelerate the completion date to 2003 Celera Genomics Craig Venter was among those sequenced Identified 20~120 K genes Sequence of 3 billion base pairs Cost near 3 billion dollars
Types of genetic markers RFLP: Restriction fragment length polymorphism SSR: Simple Sequence Repeats SNP: Single Nucleotide Polymorphism ü Chip ü Sequencing
RFLP Restriction Enzyme Restriction fragment length polymorphism
SSR
SNP by hybridization http: //www. genome. gov/10000533
Fredric Sanger 1958 Nobel Price of Chemistry for Protein identification by electrophoresis 1980 Nobel Price of Chemistry for DNA sequencing
Ladder of DNA length d. NTP (deoxynucleotides) dd. NTP: (dideoxynucleotides): chain reaction terminator
1 st Generation DNA sequencing Fred Sanger and Alan R. Coulson, Nature 24, 687– 695 (1977)
2 nd generation sequencing Sequencing-by-synthesis by 454 Life Science: Margulies, M. et al. Nature 437, 376– 380 (2005). Multiplex Polony sequencing by George M. Church lab at Harvard Medical School: Shendure, J. et al. Science 309, 1728 – 1732 (2005). 1 2 3 4 5 6
Sequencing-by-synthesis 454 Life Science: Margulies, M. et al. Nature 437, 376– 380 (2005). 1 2 3 4 5 6 TGCTAC … TTTTTT … http: //en. wikipedia. org/wiki/File: Sequencing_by_synthesis_Reversible_terminators. png
Multiplex Polony sequencing George M. Church lab at Harvard Medical School: Shendure, J. et al. Science 309, 1728 – 1732 (2005). http: //wjingpan. blog. sohu. com/140002432. html
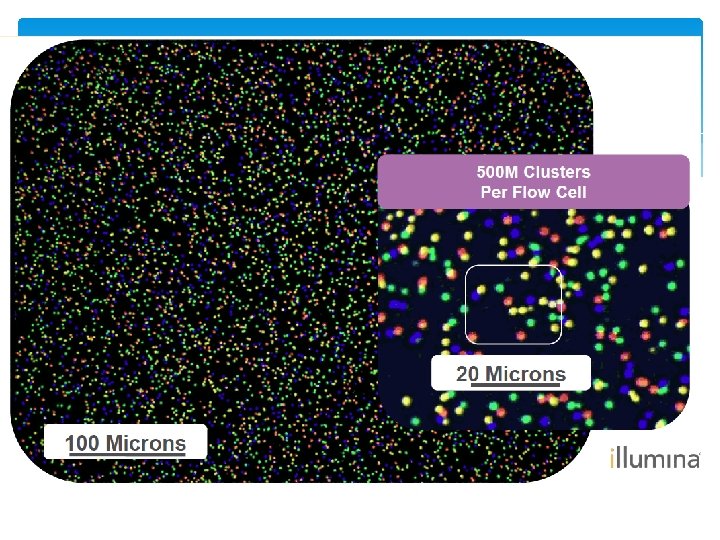
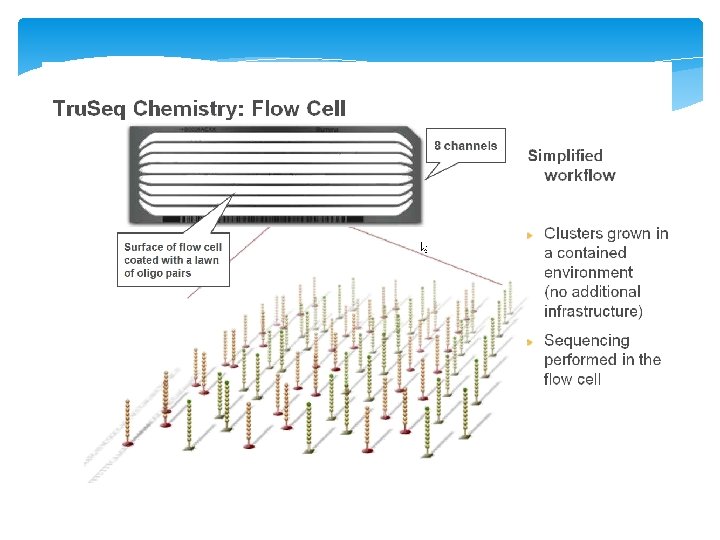
Cluster Generation
$1000 Genome Price/unit $/Genome* Consumables $/Gb Hi. Seq X Five $6 M $1. 2 M $1, 425 $1, 200 $10. 6 Hi. Seq X Ten $10 M $1, 000 $800 $7 http: //blog. genohub. com/illuminas-latest-release-hiseq-3000 -4000 -nextseq-550 -and-hiseq-x 5/
DNA/RNA fragmentation Physical Fragmentation 1) Acoustic shearing 2) Sonication 3) Hydrodynamic shear Enzymatic Methods 4) DNase I or other restriction endonuclease, non-specific nuclease 5) Transposase Chemical Fragmentation 6) Heat and divalent metal cation
Reduced Genotyping Sequencing Restriction site
Restriction enzymes: Ape. KI Recognition: 5’GCWGC 3’ W: A or T Expected size: 4^4 x 2=512 bp= 0. 5 Kb Genome coverage 100 bp read/512 bp size=20%
Restriction enzymes: Pst. I Recognition: 5’ CTGCAG 3’ Expected size: 4^6=4096 bp= 4 Kb Genome coverage 100 bp read/4096 bp size=2. 5%
Multiplex barcode Aalborg University, Denmark: Craig et al. Nat. Methods 2000, 5: 887– 893. 4~8 bases
Adapter and Barcode By Sharon Mitchell
Genotyping by sequencing (GBS) 3. Pool DNAs 4. PCR . . . 1. Digest DNA 2. Ligate adapters with barcodes . . Elshire et al. 2011. PLo. S One 5. Illumina sequencing
Cost reduction by multiplexing
Sequencing depth Definition: Expected sequencing times per base pair Calculation 100 Mb genome, 100 M read of 100 bp: 100 X 3 G genome, 1% reduced, 50 multiplex, 6 G data (1 byte one base): 6 G/(50 x 3 Gx 1%)=4 X
Genomic coverage and depth Ape. KI Pst. I Recognition bases 5 6 Fragment size . 5 Kb 4 Kb Genome coverage 20% 2. 5% Number of unique sequence (3 G genome) 3 G/. 5 Kb=6 M 3 G/4 Kb=. 75 M Sequencing depth (60 G data on 3 G genome) 60/(3 x. 2)=100 X 60/(3*. 025)=800 X
Distribution of length Expectation of length=length/number of cut Variance=Squared Expectation (need proof)
Distribution of length n=100000 size=30000 x=round(runif(n, 1, size)) y=sort(x) interval=y[-1]-y[-n] hist(interval) Ex=size/n Va=Ex*Ex m=mean(interval) v=var(interval) m v (Ex-m)/Ex (Va-v)/Va
Distribution of length Beissinger et al, Genetics. 2013, 193(4): 1073 -81
Number of reads
FASTQ @SRR 001666. 1 071112_SLXA-EAS 1_s_7: 5: 1: 817: 345 length=36 GGGTGATGGCCGCTGCCGATGGCGTCAAATCCCACC +SRR 001666. 1 071112_SLXA-EAS 1_s_7: 5: 1: 817: 345 length=36 IIIIIIIIIIIIIII 9 IG 9 IC Line 1: start with @ followed by sequence description Line 2: Sequence Line 3 start with + followed by description Line 4: Symbols of sequence quality values (same length as sequence) with ! the lowest and ~ the highest. There are 94 symbols with ascii code from 33 to 126. !"#$%&'()*+, -. /0123456789: ; <=>? @ABCDEFGHIJKLMNOPQRSTUVWXYZ[]^_`abcdefghijklmnopqrstuvwxyz{|}~
Ascii code x 33 34 35 36 37 38 39 40 41 42 43 44 45 46 47 48 49 50 51 52 53 54 55 CHAR(x) ! " # $ % & ' ( ) * + , . / 0 1 2 3 4 5 6 7 x 56 57 58 59 60 61 62 63 64 65 66 67 68 69 70 71 72 73 74 75 76 77 78 79 CHAR(x) 8 9 : ; < = > ? @ A B C D E F G H I J K L M N O x 80 81 82 83 84 85 86 87 88 89 90 91 92 93 94 95 96 97 98 99 100 101 102 CHAR(x) P Q R S T U V W X Y Z [ ] ^ _ ` a b c d e f x 103 104 105 106 107 108 109 110 111 112 113 114 115 116 117 118 119 120 121 122 123 124 125 126 CHAR(x) g h i j k l m n o p q r s t u v w x y z { | } ~
Post-sequencing http: //journals. plos. org/plosone/article? id=10. 1371/journal. pone. 0101025
Hapmap format IUPAC code
Genotype in Numeric format my. GD=read. table(file="http: //zzlab. net/GAPIT/data/mdp_numeric. txt", head=T)
Genetic map my. GM=read. table(file="http: //zzlab. net/GAPIT/data/mdp_SNP_information. txt", head=T)
Outline Genetic markers Sequencing Full vs. reduced Experiment Data process and format