Statistical Genomics Lecture 18 CMLM Zhiwu Zhang Washington





- Slides: 17
Statistical Genomics Lecture 18: CMLM Zhiwu Zhang Washington State University
Objective Criticism on MLM CMLM ECMLM
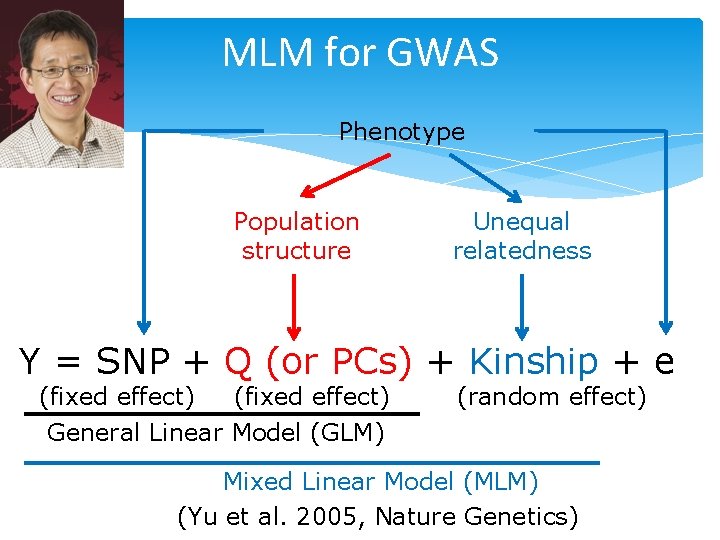
MLM for GWAS Phenotype Population structure Unequal relatedness Y = SNP + Q (or PCs) + Kinship + e (fixed effect) General Linear Model (GLM) (random effect) Mixed Linear Model (MLM) (Yu et al. 2005, Nature Genetics)
Atwell et al Nature 2010 a, No correction test b, Correction with MLM Magnus Norborg GWAS does not work for traits associated with structure
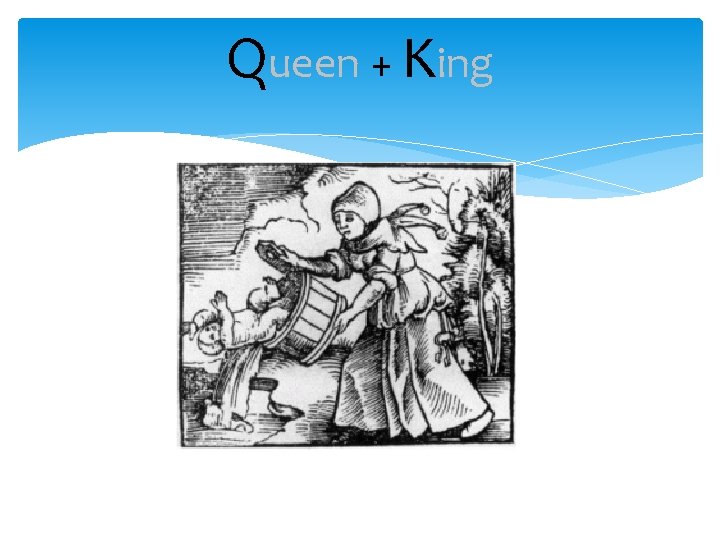
Queen + King
Compressed MLM y = SNP + Q (or PCs) + Kinship + e y = x 1 b 1 + x 2 b 2+x 3 b 3+x 4 b 4 + Zu+ e Group Zhang, Z. et al. Mixed linear model approach adapted for genome-wide association studies. Nat Genet 42, 355– 360 (2010).
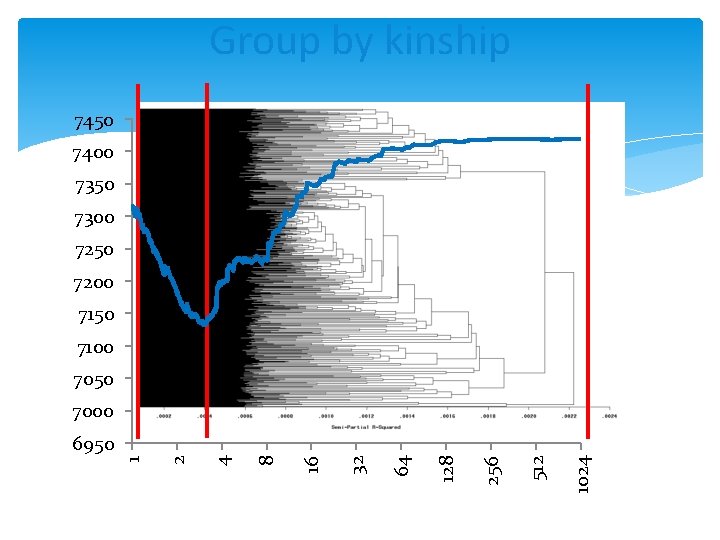
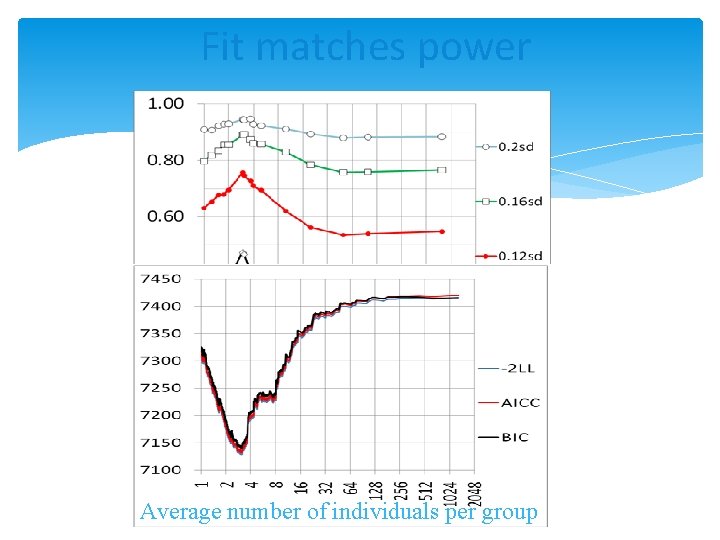
Group by kinship 7450 7400 7350 7300 7250 7200 7150 7100 7050 7000 1024 512 256 128 64 32 16 8 4 2 1 6950
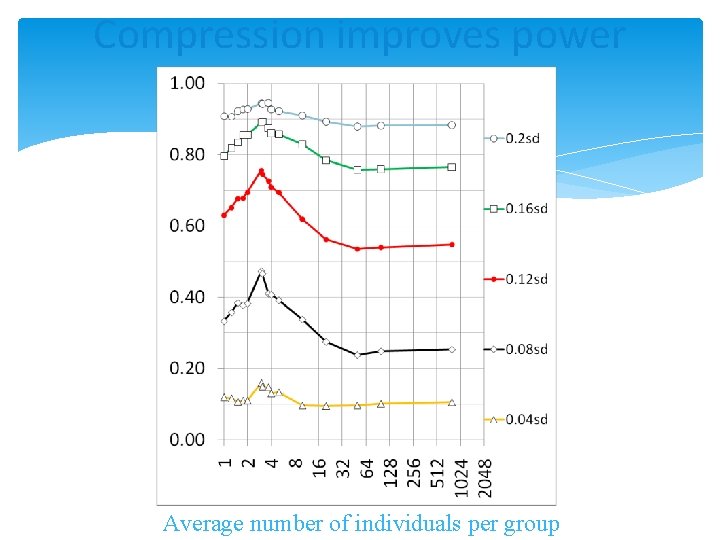
Compression improves power Average number of individuals per group
Fit matches power Average number of individuals per group
Dog (n=292) Maize (n=277) Fit of Model Human (n=1315) Statistical power 0. 20 sd (0. 83%) 0. 16 sd (0. 53%) 0. 5 sd (4. 99%) 0. 4 sd (3. 25%) 0. 3 sd (1. 85%) 0. 12 sd (0. 30%) 0. 3 sd (1. 85%) 0. 2 sd (0. 83%) 0. 08 sd (0. 13%) 0. 04 sd 0(. 03%) 0. 2 sd (0. 83%) 0. 1 sd (0. 21%) Compression level Compression is robust across species
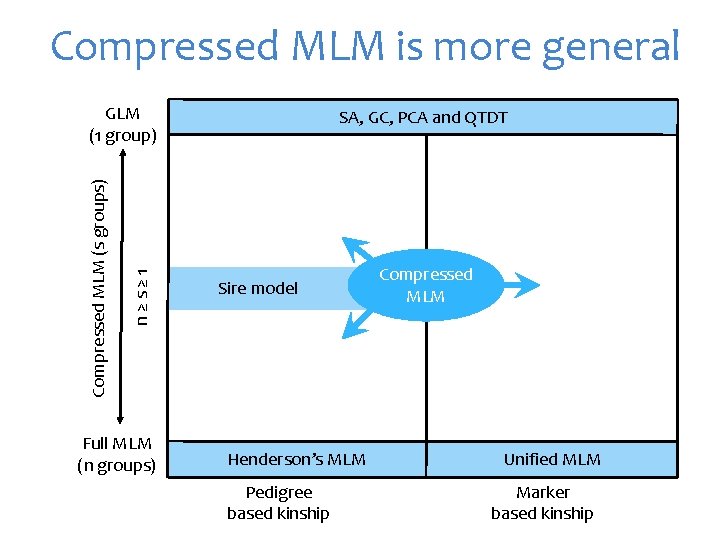
Compressed MLM is more general n≥s≥ 1 Compressed MLM (s groups) GLM (1 group) Full MLM (n groups) SA, GC, PCA and QTDT Sire model Henderson’s MLM Pedigree based kinship Compressed MLM Unified MLM Marker based kinship
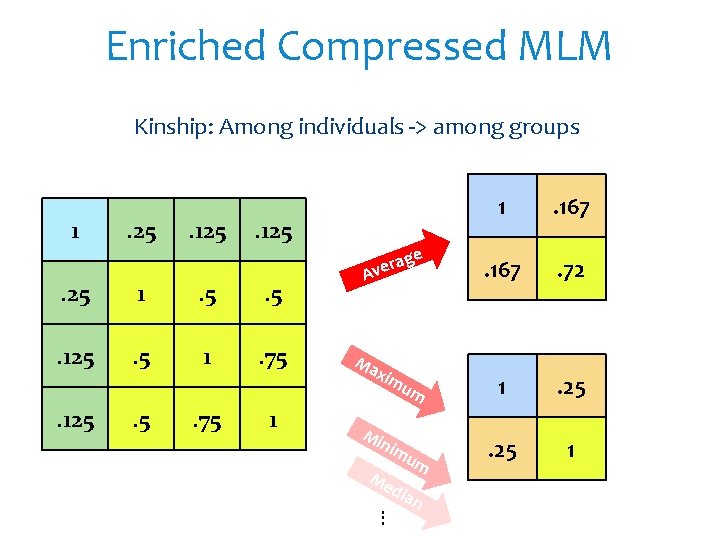
Enriched Compressed MLM Kinship: Among individuals -> among groups 1 . 25 . 125 . 25 1 . 5 . 125 . 5 1 . 75 . 125 . 75 1 e rag e v A Ma xim um Mi … nim um Me dia n 1 . 167 . 72 1 . 25 1
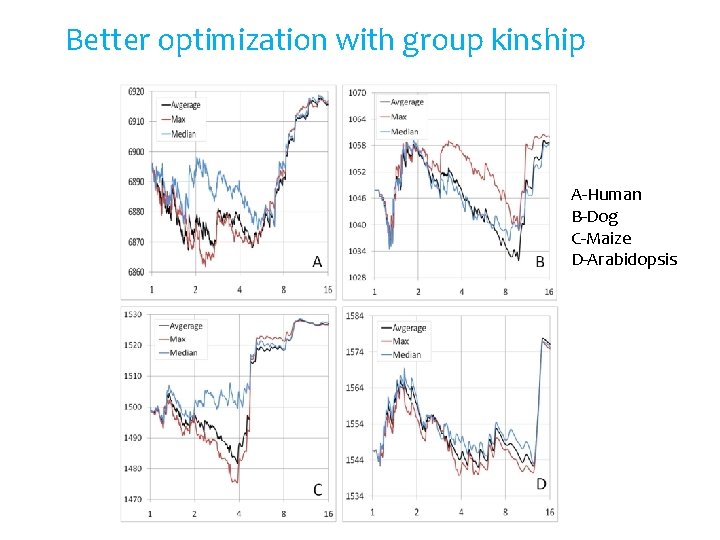
Better optimization with group kinship A-Human B-Dog C-Maize D-Arabidopsis
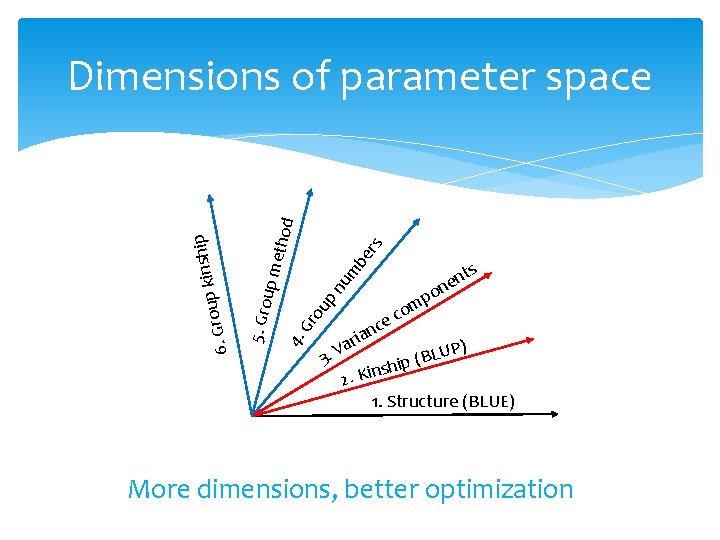
5. Gro up m etho d 4. Gr ou pn um be rs kins p u o r G 6. hip Dimensions of parameter space 3. a e nc ri a V 2. K ts n e on p m co UP) L B ( p inshi 1. Structure (BLUE) More dimensions, better optimization
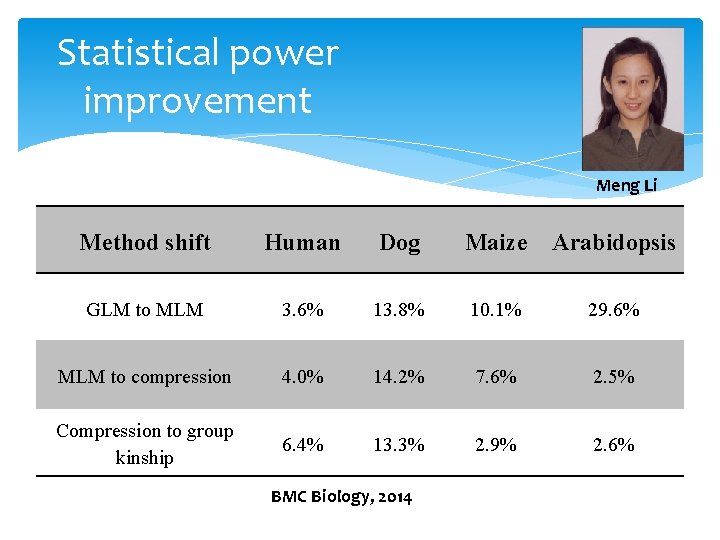
Statistical power improvement Meng Li Method shift Human Dog Maize Arabidopsis GLM to MLM 3. 6% 13. 8% 10. 1% 29. 6% MLM to compression 4. 0% 14. 2% 7. 6% 2. 5% Compression to group kinship 6. 4% 13. 3% 2. 9% 2. 6% BMC Biology, 2014
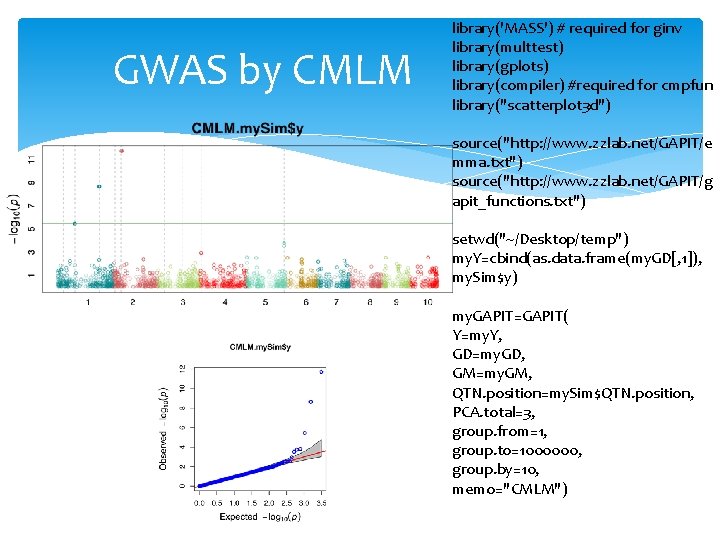
GWAS by CMLM library('MASS') # required for ginv library(multtest) library(gplots) library(compiler) #required for cmpfun library("scatterplot 3 d") source("http: //www. zzlab. net/GAPIT/e mma. txt") source("http: //www. zzlab. net/GAPIT/g apit_functions. txt") setwd("~/Desktop/temp") my. Y=cbind(as. data. frame(my. GD[, 1]), my. Sim$y) my. GAPIT=GAPIT( Y=my. Y, GD=my. GD, GM=my. GM, QTN. position=my. Sim$QTN. position, PCA. total=3, group. from=1, group. to=1000000, group. by=10, memo="CMLM")
Highlight Criticism on MLM CMLM ECMLM