Standard Costs and Operating Performance Measures Chapter 11


- Slides: 109
Standard Costs and Operating Performance Measures Chapter 11 © 2010 The Mc. Graw-Hill Companies, Inc.
Standard Costs Standards are benchmarks or “norms” for measuring performance. In managerial accounting, two types of standards are commonly used. Quantity standards specify how much of an input should be used to make a product or provide a service. Price standards specify how much should be paid for each unit of the input. Examples: Firestone, Sears, Mc. Donald’s, hospitals, construction and manufacturing companies. Mc. Graw-Hill/Irwin Slide 2
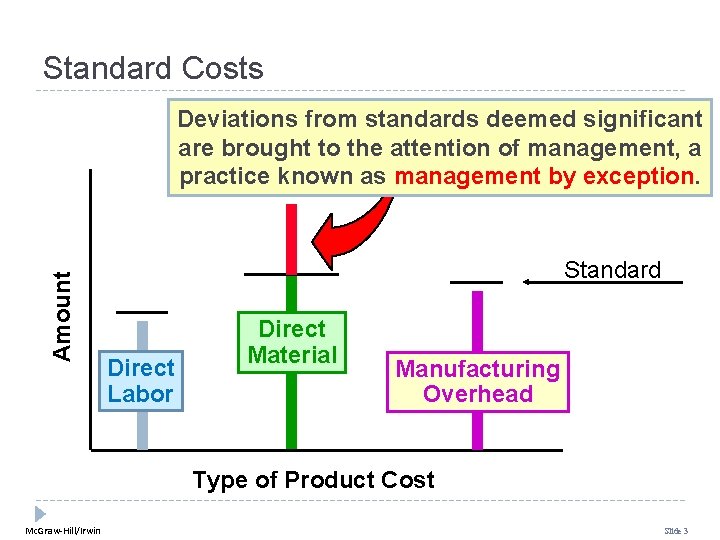
Standard Costs Amount Deviations from standards deemed significant are brought to the attention of management, a practice known as management by exception. Standard Direct Labor Direct Material Manufacturing Overhead Type of Product Cost Mc. Graw-Hill/Irwin Slide 3
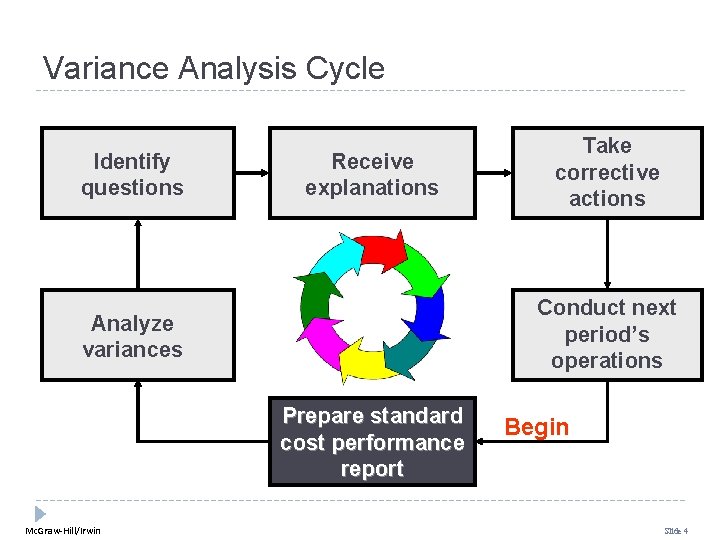
Variance Analysis Cycle Identify questions Receive explanations Conduct next period’s operations Analyze variances Prepare standard cost performance report Mc. Graw-Hill/Irwin Take corrective actions Begin Slide 4
Setting Standard Costs Accountants, engineers, purchasing agents, and production managers combine efforts to set standards that encourage efficient future operations. Mc. Graw-Hill/Irwin Slide 5
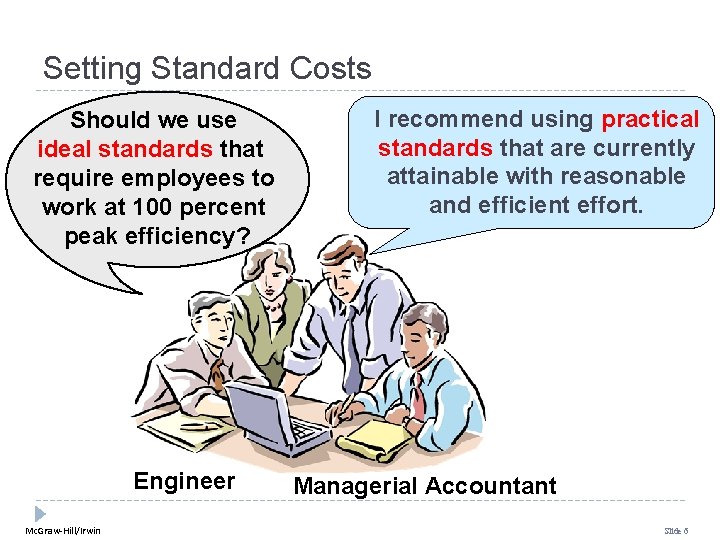
Setting Standard Costs Should we use ideal standards that require employees to work at 100 percent peak efficiency? Engineer Mc. Graw-Hill/Irwin I recommend using practical standards that are currently attainable with reasonable and efficient effort. Managerial Accountant Slide 6
Learning Objective 1 Explain how direct materials standards and direct labor standards are set. Mc. Graw-Hill/Irwin Slide 7
Setting Direct Material Standards Price Standards Quantity Standards Final, delivered cost of materials, net of discounts. Summarized in a Bill of Materials. Mc. Graw-Hill/Irwin Slide 8
Setting Standards Six Sigma advocates have sought to eliminate all defects and waste, rather than continually build them into standards. As a result allowances for waste and spoilage that are built into standards should be reduced over time. Mc. Graw-Hill/Irwin Slide 9
Setting Direct Labor Standards Rate Standards Time Standards Often a single rate is used that reflects the mix of wages earned. Use time and motion studies for each labor operation. Mc. Graw-Hill/Irwin Slide 10
Setting Variable Manufacturing Overhead Standards Rate Standards Quantity Standards The rate is the variable portion of the predetermined overhead rate. The quantity is the activity in the allocation base for predetermined overhead. Mc. Graw-Hill/Irwin Slide 11
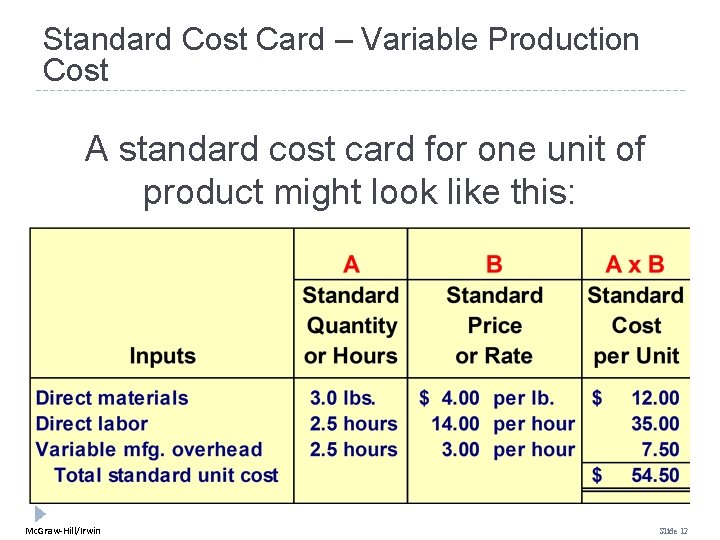
Standard Cost Card – Variable Production Cost A standard cost card for one unit of product might look like this: Mc. Graw-Hill/Irwin Slide 12
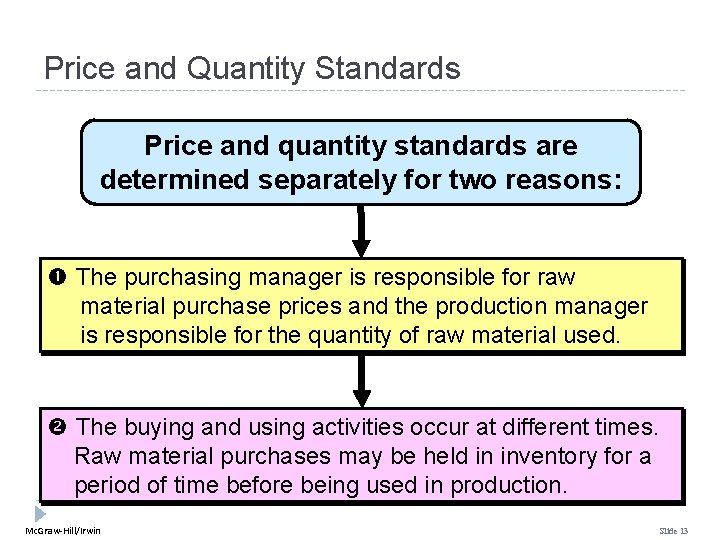
Price and Quantity Standards Price and quantity standards are determined separately for two reasons: The purchasing manager is responsible for raw material purchase prices and the production manager is responsible for the quantity of raw material used. The buying and using activities occur at different times. Raw material purchases may be held in inventory for a period of time before being used in production. Mc. Graw-Hill/Irwin Slide 13
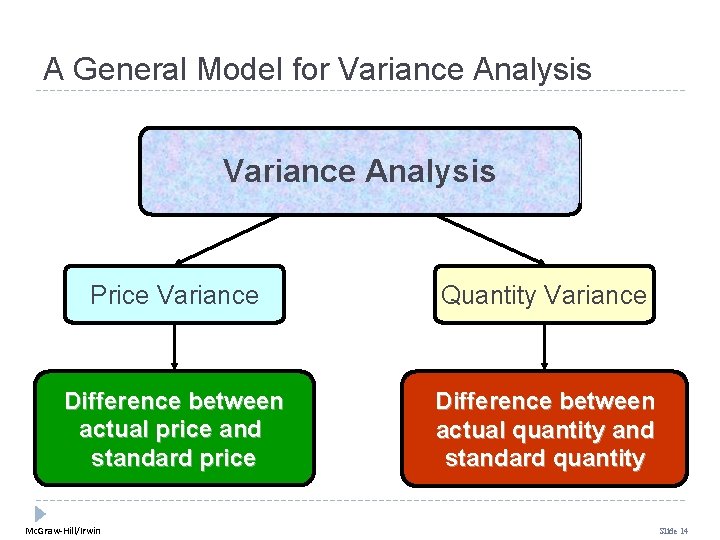
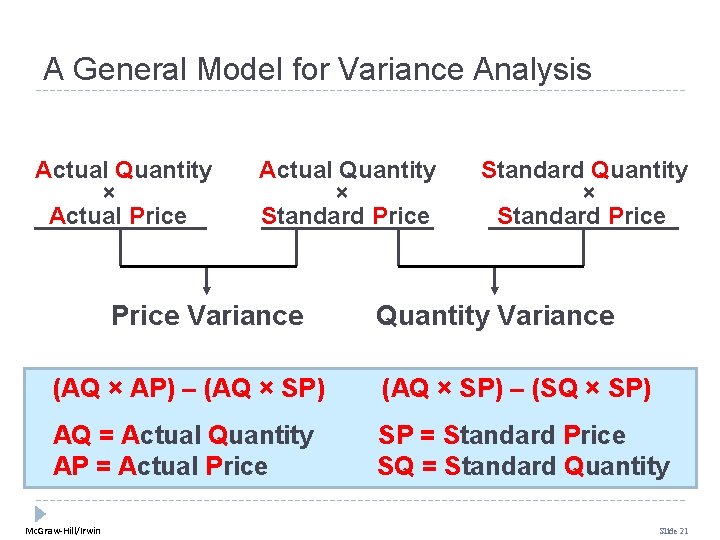
A General Model for Variance Analysis Price Variance Quantity Variance Difference between actual price and standard price Difference between actual quantity and standard quantity Mc. Graw-Hill/Irwin Slide 14
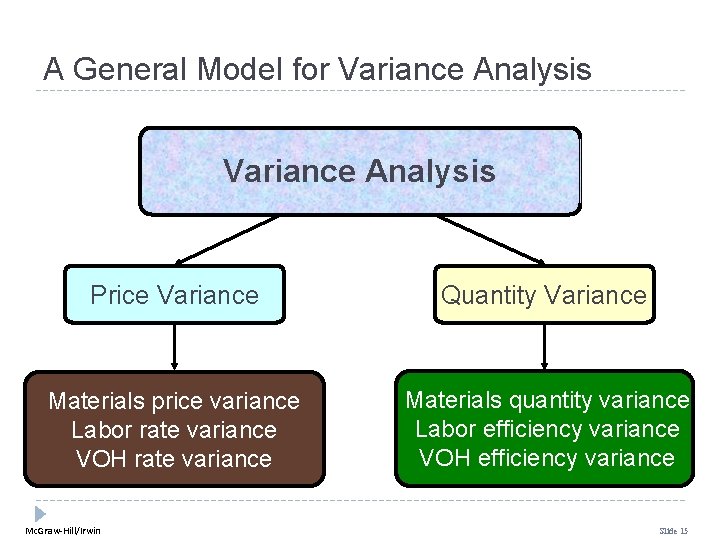
A General Model for Variance Analysis Price Variance Quantity Variance Materials price variance Labor rate variance VOH rate variance Materials quantity variance Labor efficiency variance VOH efficiency variance Mc. Graw-Hill/Irwin Slide 15
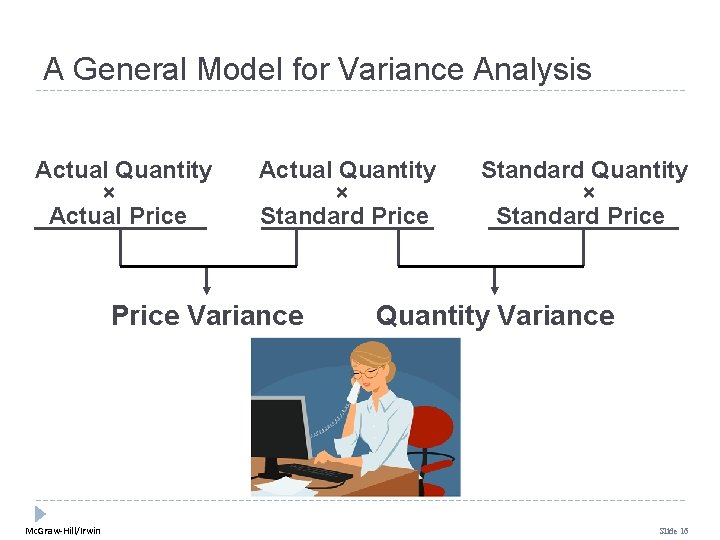
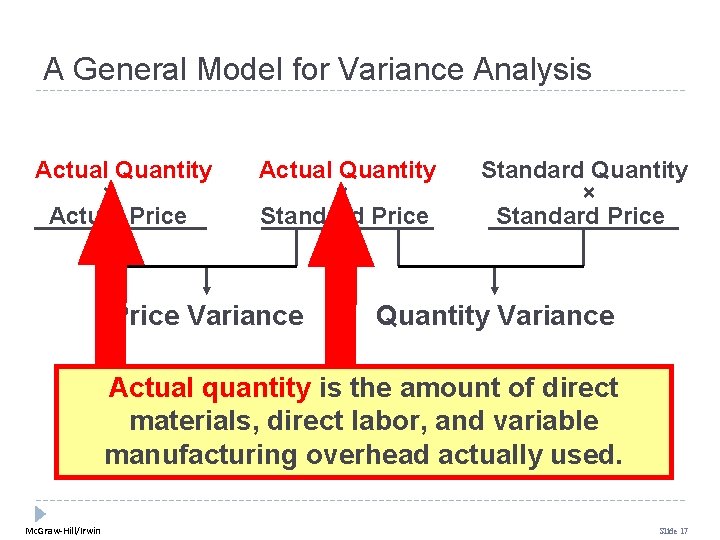
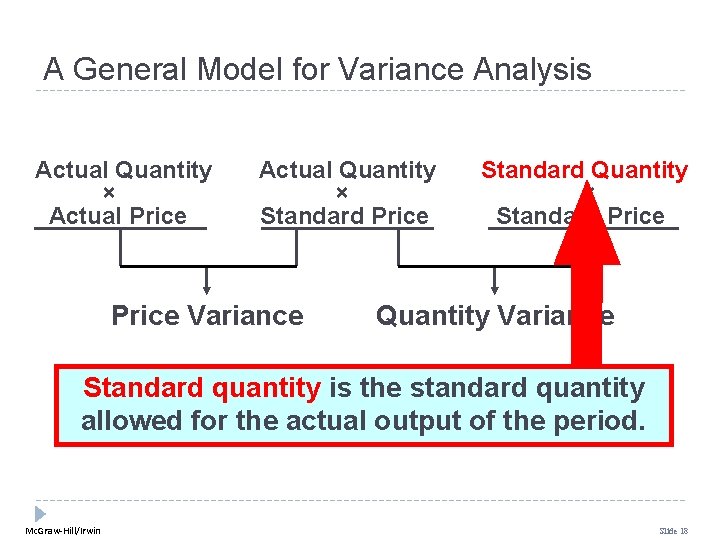
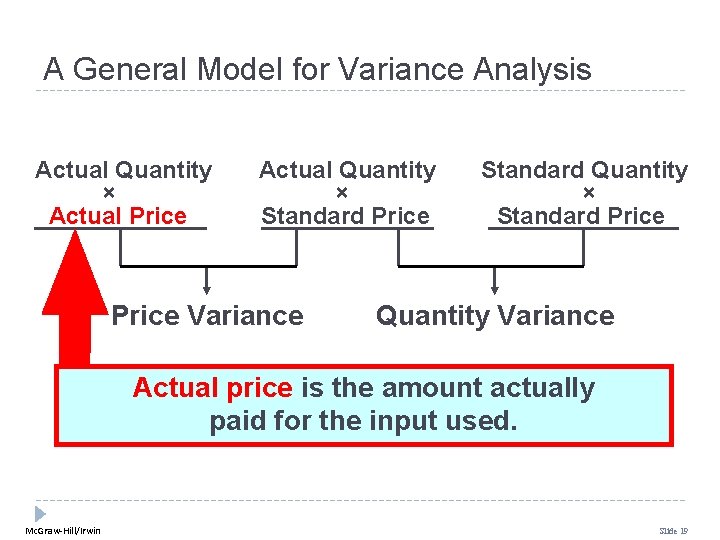
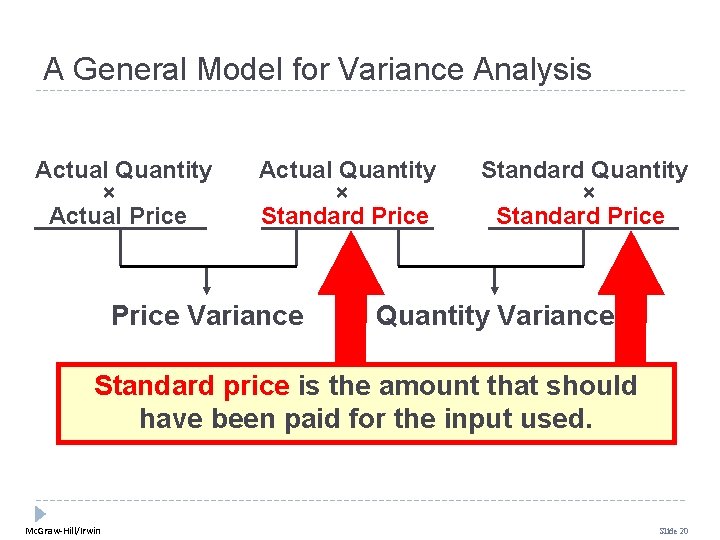
A General Model for Variance Analysis Actual Quantity × Actual Price Actual Quantity × Standard Price Variance Mc. Graw-Hill/Irwin Standard Quantity × Standard Price Quantity Variance Slide 16
A General Model for Variance Analysis Actual Quantity × Actual Price Actual Quantity × Standard Price Variance Standard Quantity × Standard Price Quantity Variance Actual quantity is the amount of direct materials, direct labor, and variable manufacturing overhead actually used. Mc. Graw-Hill/Irwin Slide 17
A General Model for Variance Analysis Actual Quantity × Actual Price Actual Quantity × Standard Price Variance Standard Quantity × Standard Price Quantity Variance Standard quantity is the standard quantity allowed for the actual output of the period. Mc. Graw-Hill/Irwin Slide 18
A General Model for Variance Analysis Actual Quantity × Actual Price Actual Quantity × Standard Price Variance Standard Quantity × Standard Price Quantity Variance Actual price is the amount actually paid for the input used. Mc. Graw-Hill/Irwin Slide 19
A General Model for Variance Analysis Actual Quantity × Actual Price Actual Quantity × Standard Price Variance Standard Quantity × Standard Price Quantity Variance Standard price is the amount that should have been paid for the input used. Mc. Graw-Hill/Irwin Slide 20
A General Model for Variance Analysis Actual Quantity × Actual Price Actual Quantity × Standard Price Variance Standard Quantity × Standard Price Quantity Variance (AQ × AP) – (AQ × SP) – (SQ × SP) AQ = Actual Quantity AP = Actual Price SP = Standard Price SQ = Standard Quantity Mc. Graw-Hill/Irwin Slide 21
Learning Objective 2 Compute the direct materials price and quantity variances and explain their significance. Mc. Graw-Hill/Irwin Slide 22
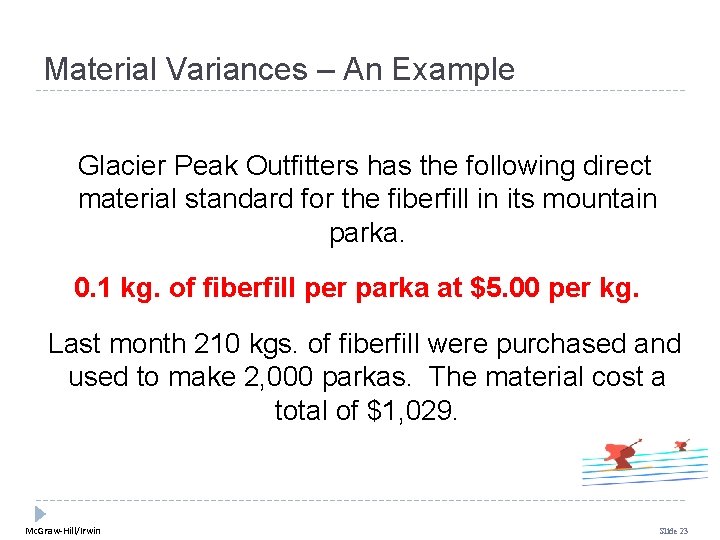
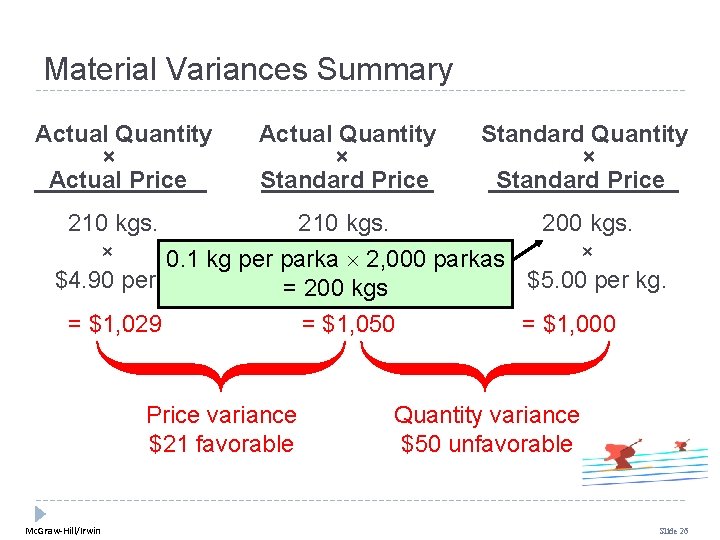
Material Variances – An Example Glacier Peak Outfitters has the following direct material standard for the fiberfill in its mountain parka. 0. 1 kg. of fiberfill per parka at $5. 00 per kg. Last month 210 kgs. of fiberfill were purchased and used to make 2, 000 parkas. The material cost a total of $1, 029. Mc. Graw-Hill/Irwin Slide 23
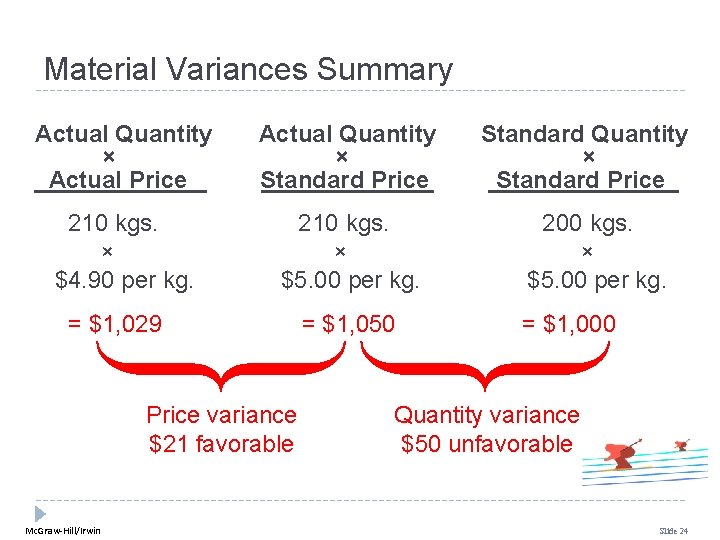
Material Variances Summary Actual Quantity × Actual Price Actual Quantity × Standard Price 210 kgs. × $4. 90 per kg. 210 kgs. × $5. 00 per kg. = $1, 029 Price variance $21 favorable Mc. Graw-Hill/Irwin = $1, 050 Standard Quantity × Standard Price 200 kgs. × $5. 00 per kg. = $1, 000 Quantity variance $50 unfavorable Slide 24
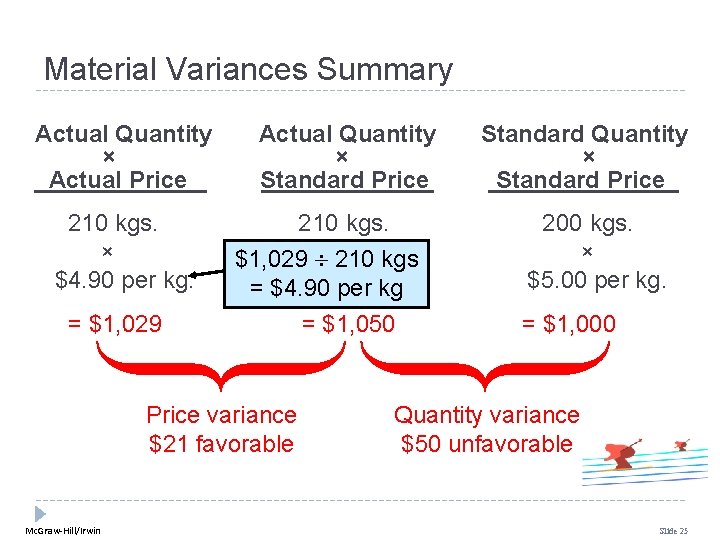
Material Variances Summary Actual Quantity × Actual Price 210 kgs. × $4. 90 per kg. Actual Quantity × Standard Price 210 kgs. $1, 029 × 210 kgs $5. 00 per perkg kg. = $4. 90 = $1, 029 Price variance $21 favorable Mc. Graw-Hill/Irwin = $1, 050 Standard Quantity × Standard Price 200 kgs. × $5. 00 per kg. = $1, 000 Quantity variance $50 unfavorable Slide 25
Material Variances Summary Actual Quantity × Actual Price Actual Quantity × Standard Price Standard Quantity × Standard Price 210 kgs. 200 kgs. × × 0. 1 kg per parka× 2, 000 parkas $4. 90 per kg. $5. 00 per kg. = 200 per kgs kg. = $1, 029 Price variance $21 favorable Mc. Graw-Hill/Irwin = $1, 050 = $1, 000 Quantity variance $50 unfavorable Slide 26
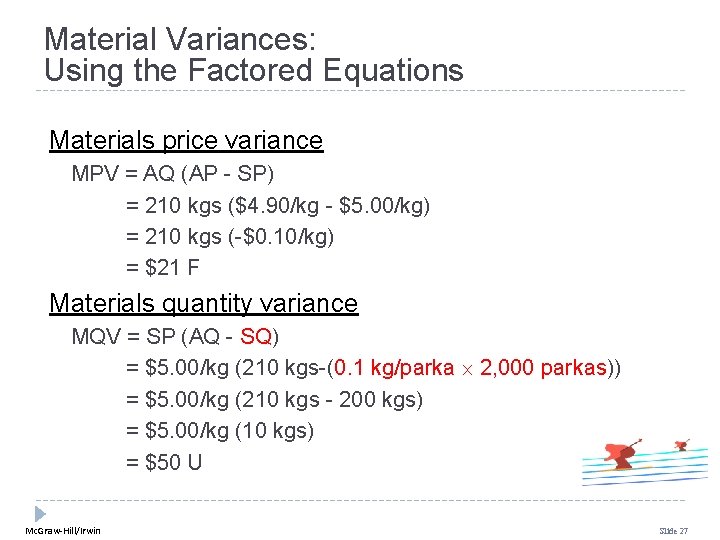
Material Variances: Using the Factored Equations Materials price variance MPV = AQ (AP - SP) = 210 kgs ($4. 90/kg - $5. 00/kg) = 210 kgs (-$0. 10/kg) = $21 F Materials quantity variance MQV = SP (AQ - SQ) = $5. 00/kg (210 kgs-(0. 1 kg/parka 2, 000 parkas)) = $5. 00/kg (210 kgs - 200 kgs) = $5. 00/kg (10 kgs) = $50 U Mc. Graw-Hill/Irwin Slide 27
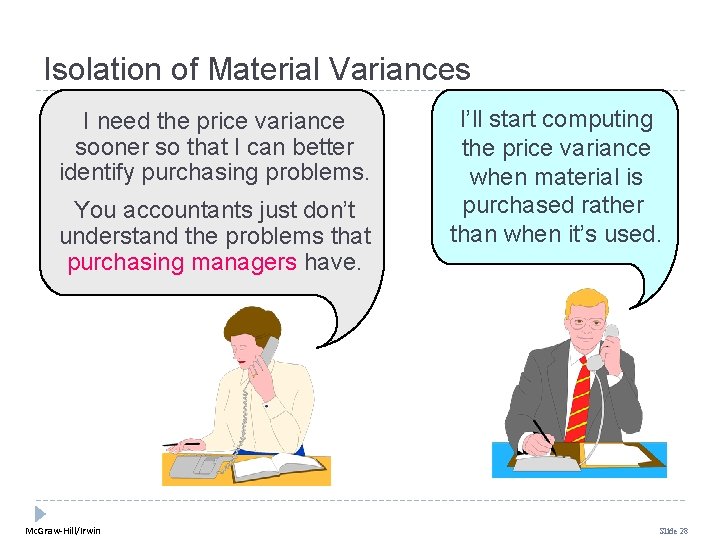
Isolation of Material Variances I need the price variance sooner so that I can better identify purchasing problems. You accountants just don’t understand the problems that purchasing managers have. Mc. Graw-Hill/Irwin I’ll start computing the price variance when material is purchased rather than when it’s used. Slide 28
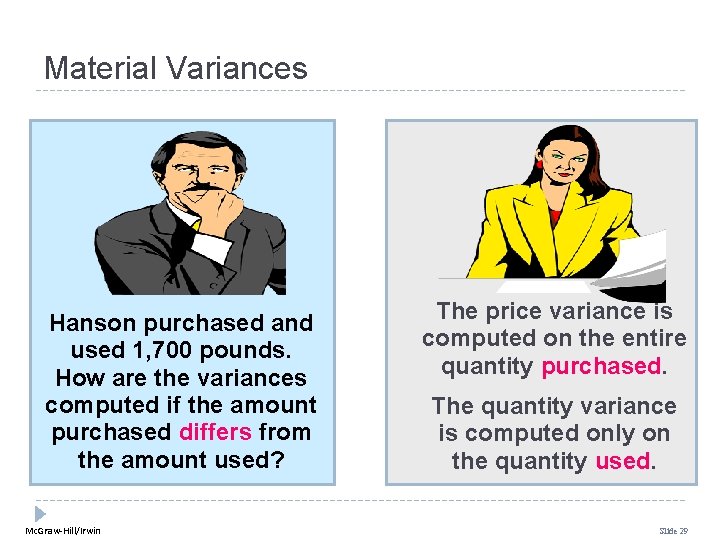
Material Variances Hanson purchased and used 1, 700 pounds. How are the variances computed if the amount purchased differs from the amount used? Mc. Graw-Hill/Irwin The price variance is computed on the entire quantity purchased. The quantity variance is computed only on the quantity used. Slide 29
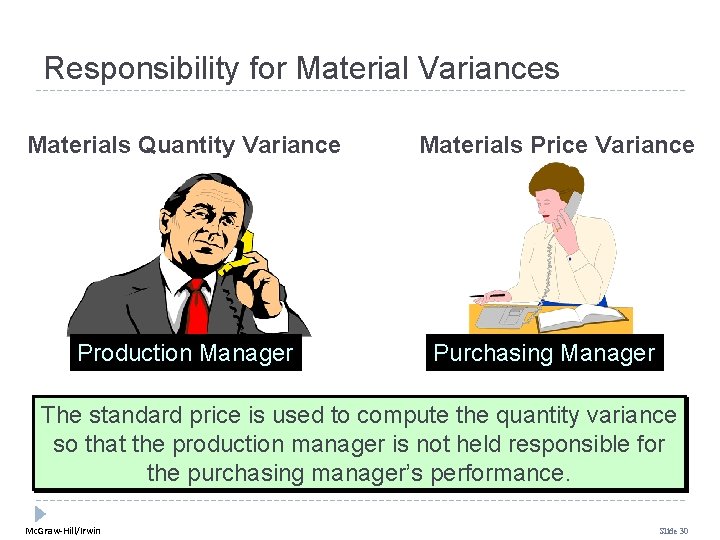
Responsibility for Material Variances Materials Quantity Variance Production Manager Materials Price Variance Purchasing Manager The standard price is used to compute the quantity variance so that the production manager is not held responsible for the purchasing manager’s performance. Mc. Graw-Hill/Irwin Slide 30
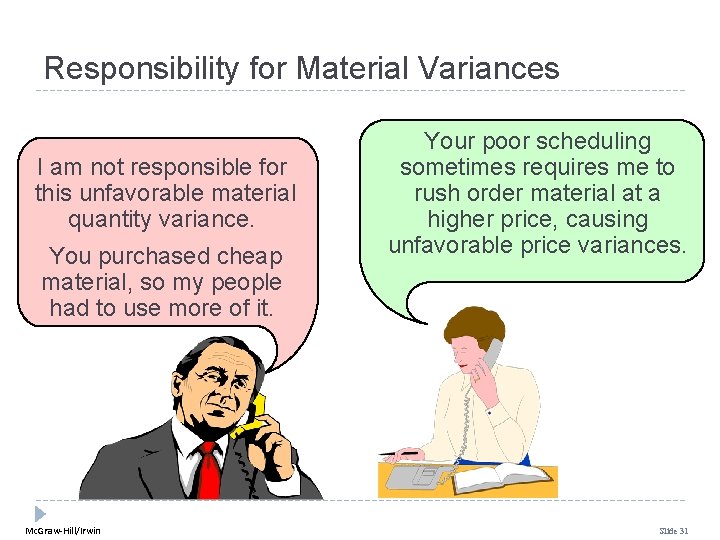
Responsibility for Material Variances I am not responsible for this unfavorable material quantity variance. You purchased cheap material, so my people had to use more of it. Mc. Graw-Hill/Irwin Your poor scheduling sometimes requires me to rush order material at a higher price, causing unfavorable price variances. Slide 31
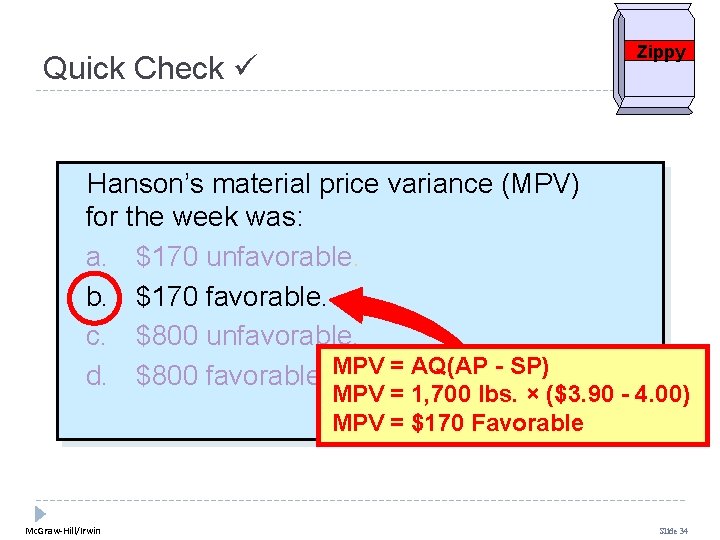
Quick Check Zippy Hanson Inc. has the following direct material standard to manufacture one Zippy: 1. 5 pounds per Zippy at $4. 00 per pound Last week, 1, 700 pounds of material were purchased and used to make 1, 000 Zippies. The material cost a total of $6, 630. Mc. Graw-Hill/Irwin Slide 32
Quick Check Zippy Hanson’s material price variance (MPV) for the week was: a. $170 unfavorable. b. $170 favorable. c. $800 unfavorable. d. $800 favorable. Mc. Graw-Hill/Irwin Slide 33
Zippy Quick Check Hanson’s material price variance (MPV) for the week was: a. $170 unfavorable. b. $170 favorable. c. $800 unfavorable. d. $800 favorable. MPV = AQ(AP - SP) MPV = 1, 700 lbs. × ($3. 90 - 4. 00) MPV = $170 Favorable Mc. Graw-Hill/Irwin Slide 34
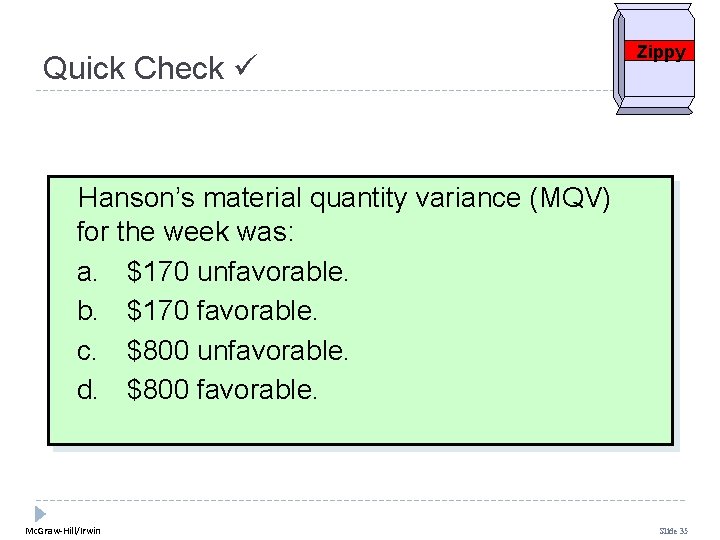
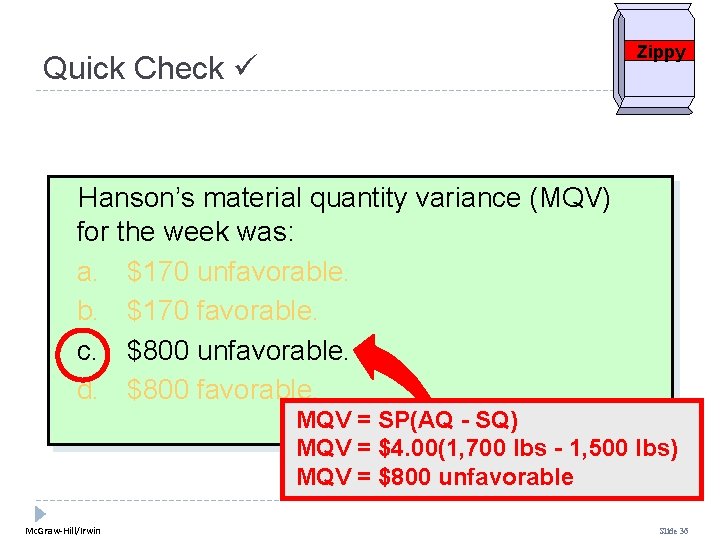
Quick Check Zippy Hanson’s material quantity variance (MQV) for the week was: a. $170 unfavorable. b. $170 favorable. c. $800 unfavorable. d. $800 favorable. Mc. Graw-Hill/Irwin Slide 35
Zippy Quick Check Hanson’s material quantity variance (MQV) for the week was: a. $170 unfavorable. b. $170 favorable. c. $800 unfavorable. d. $800 favorable. MQV = SP(AQ - SQ) MQV = $4. 00(1, 700 lbs - 1, 500 lbs) MQV = $800 unfavorable Mc. Graw-Hill/Irwin Slide 36
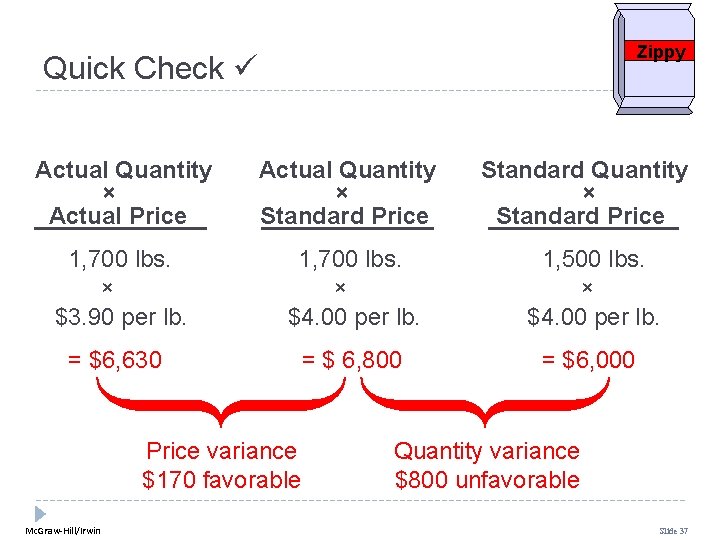
Zippy Quick Check Actual Quantity × Actual Price Actual Quantity × Standard Price 1, 700 lbs. × $3. 90 per lb. 1, 700 lbs. × $4. 00 per lb. 1, 500 lbs. × $4. 00 per lb. = $6, 630 = $ 6, 800 = $6, 000 Price variance $170 favorable Mc. Graw-Hill/Irwin Standard Quantity × Standard Price Quantity variance $800 unfavorable Slide 37
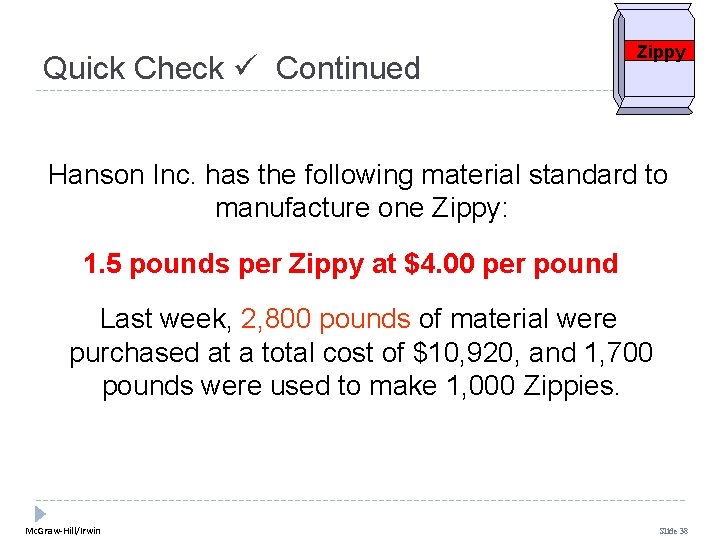
Quick Check Continued Zippy Hanson Inc. has the following material standard to manufacture one Zippy: 1. 5 pounds per Zippy at $4. 00 per pound Last week, 2, 800 pounds of material were purchased at a total cost of $10, 920, and 1, 700 pounds were used to make 1, 000 Zippies. Mc. Graw-Hill/Irwin Slide 38
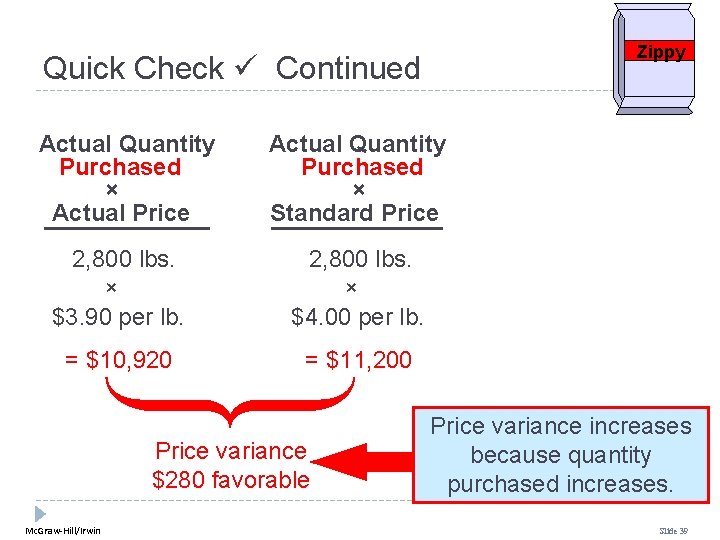
Zippy Quick Check Continued Actual Quantity Purchased × Actual Price Actual Quantity Purchased × Standard Price 2, 800 lbs. × $3. 90 per lb. 2, 800 lbs. × $4. 00 per lb. = $10, 920 = $11, 200 Price variance $280 favorable Mc. Graw-Hill/Irwin Price variance increases because quantity purchased increases. Slide 39
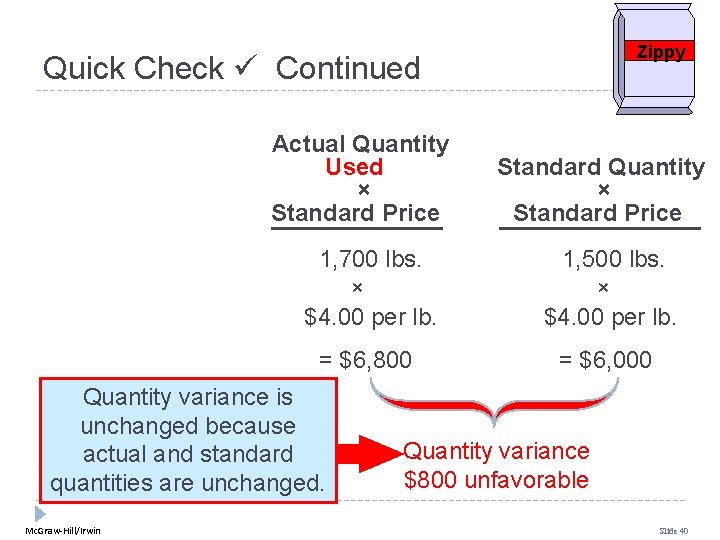
Zippy Quick Check Continued Actual Quantity Used × Standard Price 1, 700 lbs. × $4. 00 per lb. 1, 500 lbs. × $4. 00 per lb. = $6, 800 = $6, 000 Quantity variance is unchanged because actual and standard quantities are unchanged. Mc. Graw-Hill/Irwin Standard Quantity × Standard Price Quantity variance $800 unfavorable Slide 40
Learning Objective 3 Compute the direct labor rate and efficiency variances and explain their significance. Mc. Graw-Hill/Irwin Slide 41
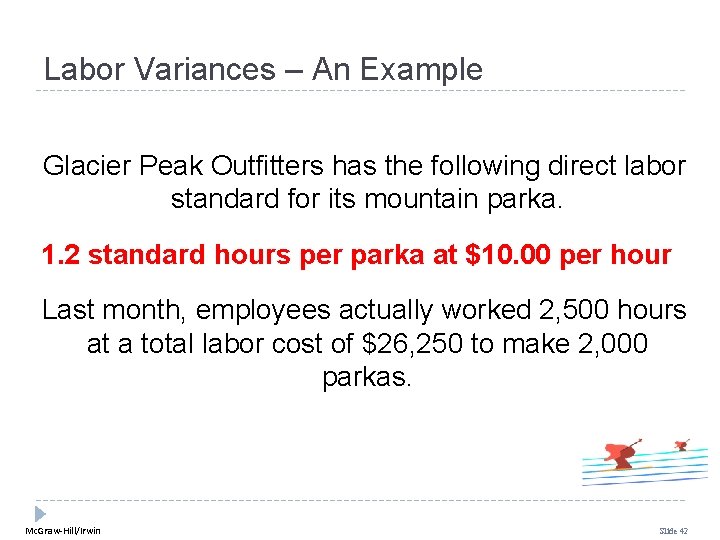
Labor Variances – An Example Glacier Peak Outfitters has the following direct labor standard for its mountain parka. 1. 2 standard hours per parka at $10. 00 per hour Last month, employees actually worked 2, 500 hours at a total labor cost of $26, 250 to make 2, 000 parkas. Mc. Graw-Hill/Irwin Slide 42
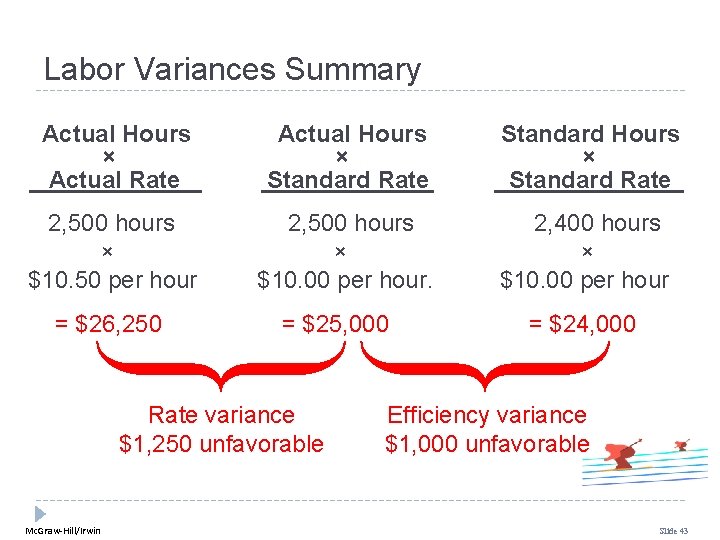
Labor Variances Summary Actual Hours × Actual Rate Actual Hours × Standard Rate Standard Hours × Standard Rate 2, 500 hours × $10. 50 per hour 2, 500 hours × $10. 00 per hour. 2, 400 hours × $10. 00 per hour = $26, 250 = $25, 000 Rate variance $1, 250 unfavorable Mc. Graw-Hill/Irwin = $24, 000 Efficiency variance $1, 000 unfavorable Slide 43
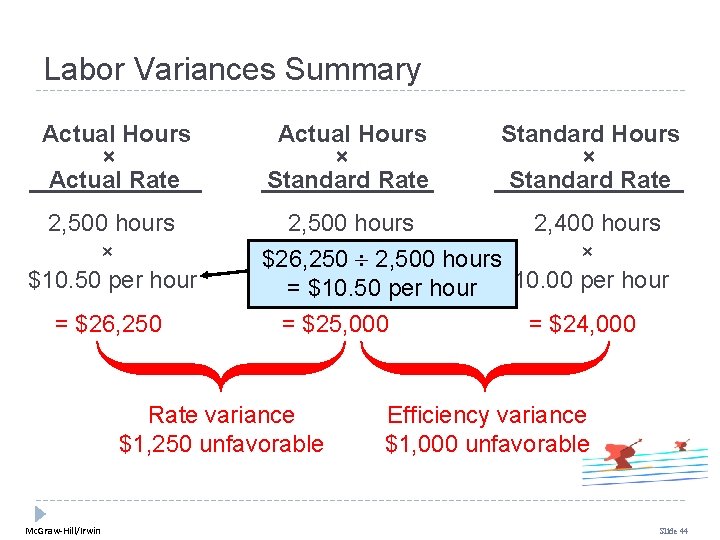
Labor Variances Summary Actual Hours × Actual Rate 2, 500 hours × $10. 50 per hour = $26, 250 Actual Hours × Standard Rate 2, 500 hours 2, 400 hours × 2, 500 hours × $26, 250 $10. 00 per hour. = $10. 50 per hour $10. 00 per hour = $25, 000 Rate variance $1, 250 unfavorable Mc. Graw-Hill/Irwin Standard Hours × Standard Rate = $24, 000 Efficiency variance $1, 000 unfavorable Slide 44
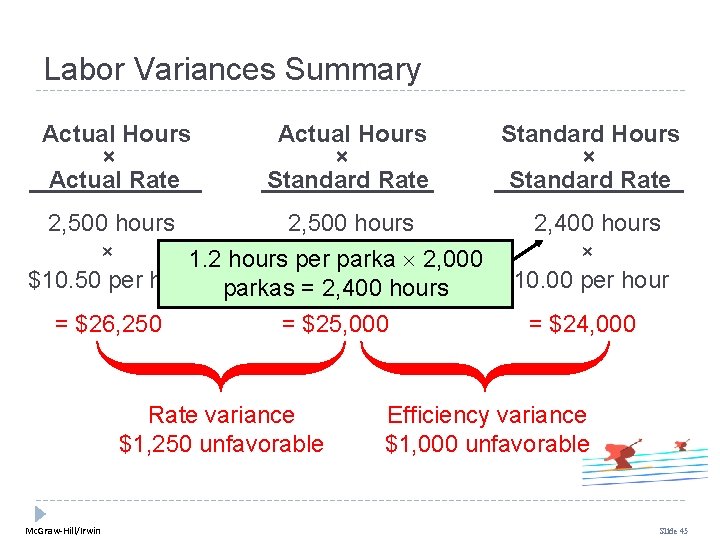
Labor Variances Summary Actual Hours × Actual Rate Actual Hours × Standard Rate Standard Hours × Standard Rate 2, 500 hours 2, 400 hours × × 1. 2 hours per × parka 2, 000 $10. 50 per hour parkas $10. 00 per hour = 2, 400 hours = $26, 250 = $25, 000 Rate variance $1, 250 unfavorable Mc. Graw-Hill/Irwin = $24, 000 Efficiency variance $1, 000 unfavorable Slide 45
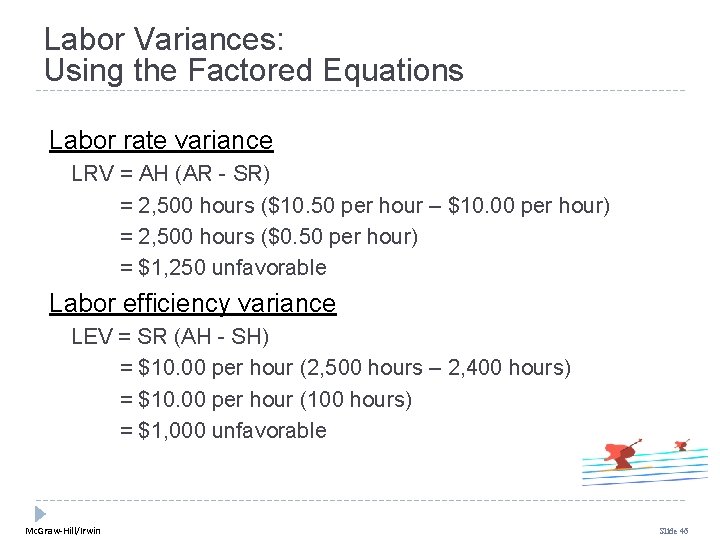
Labor Variances: Using the Factored Equations Labor rate variance LRV = AH (AR - SR) = 2, 500 hours ($10. 50 per hour – $10. 00 per hour) = 2, 500 hours ($0. 50 per hour) = $1, 250 unfavorable Labor efficiency variance LEV = SR (AH - SH) = $10. 00 per hour (2, 500 hours – 2, 400 hours) = $10. 00 per hour (100 hours) = $1, 000 unfavorable Mc. Graw-Hill/Irwin Slide 46
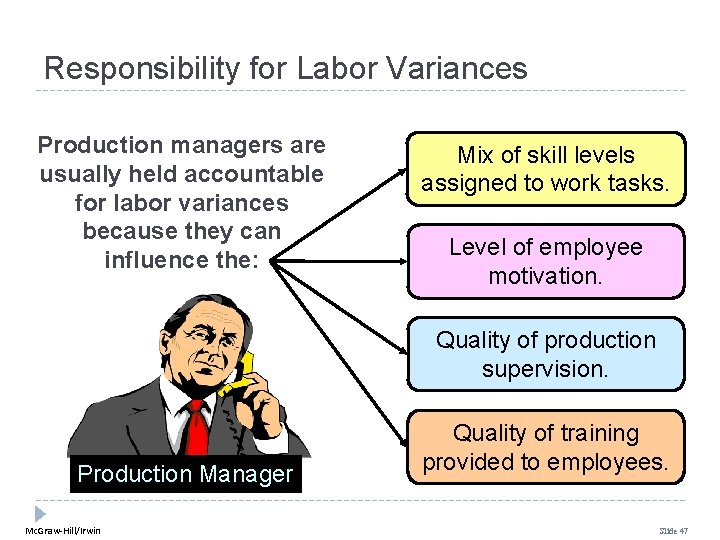
Responsibility for Labor Variances Production managers are usually held accountable for labor variances because they can influence the: Mix of skill levels assigned to work tasks. Level of employee motivation. Quality of production supervision. Production Manager Mc. Graw-Hill/Irwin Quality of training provided to employees. Slide 47
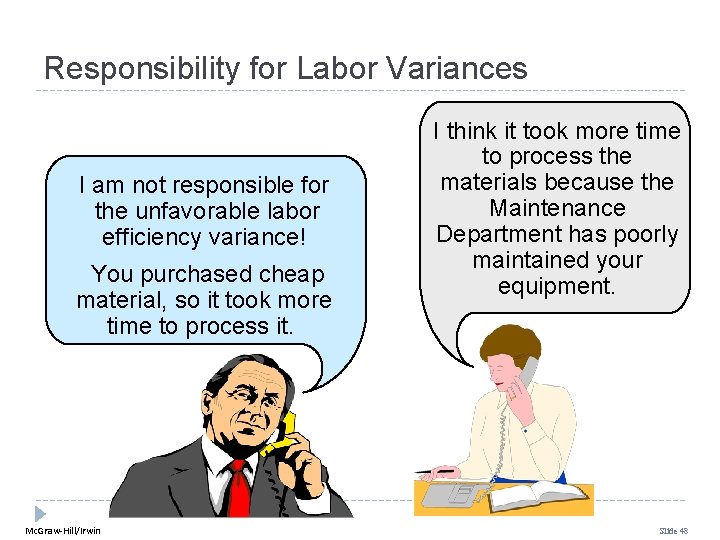
Responsibility for Labor Variances I am not responsible for the unfavorable labor efficiency variance! You purchased cheap material, so it took more time to process it. Mc. Graw-Hill/Irwin I think it took more time to process the materials because the Maintenance Department has poorly maintained your equipment. Slide 48
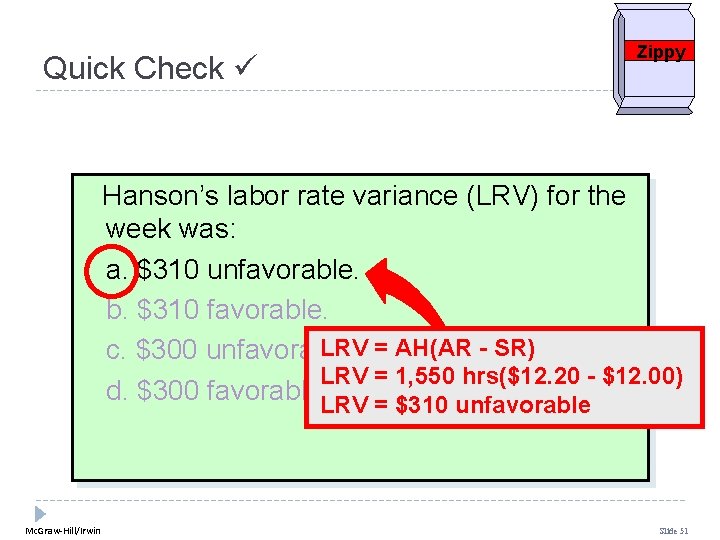
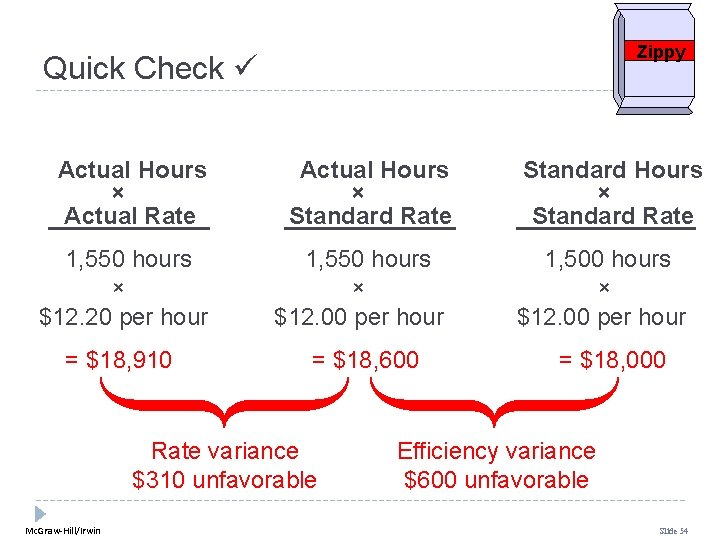
Quick Check Zippy Hanson Inc. has the following direct labor standard to manufacture one Zippy: 1. 5 standard hours per Zippy at $12. 00 per direct labor hour Last week, 1, 550 direct labor hours were worked at a total labor cost of $18, 910 to make 1, 000 Zippies. Mc. Graw-Hill/Irwin Slide 49
Quick Check Zippy Hanson’s labor rate variance (LRV) for the week was: a. $310 unfavorable. b. $310 favorable. c. $300 unfavorable. d. $300 favorable. Mc. Graw-Hill/Irwin Slide 50
Quick Check Zippy Hanson’s labor rate variance (LRV) for the week was: a. $310 unfavorable. b. $310 favorable. LRV = AH(AR - SR) c. $300 unfavorable. LRV = 1, 550 hrs($12. 20 - $12. 00) d. $300 favorable. LRV = $310 unfavorable Mc. Graw-Hill/Irwin Slide 51
Quick Check Zippy Hanson’s labor efficiency variance (LEV) for the week was: a. $590 unfavorable. b. $590 favorable. c. $600 unfavorable. d. $600 favorable. Mc. Graw-Hill/Irwin Slide 52
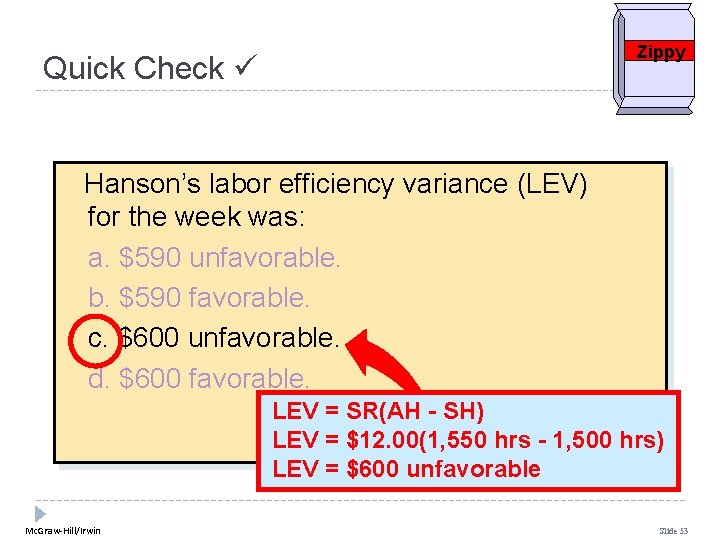
Zippy Quick Check Hanson’s labor efficiency variance (LEV) for the week was: a. $590 unfavorable. b. $590 favorable. c. $600 unfavorable. d. $600 favorable. LEV = SR(AH - SH) LEV = $12. 00(1, 550 hrs - 1, 500 hrs) LEV = $600 unfavorable Mc. Graw-Hill/Irwin Slide 53
Zippy Quick Check Actual Hours × Actual Rate Actual Hours × Standard Rate 1, 550 hours × $12. 20 per hour 1, 550 hours × $12. 00 per hour = $18, 910 = $18, 600 Rate variance $310 unfavorable Mc. Graw-Hill/Irwin Standard Hours × Standard Rate 1, 500 hours × $12. 00 per hour = $18, 000 Efficiency variance $600 unfavorable Slide 54
Learning Objective 4 Compute the variable manufacturing overhead rate and efficiency variances. Mc. Graw-Hill/Irwin Slide 55
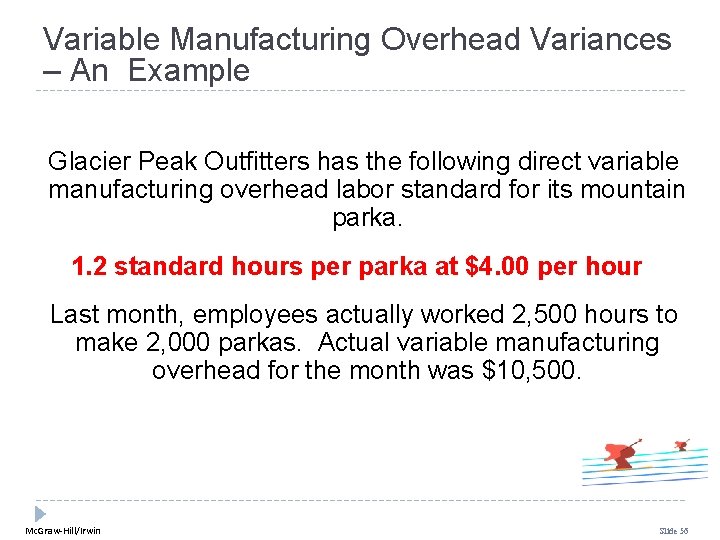
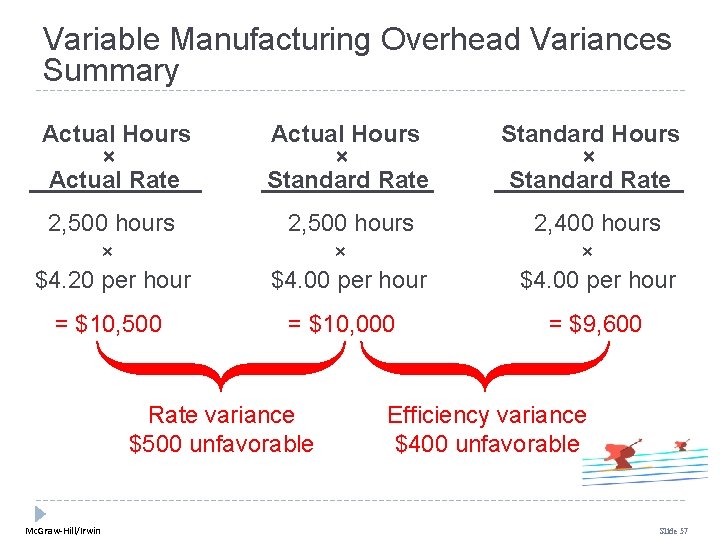
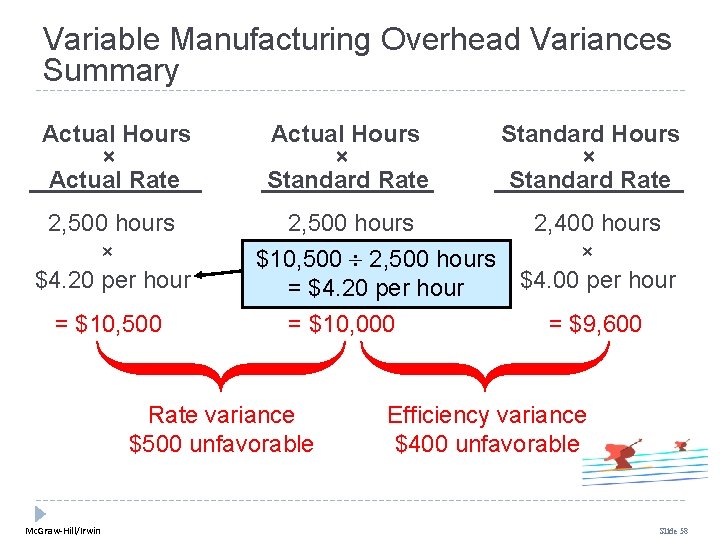
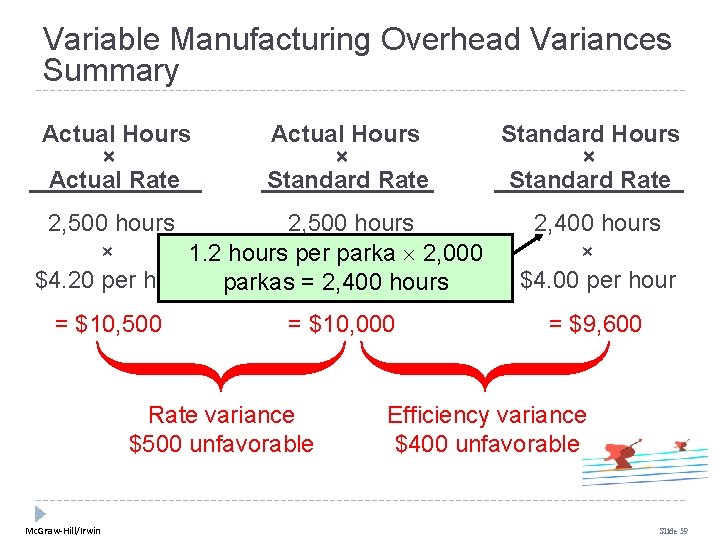
Variable Manufacturing Overhead Variances – An Example Glacier Peak Outfitters has the following direct variable manufacturing overhead labor standard for its mountain parka. 1. 2 standard hours per parka at $4. 00 per hour Last month, employees actually worked 2, 500 hours to make 2, 000 parkas. Actual variable manufacturing overhead for the month was $10, 500. Mc. Graw-Hill/Irwin Slide 56
Variable Manufacturing Overhead Variances Summary Actual Hours × Actual Rate Actual Hours × Standard Rate Standard Hours × Standard Rate 2, 500 hours × $4. 20 per hour 2, 500 hours × $4. 00 per hour 2, 400 hours × $4. 00 per hour = $10, 500 = $10, 000 = $9, 600 Rate variance $500 unfavorable Mc. Graw-Hill/Irwin Efficiency variance $400 unfavorable Slide 57
Variable Manufacturing Overhead Variances Summary Actual Hours × Actual Rate 2, 500 hours × $4. 20 per hour = $10, 500 Actual Hours × Standard Rate 2, 500 hours 2, 400 hours × $10, 500× 2, 500 hours $4. 00 per hour = $4. 20 = $10, 000 Rate variance $500 unfavorable Mc. Graw-Hill/Irwin Standard Hours × Standard Rate = $9, 600 Efficiency variance $400 unfavorable Slide 58
Variable Manufacturing Overhead Variances Summary Actual Hours × Actual Rate Actual Hours × Standard Rate 2, 500 hours × 1. 2 hours per × parka 2, 000 $4. 20 per hour parkas $4. 00 per hour = 2, 400 hours = $10, 500 = $10, 000 Rate variance $500 unfavorable Mc. Graw-Hill/Irwin Standard Hours × Standard Rate 2, 400 hours × $4. 00 per hour = $9, 600 Efficiency variance $400 unfavorable Slide 59
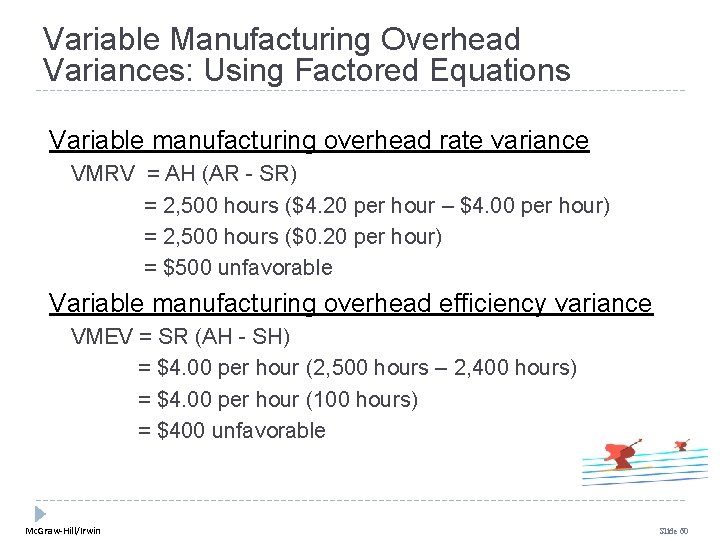
Variable Manufacturing Overhead Variances: Using Factored Equations Variable manufacturing overhead rate variance VMRV = AH (AR - SR) = 2, 500 hours ($4. 20 per hour – $4. 00 per hour) = 2, 500 hours ($0. 20 per hour) = $500 unfavorable Variable manufacturing overhead efficiency variance VMEV = SR (AH - SH) = $4. 00 per hour (2, 500 hours – 2, 400 hours) = $4. 00 per hour (100 hours) = $400 unfavorable Mc. Graw-Hill/Irwin Slide 60
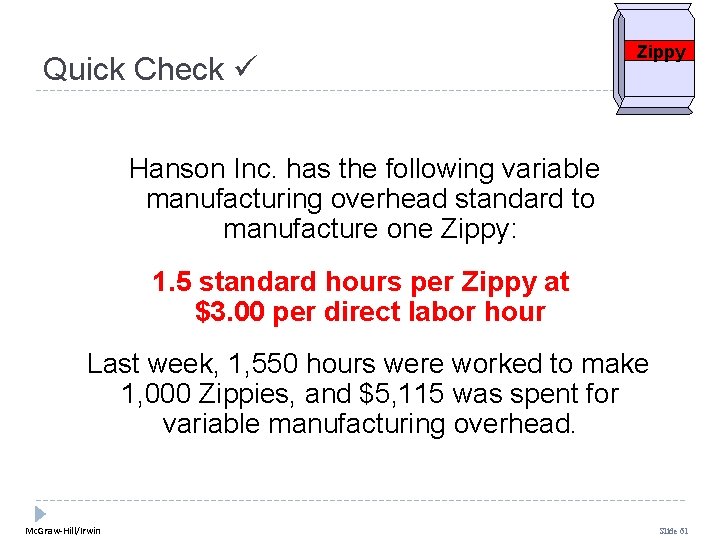
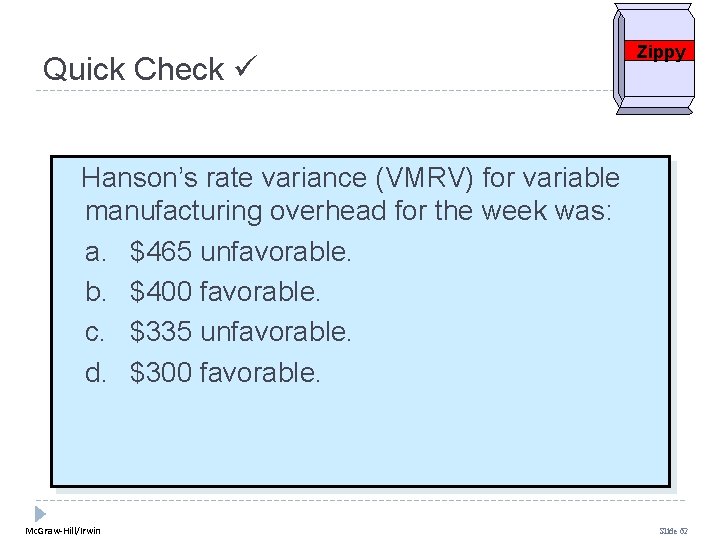
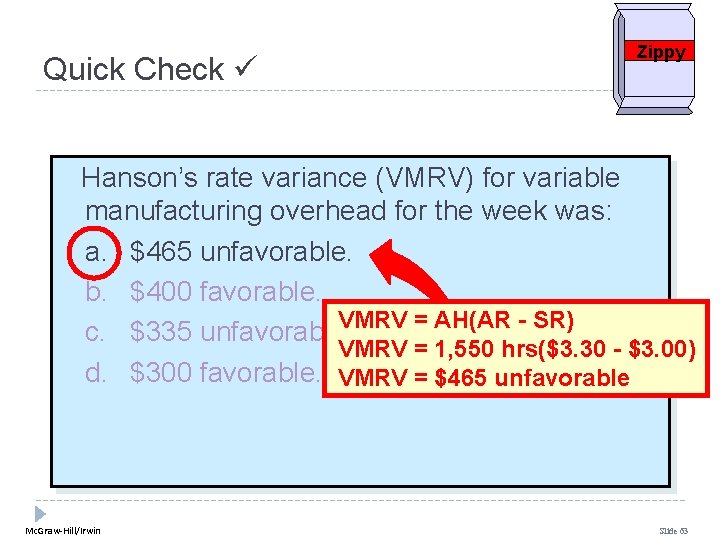
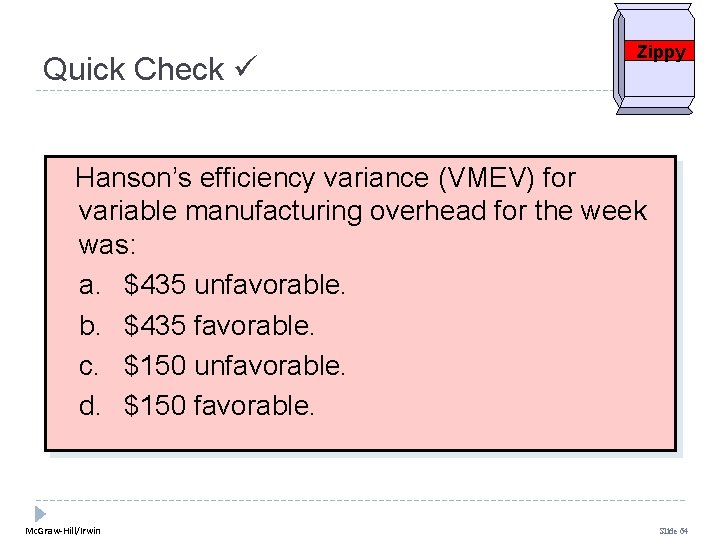
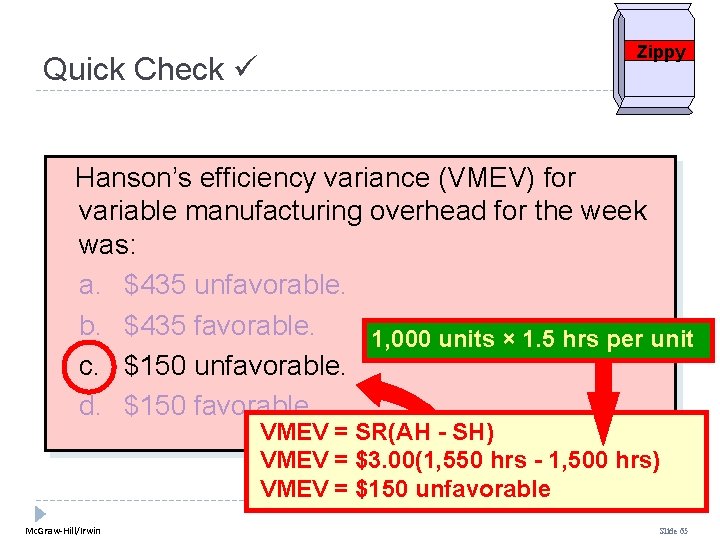
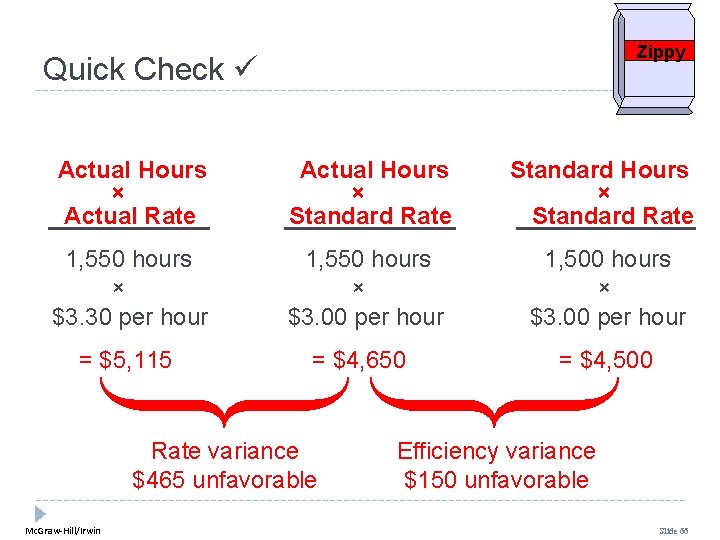
Quick Check Zippy Hanson Inc. has the following variable manufacturing overhead standard to manufacture one Zippy: 1. 5 standard hours per Zippy at $3. 00 per direct labor hour Last week, 1, 550 hours were worked to make 1, 000 Zippies, and $5, 115 was spent for variable manufacturing overhead. Mc. Graw-Hill/Irwin Slide 61
Quick Check Zippy Hanson’s rate variance (VMRV) for variable manufacturing overhead for the week was: a. $465 unfavorable. b. $400 favorable. c. $335 unfavorable. d. $300 favorable. Mc. Graw-Hill/Irwin Slide 62
Quick Check Zippy Hanson’s rate variance (VMRV) for variable manufacturing overhead for the week was: a. $465 unfavorable. b. $400 favorable. VMRV = AH(AR - SR) c. $335 unfavorable. VMRV = 1, 550 hrs($3. 30 - $3. 00) d. $300 favorable. VMRV = $465 unfavorable Mc. Graw-Hill/Irwin Slide 63
Quick Check Zippy Hanson’s efficiency variance (VMEV) for variable manufacturing overhead for the week was: a. $435 unfavorable. b. $435 favorable. c. $150 unfavorable. d. $150 favorable. Mc. Graw-Hill/Irwin Slide 64
Quick Check Zippy Hanson’s efficiency variance (VMEV) for variable manufacturing overhead for the week was: a. $435 unfavorable. b. $435 favorable. 1, 000 units × 1. 5 hrs per unit c. $150 unfavorable. d. $150 favorable. VMEV = SR(AH - SH) VMEV = $3. 00(1, 550 hrs - 1, 500 hrs) VMEV = $150 unfavorable Mc. Graw-Hill/Irwin Slide 65
Zippy Quick Check Actual Hours × Actual Rate Actual Hours × Standard Rate Standard Hours × Standard Rate 1, 550 hours × $3. 30 per hour 1, 550 hours × $3. 00 per hour 1, 500 hours × $3. 00 per hour = $5, 115 = $4, 650 = $4, 500 Rate variance $465 unfavorable Mc. Graw-Hill/Irwin Efficiency variance $150 unfavorable Slide 66
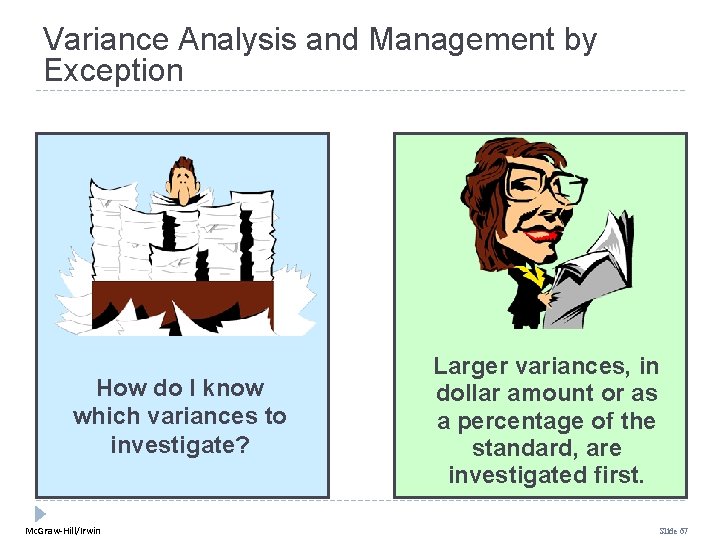
Variance Analysis and Management by Exception How do I know which variances to investigate? Mc. Graw-Hill/Irwin Larger variances, in dollar amount or as a percentage of the standard, are investigated first. Slide 67
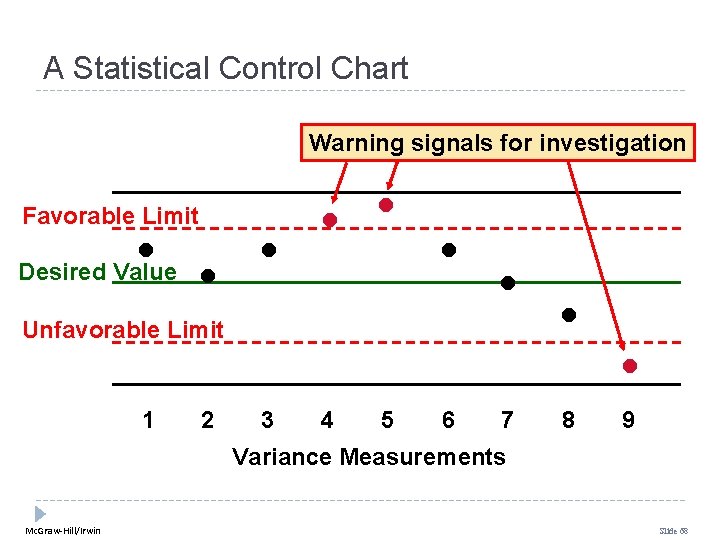
A Statistical Control Chart Warning signals for investigation Favorable Limit • Desired Value • • • Unfavorable Limit 1 2 3 4 5 6 7 • 8 • 9 Variance Measurements Mc. Graw-Hill/Irwin Slide 68
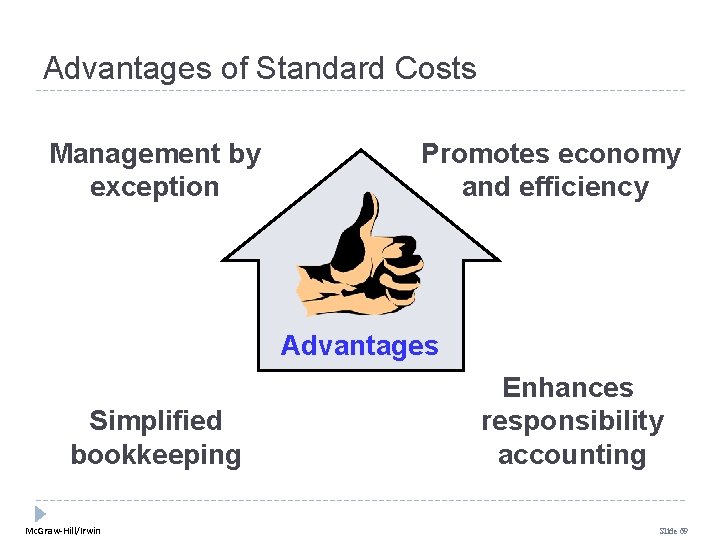
Advantages of Standard Costs Management by exception Promotes economy and efficiency Advantages Simplified bookkeeping Mc. Graw-Hill/Irwin Enhances responsibility accounting Slide 69
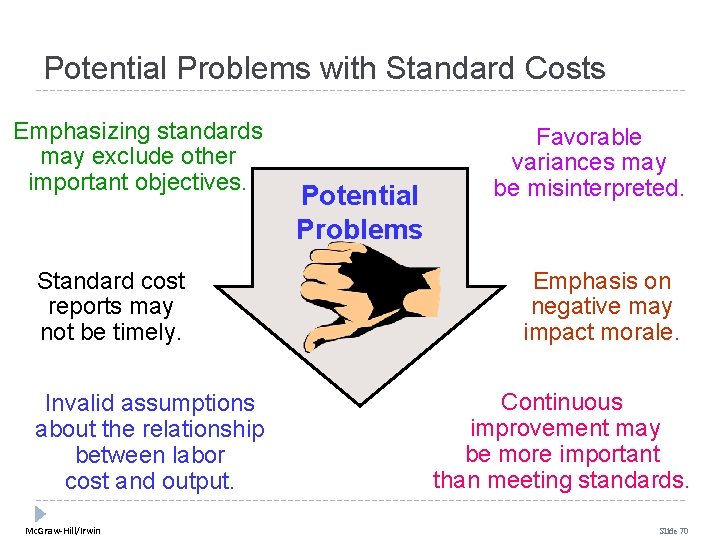
Potential Problems with Standard Costs Emphasizing standards may exclude other important objectives. Standard cost reports may not be timely. Invalid assumptions about the relationship between labor cost and output. Mc. Graw-Hill/Irwin Potential Problems Favorable variances may be misinterpreted. Emphasis on negative may impact morale. Continuous improvement may be more important than meeting standards. Slide 70
Learning Objective 5 Compute delivery cycle time, throughput time, and manufacturing cycle efficiency (MCE). Mc. Graw-Hill/Irwin Slide 71
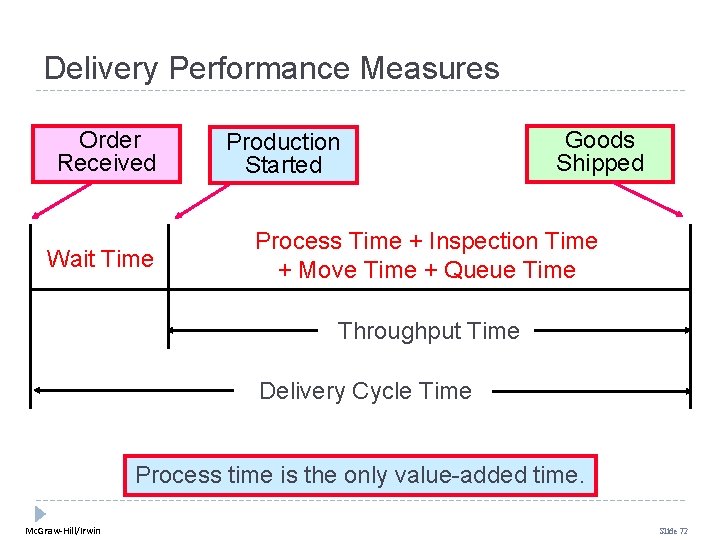
Delivery Performance Measures Order Received Wait Time Production Started Goods Shipped Process Time + Inspection Time + Move Time + Queue Time Throughput Time Delivery Cycle Time Process time is the only value-added time. Mc. Graw-Hill/Irwin Slide 72
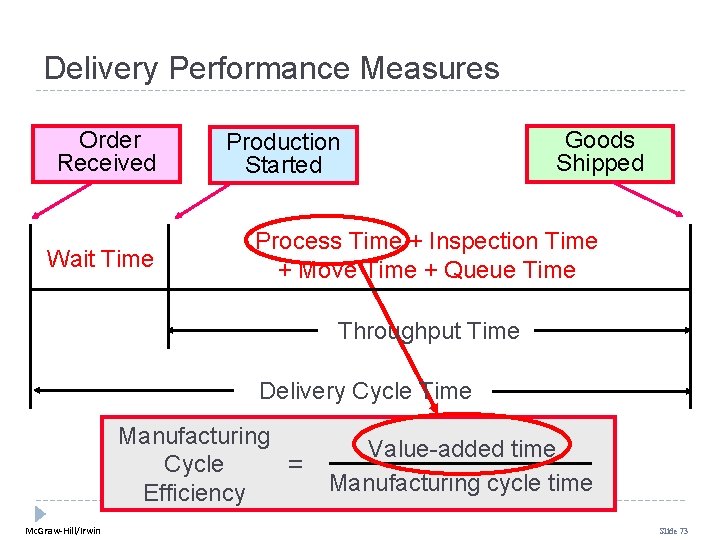
Delivery Performance Measures Order Received Wait Time Production Started Goods Shipped Process Time + Inspection Time + Move Time + Queue Time Throughput Time Delivery Cycle Time Manufacturing Cycle = Efficiency Mc. Graw-Hill/Irwin Value-added time Manufacturing cycle time Slide 73
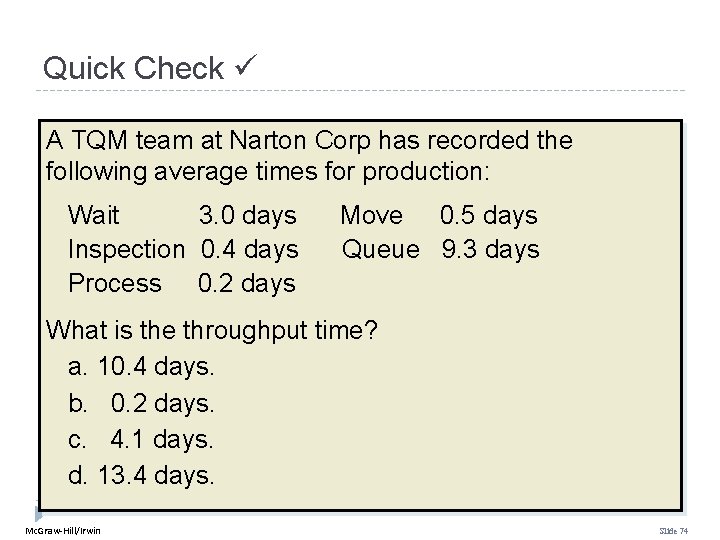
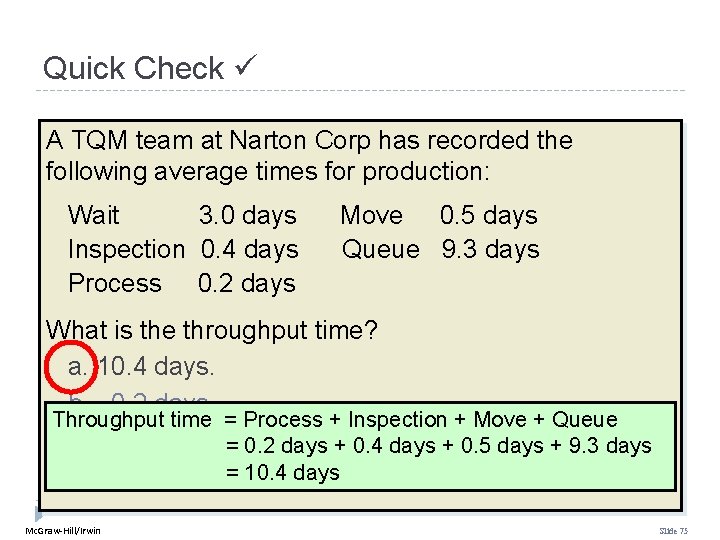
Quick Check A TQM team at Narton Corp has recorded the following average times for production: Wait 3. 0 days Inspection 0. 4 days Process 0. 2 days Move 0. 5 days Queue 9. 3 days What is the throughput time? a. 10. 4 days. b. 0. 2 days. c. 4. 1 days. d. 13. 4 days. Mc. Graw-Hill/Irwin Slide 74
Quick Check A TQM team at Narton Corp has recorded the following average times for production: Wait 3. 0 days Inspection 0. 4 days Process 0. 2 days Move 0. 5 days Queue 9. 3 days What is the throughput time? a. 10. 4 days. b. 0. 2 days. Throughput time = Process + Inspection + Move + Queue c. 4. 1 days. = 0. 2 days + 0. 4 days + 0. 5 days + 9. 3 days d. 13. 4 days. = 10. 4 days Mc. Graw-Hill/Irwin Slide 75
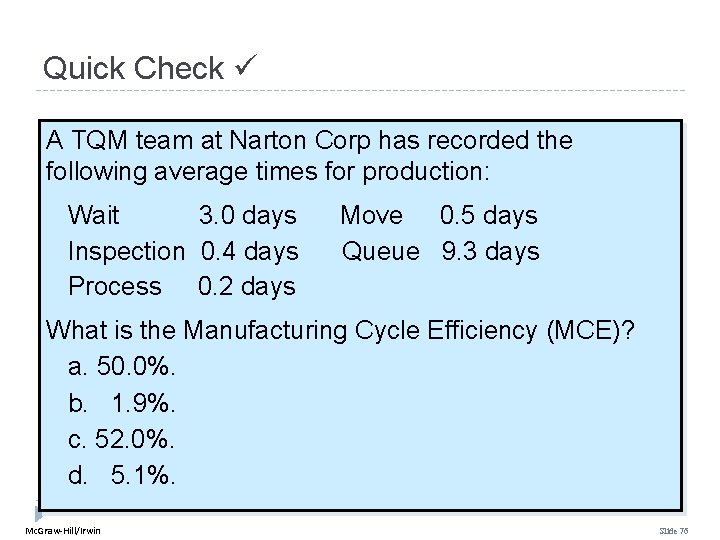
Quick Check A TQM team at Narton Corp has recorded the following average times for production: Wait 3. 0 days Inspection 0. 4 days Process 0. 2 days Move 0. 5 days Queue 9. 3 days What is the Manufacturing Cycle Efficiency (MCE)? a. 50. 0%. b. 1. 9%. c. 52. 0%. d. 5. 1%. Mc. Graw-Hill/Irwin Slide 76
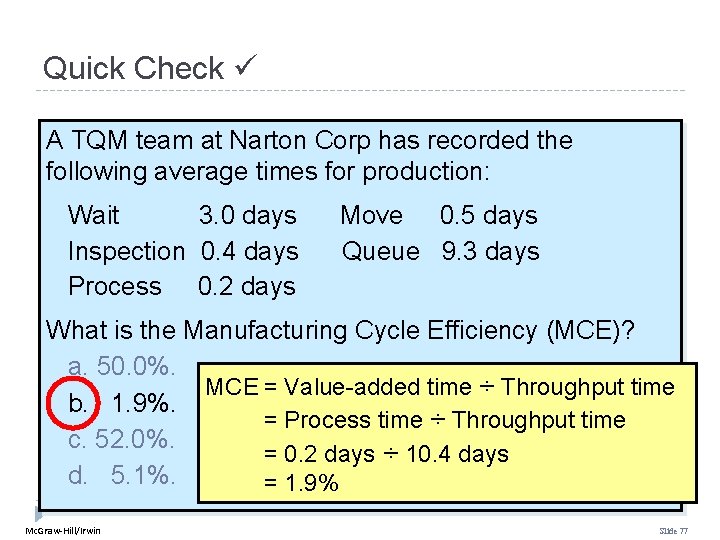
Quick Check A TQM team at Narton Corp has recorded the following average times for production: Wait 3. 0 days Inspection 0. 4 days Process 0. 2 days Move 0. 5 days Queue 9. 3 days What is the Manufacturing Cycle Efficiency (MCE)? a. 50. 0%. MCE = Value-added time ÷ Throughput time b. 1. 9%. = Process time ÷ Throughput time c. 52. 0%. = 0. 2 days ÷ 10. 4 days d. 5. 1%. = 1. 9% Mc. Graw-Hill/Irwin Slide 77
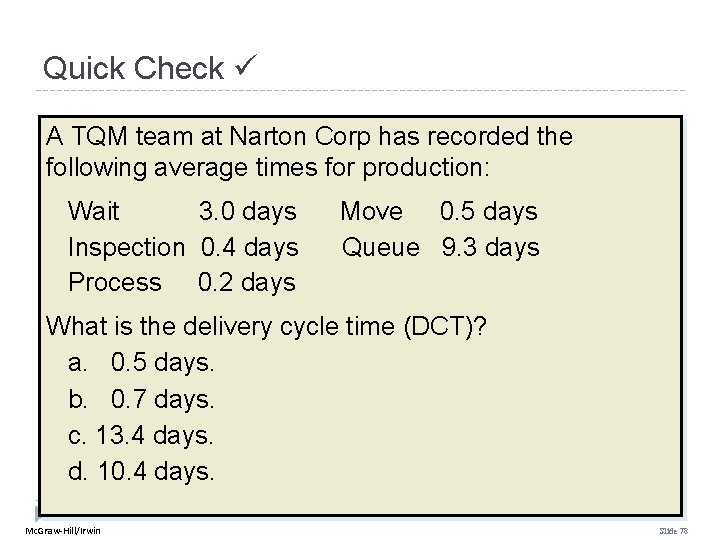
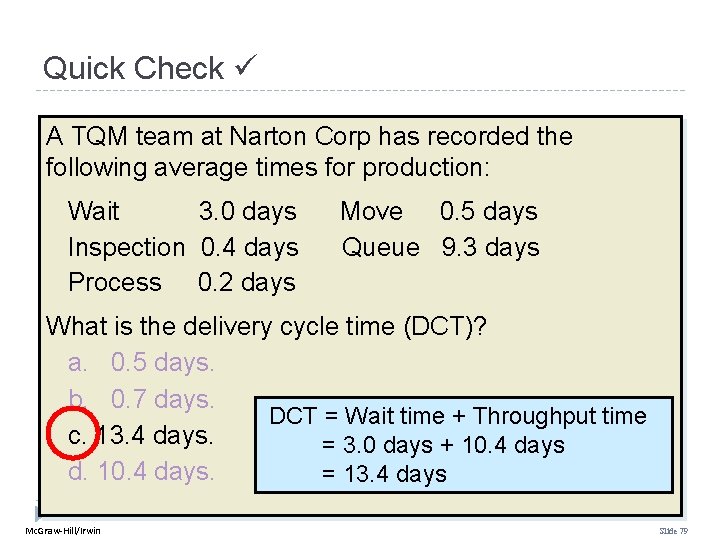
Quick Check A TQM team at Narton Corp has recorded the following average times for production: Wait 3. 0 days Inspection 0. 4 days Process 0. 2 days Move 0. 5 days Queue 9. 3 days What is the delivery cycle time (DCT)? a. 0. 5 days. b. 0. 7 days. c. 13. 4 days. d. 10. 4 days. Mc. Graw-Hill/Irwin Slide 78
Quick Check A TQM team at Narton Corp has recorded the following average times for production: Wait 3. 0 days Inspection 0. 4 days Process 0. 2 days Move 0. 5 days Queue 9. 3 days What is the delivery cycle time (DCT)? a. 0. 5 days. b. 0. 7 days. DCT = Wait time + Throughput time c. 13. 4 days. = 3. 0 days + 10. 4 days d. 10. 4 days. = 13. 4 days Mc. Graw-Hill/Irwin Slide 79
Predetermined Overhead Rates and Overhead Analysis in a Standard Costing System Appendix 11 A © 2010 The Mc. Graw-Hill Companies, Inc.
Learning Objective 6 (Appendix 11 A) Compute and interpret the fixed overhead budget and volume variances. Mc. Graw-Hill/Irwin Slide 81
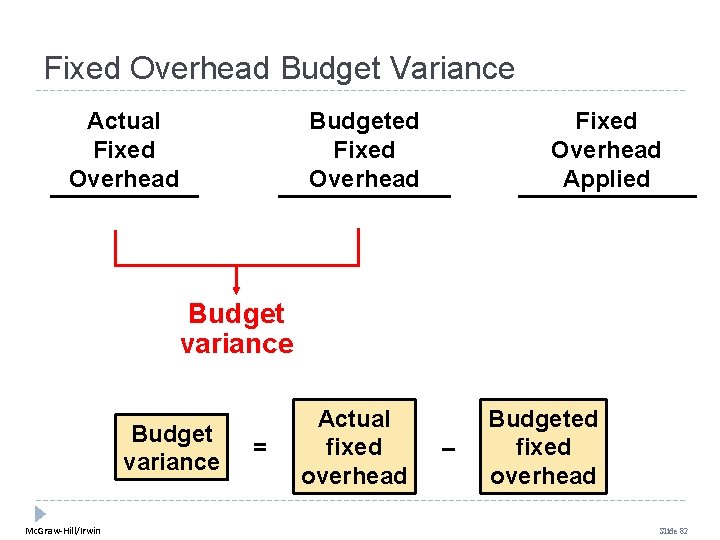
Fixed Overhead Budget Variance Actual Fixed Overhead Budgeted Fixed Overhead Applied Budget variance Mc. Graw-Hill/Irwin = Actual fixed overhead – Budgeted fixed overhead Slide 82
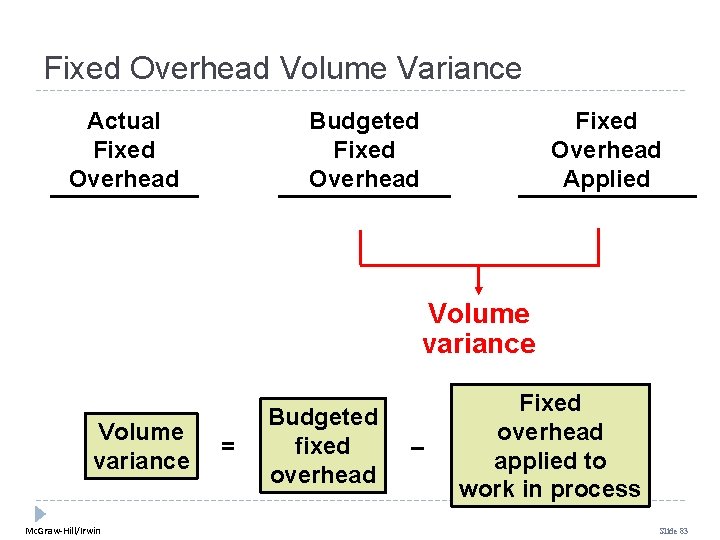
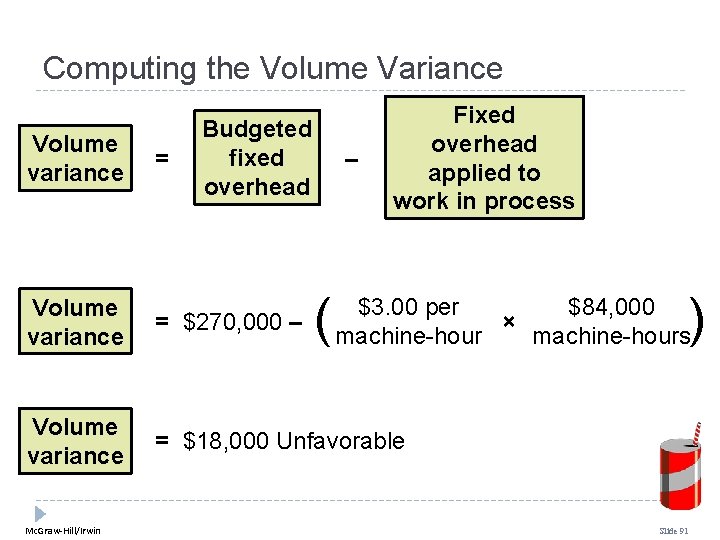
Fixed Overhead Volume Variance Actual Fixed Overhead Budgeted Fixed Overhead Applied Volume variance Mc. Graw-Hill/Irwin = Budgeted fixed overhead – Fixed overhead applied to work in process Slide 83
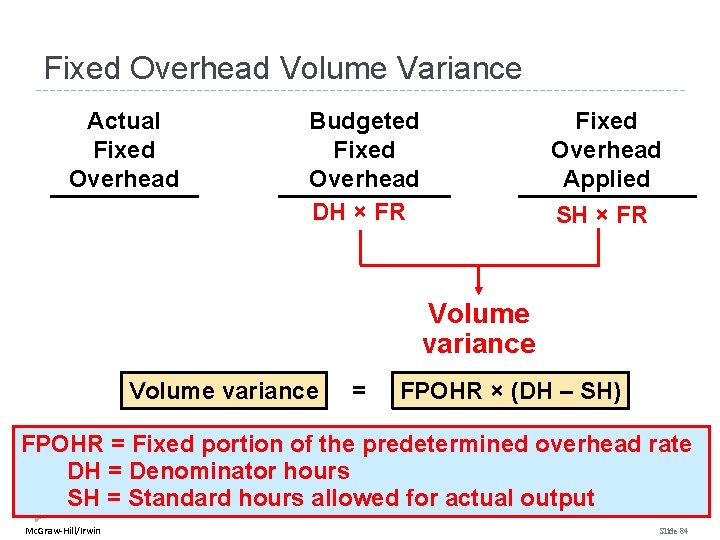
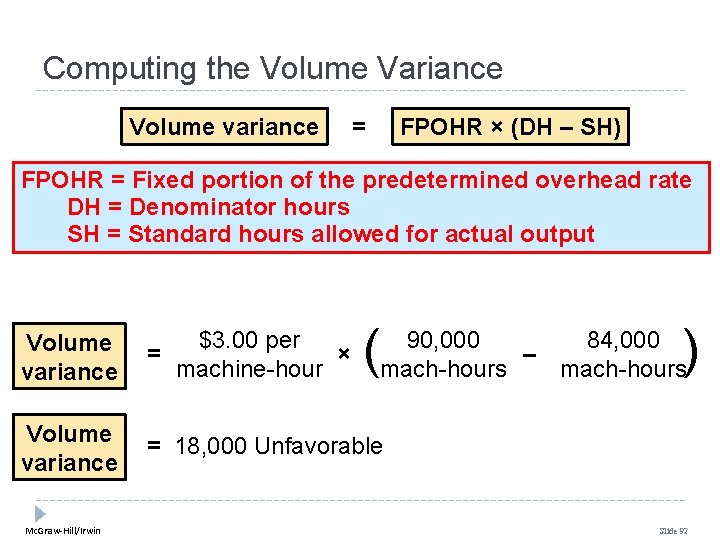
Fixed Overhead Volume Variance Actual Fixed Overhead Budgeted Fixed Overhead DH × FR Fixed Overhead Applied SH × FR Volume variance = FPOHR × (DH – SH) FPOHR = Fixed portion of the predetermined overhead rate DH = Denominator hours SH = Standard hours allowed for actual output Mc. Graw-Hill/Irwin Slide 84
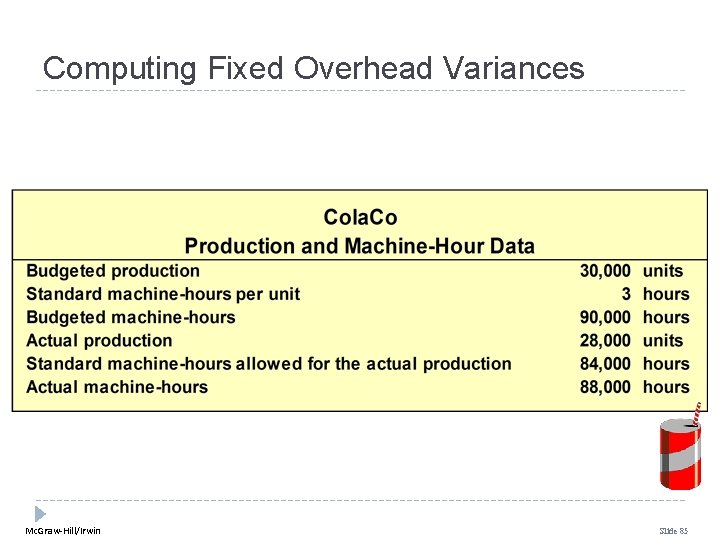
Computing Fixed Overhead Variances Mc. Graw-Hill/Irwin Slide 85
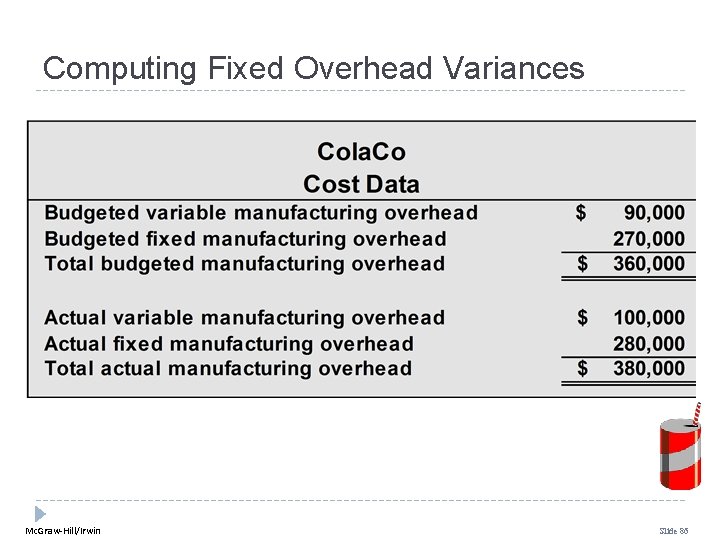
Computing Fixed Overhead Variances Mc. Graw-Hill/Irwin Slide 86
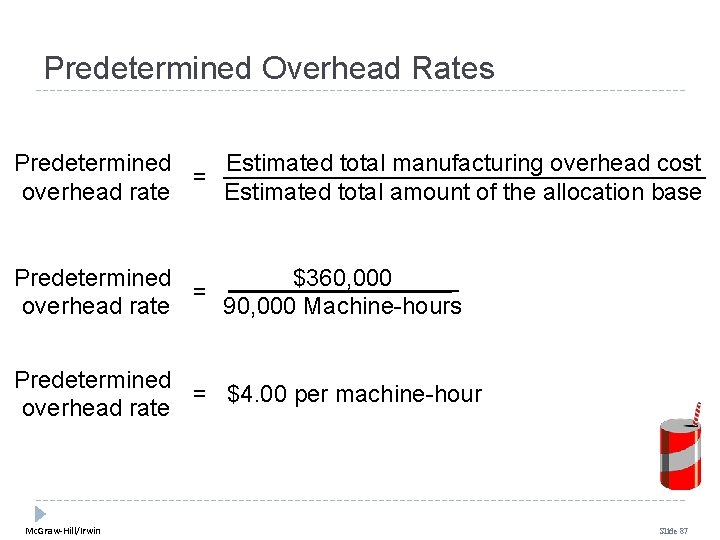
Predetermined Overhead Rates Predetermined Estimated total manufacturing overhead cost = overhead rate Estimated total amount of the allocation base $360, 000 Predetermined = 90, 000 Machine-hours overhead rate Predetermined = $4. 00 per machine-hour overhead rate Mc. Graw-Hill/Irwin Slide 87
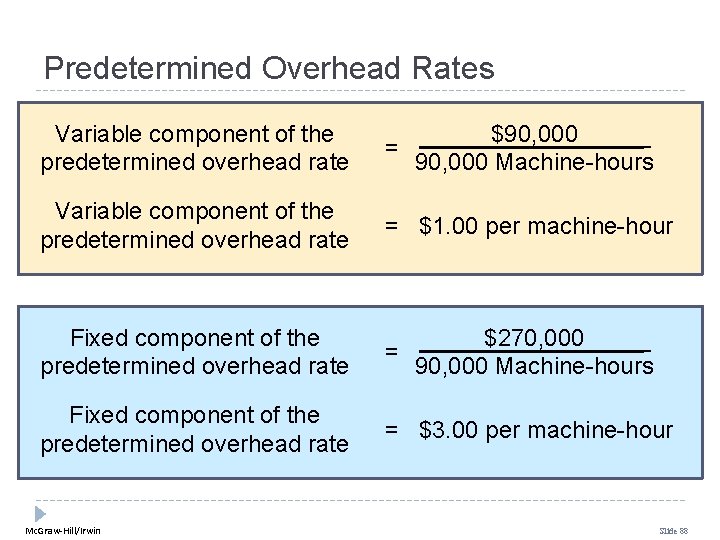
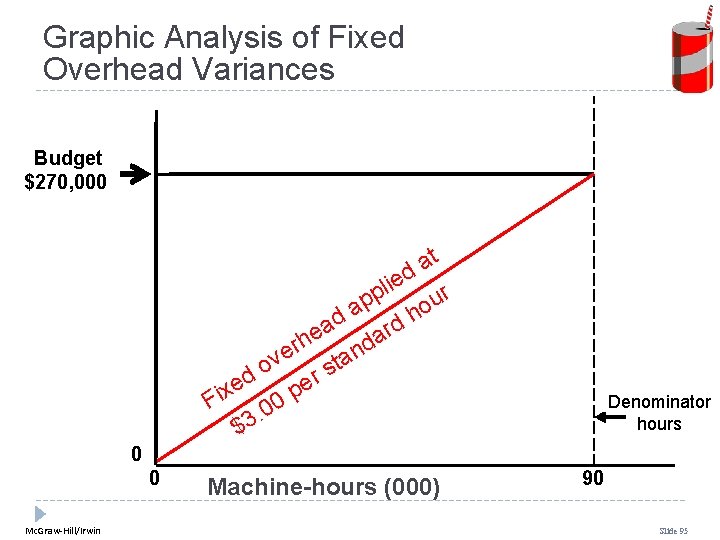
Predetermined Overhead Rates Variable component of the predetermined overhead rate $90, 000 = 90, 000 Machine-hours Variable component of the predetermined overhead rate = $1. 00 per machine-hour Fixed component of the predetermined overhead rate $270, 000 = 90, 000 Machine-hours Fixed component of the predetermined overhead rate = $3. 00 per machine-hour Mc. Graw-Hill/Irwin Slide 88
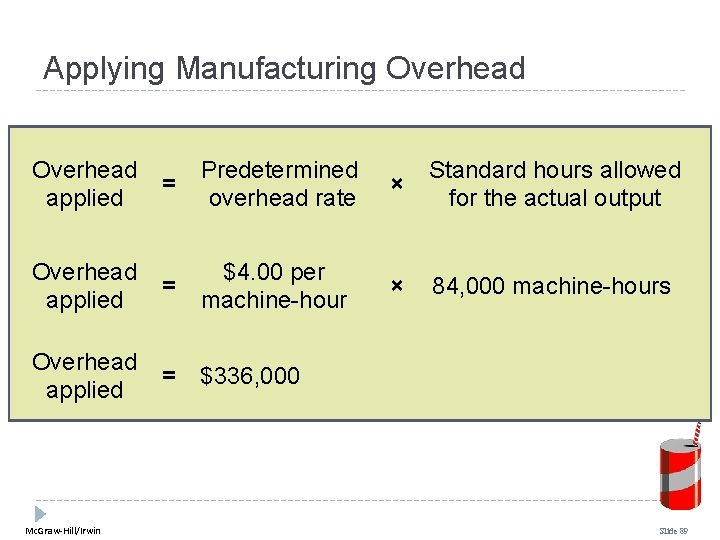
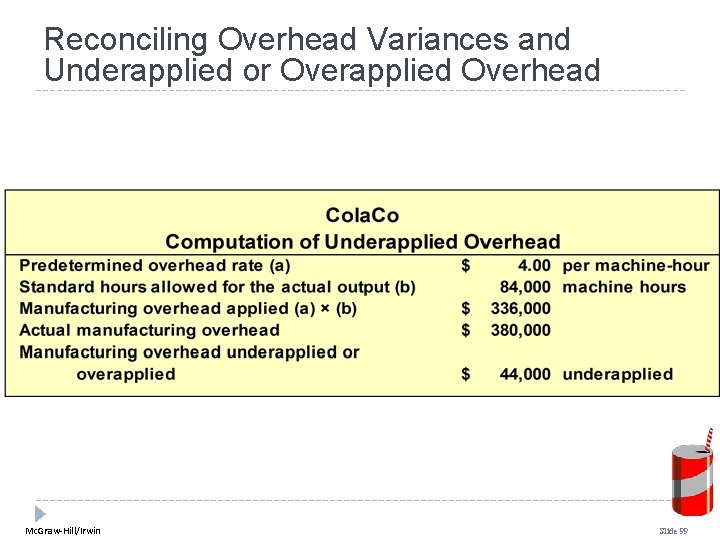
Applying Manufacturing Overhead applied = Predetermined overhead rate × Standard hours allowed for the actual output Overhead applied = $4. 00 per machine-hour × 84, 000 machine-hours Overhead applied = $336, 000 Mc. Graw-Hill/Irwin Slide 89
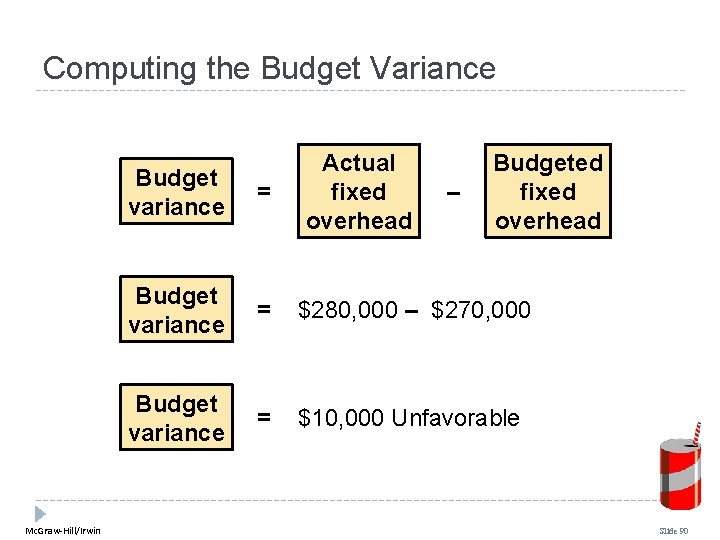
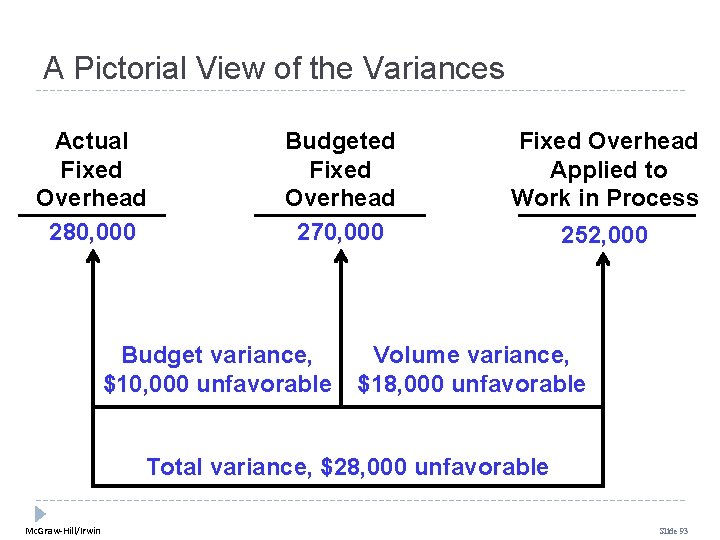
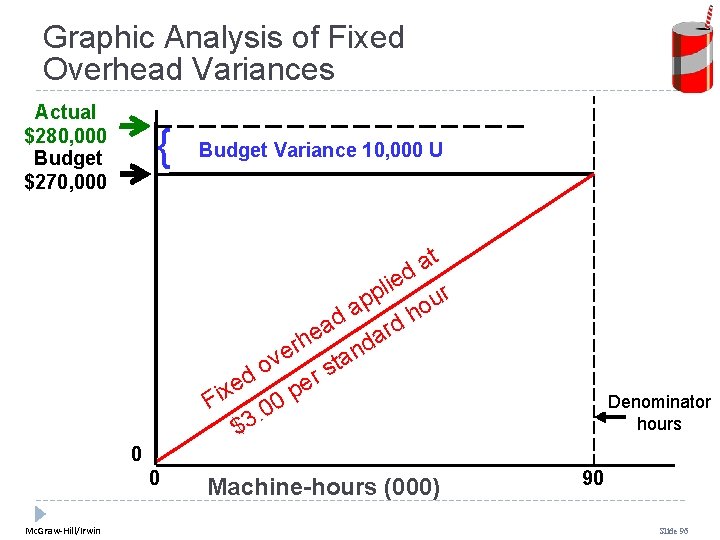
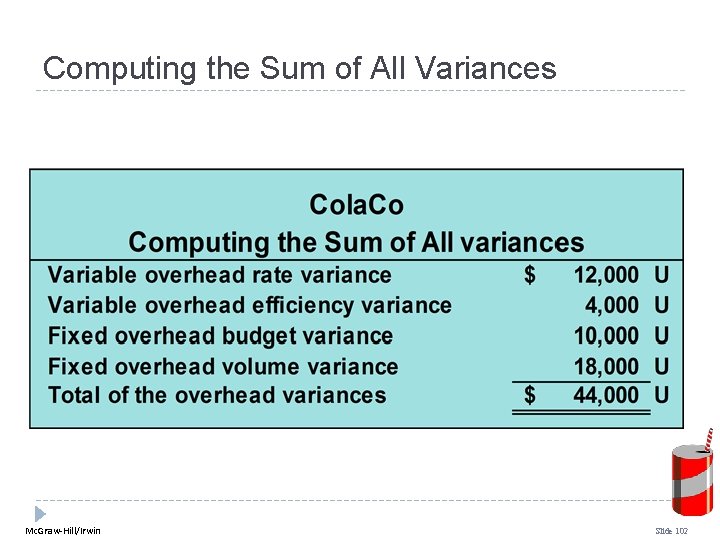
Computing the Budget Variance Mc. Graw-Hill/Irwin Actual fixed overhead Budgeted fixed overhead Budget variance = $280, 000 – $270, 000 Budget variance = $10, 000 Unfavorable – Slide 90
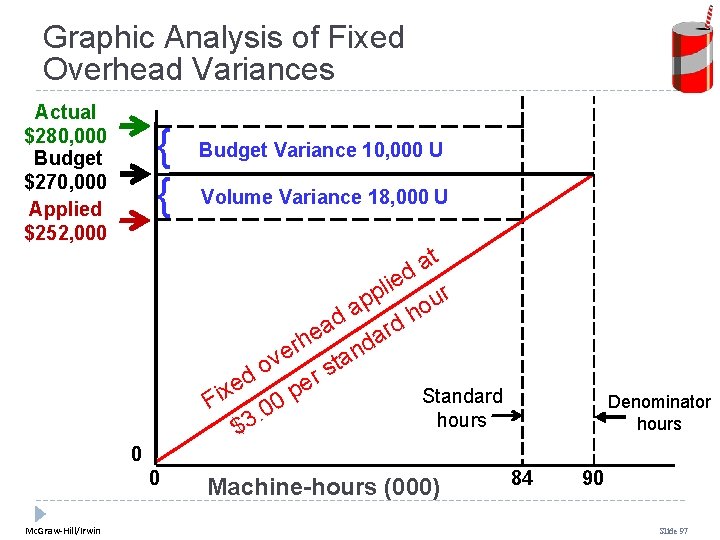
Computing the Volume Variance Volume variance = Budgeted fixed overhead – ( Fixed overhead applied to work in process = $270, 000 – Volume variance = $18, 000 Unfavorable Mc. Graw-Hill/Irwin ) $3. 00 per $84, 000 × machine-hours Volume variance Slide 91
Computing the Volume Variance Volume variance = FPOHR × (DH – SH) FPOHR = Fixed portion of the predetermined overhead rate DH = Denominator hours SH = Standard hours allowed for actual output ( Volume variance $3. 00 per = × machine-hour Volume variance = 18, 000 Unfavorable Mc. Graw-Hill/Irwin ) 90, 000 84, 000 – mach-hours Slide 92
A Pictorial View of the Variances Actual Fixed Overhead 280, 000 Budgeted Fixed Overhead 270, 000 Budget variance, $10, 000 unfavorable Fixed Overhead Applied to Work in Process 252, 000 Volume variance, $18, 000 unfavorable Total variance, $28, 000 unfavorable Mc. Graw-Hill/Irwin Slide 93
Fixed Overhead Variances – A Graphic Approach Let’s look at a graph showing fixed overhead variances. We will use Cola. Co’s numbers from the previous example. Mc. Graw-Hill/Irwin Slide 94
Graphic Analysis of Fixed Overhead Variances Budget $270, 000 t a d lie r p u p o a h d d a r e a h er tand v o s r d e e x p i F 0 0. $3 Denominator hours 0 0 Mc. Graw-Hill/Irwin Machine-hours (000) 90 Slide 95
Graphic Analysis of Fixed Overhead Variances Actual $280, 000 Budget $270, 000 { Budget Variance 10, 000 U t a d lie r p u p o a h d d a r e a h er tand v o s r d e e x p i F 0 0. $3 Denominator hours 0 0 Mc. Graw-Hill/Irwin Machine-hours (000) 90 Slide 96
Graphic Analysis of Fixed Overhead Variances Actual $280, 000 Budget $270, 000 Applied $252, 000 { { Budget Variance 10, 000 U Volume Variance 18, 000 U t a d lie r p u p o a h d d a r e a h er tand v o s r d e e x p i Standard F 0. 0 hours 3 $ Denominator hours 0 0 Mc. Graw-Hill/Irwin Machine-hours (000) 84 90 Slide 97
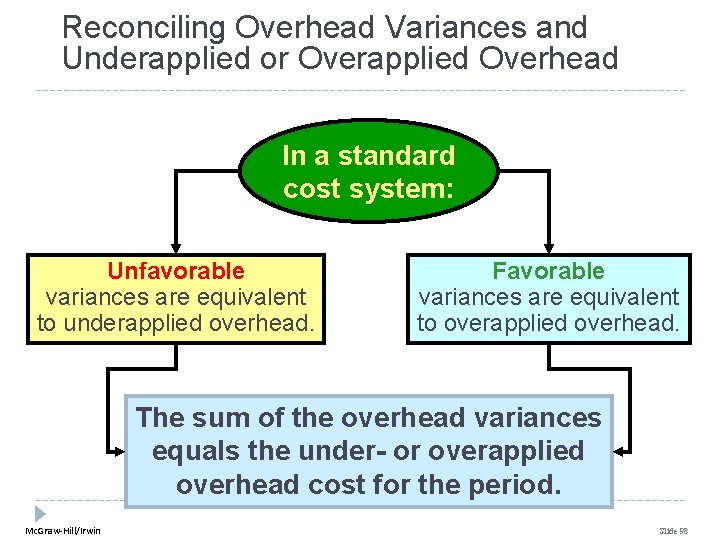
Reconciling Overhead Variances and Underapplied or Overapplied Overhead In a standard cost system: Unfavorable variances are equivalent to underapplied overhead. Favorable variances are equivalent to overapplied overhead. The sum of the overhead variances equals the under- or overapplied overhead cost for the period. Mc. Graw-Hill/Irwin Slide 98
Reconciling Overhead Variances and Underapplied or Overapplied Overhead Mc. Graw-Hill/Irwin Slide 99
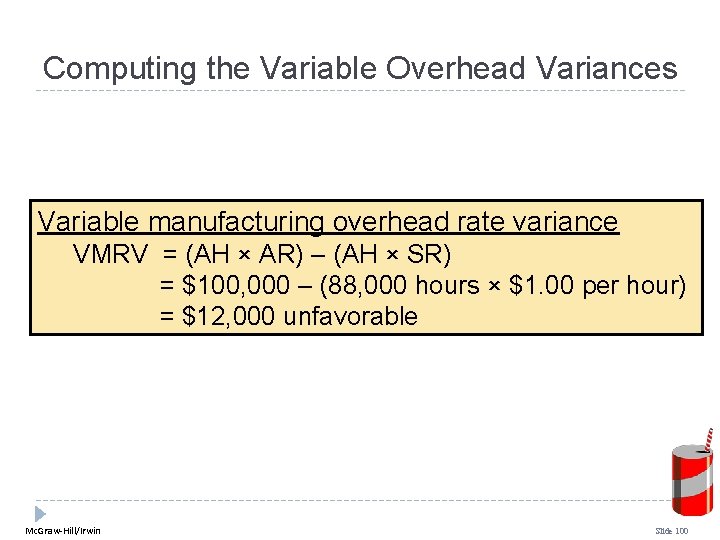
Computing the Variable Overhead Variances Variable manufacturing overhead rate variance VMRV = (AH × AR) – (AH × SR) = $100, 000 – (88, 000 hours × $1. 00 per hour) = $12, 000 unfavorable Mc. Graw-Hill/Irwin Slide 100
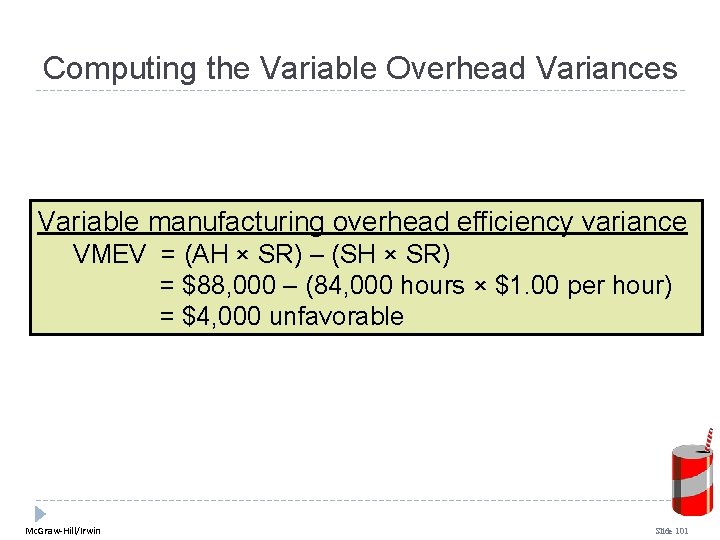
Computing the Variable Overhead Variances Variable manufacturing overhead efficiency variance VMEV = (AH × SR) – (SH × SR) = $88, 000 – (84, 000 hours × $1. 00 per hour) = $4, 000 unfavorable Mc. Graw-Hill/Irwin Slide 101
Computing the Sum of All Variances Mc. Graw-Hill/Irwin Slide 102
Journal Entries to Record Variances Appendix 11 B © 2010 The Mc. Graw-Hill Companies, Inc.
Learning Objective 7 (Appendix 11 B) Prepare journal entries to record standard costs and variances. Mc. Graw-Hill/Irwin Slide 104
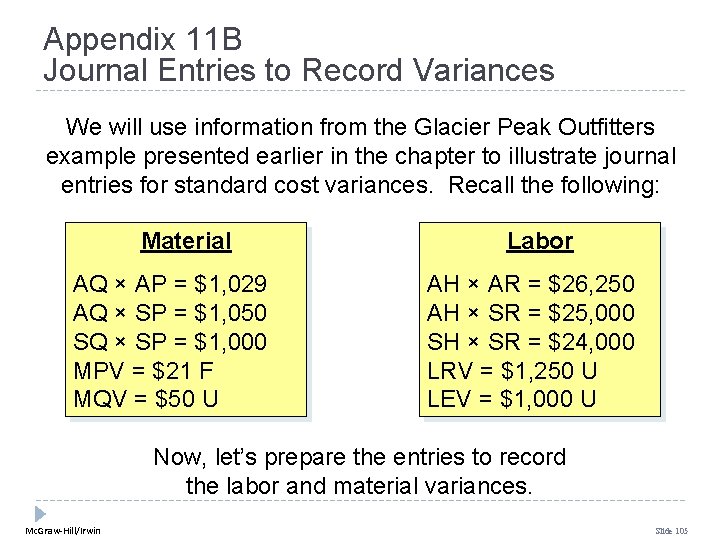
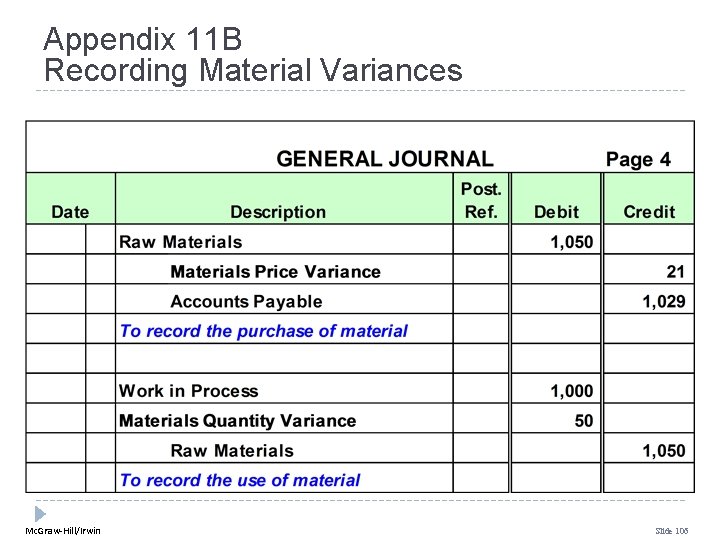
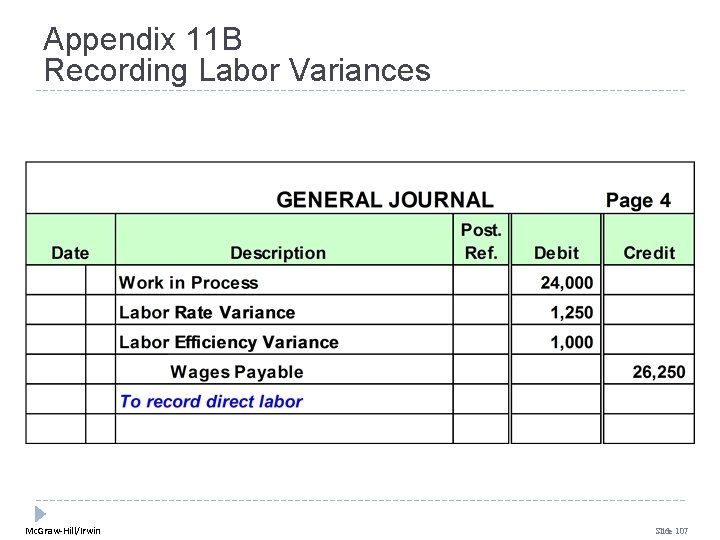
Appendix 11 B Journal Entries to Record Variances We will use information from the Glacier Peak Outfitters example presented earlier in the chapter to illustrate journal entries for standard cost variances. Recall the following: Material AQ × AP = $1, 029 AQ × SP = $1, 050 SQ × SP = $1, 000 MPV = $21 F MQV = $50 U Labor AH × AR = $26, 250 AH × SR = $25, 000 SH × SR = $24, 000 LRV = $1, 250 U LEV = $1, 000 U Now, let’s prepare the entries to record the labor and material variances. Mc. Graw-Hill/Irwin Slide 105
Appendix 11 B Recording Material Variances Mc. Graw-Hill/Irwin Slide 106
Appendix 11 B Recording Labor Variances Mc. Graw-Hill/Irwin Slide 107
Cost Flows in a Standard Cost System Inventories are recorded at standard cost. Variances are recorded as follows: w Favorable variances are credits, representing savings in production costs. w Unfavorable variances are debits, representing excess production costs. Standard cost variances are usually closed out to cost of goods sold. w Unfavorable variances increase cost of goods sold. w Favorable variances decrease cost of goods sold. Mc. Graw-Hill/Irwin Slide 108
End of Chapter 11 Mc. Graw-Hill/Irwin Slide 109