Standard Costs and Operating Performance Measures Standard Costs


 • Zero based budgeting")


 general economic conditions,")
 5. Prepare expense budgets by cost centre 6. Prepare capital")


- Slides: 49
Standard Costs and Operating Performance Measures
Standard Costs Standards are benchmarks or “norms” for measuring performance. In managerial accounting, two types of standards are commonly used. Quantity standards specify how much of an input should be used to make a product or provide a service. Price standards specify how much should be paid for each unit of the input. Examples: Firestone, Sears, Mc. Donald’s, hospitals, construction and manufacturing companies.
Key performance indicators VS Actual performance KPI/Pre cost target Actual/Post cost Variance Direct material 10. 00 per unit 11. 00 (A) Direct labour 5. 00 per unit 5. 50 0. 50(A) Variable overhead 2. 00 per unit 2. 00 - Fixed overhead 1. 00 per unit 1. 00 - Full cost 18. 00 per unit 18. 50
Standard Costs Amount Deviations from standards deemed significant are brought to the attention of management, a practice known as management by exception. Standard Direct Labor Direct Material Type of Product Cost Manufacturing Overhead
Variance Analysis Cycle Identify questions Receive explanations Take corrective actions Conduct next period’s operations Analyze variances Prepare standard cost performance report Begin
PDCA P=PLAN D=DO C=CHECK A=ACTION
Setting Standard Costs Accountants, engineers, purchasing agents, and production managers combine efforts to set standards that encourage efficient future operations.
Setting Standard Costs Should we use ideal standards that require employees to work at 100 percent peak efficiency? Engineer I recommend using practical standards that are currently attainable with reasonable and efficient effort. Managerial Accountant
Setting Direct Material Standards Price Standards Quantity Standards Final, delivered cost of materials, net of discounts. Summarized in a Bill of Materials.
Setting Standards Six Sigma advocates have sought to eliminate all defects and waste, rather than continually build them into standards. As a result allowances for waste and spoilage that are built into standards should be reduced over time.
Setting Direct Labor Standards Rate Standards Time Standards Often a single rate is used that reflects the mix of wages earned. Use time and motion studies for each labor operation.
Setting Variable Manufacturing Overhead Standards Rate Standards Quantity Standards The rate is the variable portion of the predetermined overhead rate. The quantity is the activity in the allocation base for predetermined overhead.
Price and Quantity Standards Price and quantity standards are determined separately for two reasons: The purchasing manager is responsible for raw material purchase prices and the production manager is responsible for the quantity of raw material used. The buying and using activities occur at different times. Raw material purchases may be held in inventory for a period of time before being used in production.
A General Model for Variance Analysis Price Variance Difference between actual price and standard price Quantity Variance Difference between actual quantity and standard quantity
A General Model for Variance Analysis Price Variance Materials price variance Labor rate variance VOH rate variance Quantity Variance Materials quantity variance Labor efficiency variance VOH efficiency variance
A General Model for Variance Analysis Actual Quantity × Actual Price Actual Quantity × Standard Price Variance Standard Quantity × Standard Price Quantity Variance
Standard Cost Card – Variable Production Cost A standard cost card for one unit of product might look like this:
Actual results for the month of March Actual production 5000 units Actual material used and purchased 17500 Kg Actual material cost Rs. 66500. 00 Labour hours produced 11250 hours Labour cost incurred Rs. 160312. 5 Variable overhead Rs. 28125. 00 Calculate all possible variances from the pre cost standard
Variance analysis Ultra Shine Company manufactures a cleaning solvent. The company employs both skilled and unskilled workers. The standard and actual material and labor information is presented below. Budgted production sales 60000 units. Standard: Material A: 30. 25 gallons @ Rs. 1. 25 per gallon = 37. 80 Skilled Labor: 4 hours @ Rs. 12 per hour = 48. 00 Variable production overhead 4 hours @ Rs. 3. 00 per hour= 12. 00 Fixed production overhead = 05. 00 Full cost per unit = 102. 80 Profit margin per unit = 40. 00 Selling price = 142. 80 Post order costing: Material A: 10, 716 gallons purchased and used @ Rs. 1. 50 per gallon Skilled labor hours: 1, 950 @ Rs. 11. 90 per hour Variable production cost Rs. 7800. 00 Fixed production overhead cost Rs. 310, 000. 00 During the current month Ultra Shine Company manufactured 500 55 gallon drums and total revenue earned Rs. 7, 508, 250. 00. Calculate all possible variances
ABC ltd operates standard costing system for the product pricing and measuring the operational performance. Following pre costing is given product A. Direct material 0. 5 kg@4. 00 per kg = 2. 00 Direct labour 2 hours@5. 00 per hour = 10. 00 Variable overhead 2 hours@0. 30 per hour= 0. 60 Fixed overhead = 7. 40 Standard cost =20. 00 Standard profit =06. 00 Standard selling price = 26. 00 Budgeted output for the month of June was 5100 units. Actual results for June is as follows. Production 4850 units was manufactured and sold for Rs. 124, 280. 00. Material consumed in production amounted 2300 Kg at a cost of Rs. 9800. Labour hours worked 8000 hours and paid Rs. 42, 000. Variable overhead amounted to Rs. 2600. Fixed overhead paid amounted to Rs. 42, 300. You required to prepare a operating statement for the month of June.
Achieving the excellence in process improvement Six sigma Kaizon “Improvment change for the better” Kaizon is the philosophy of the companyto achieve the process excelle nce to improve the financial indicators . Continues improvement is the rule of the game. Team, change in attitudes, participating, quality and process improvement circle, brainstorming, empowerment are the key value drivers of a Kaizon culture. Eliminate defects Six sigma is looking at two methodlogies to elimiante the wastage DMAIC= Define, measure, analysis, improve and control OR DMADV= Define, measure, analysis, design and control https: //www. youtube. com/watch? v=il. DAYBR 5 s. QU
Planning and Operating Variances • Explaining the causes of variances is a key step in variance analysis. In some cases the cause is purely operational (e. g. the price of raw materials went up due to market shortages) but in some cases the cause is due to poor budgeting and planning (e. g. we used an out of date price list when setting the standard cost of materials). • Detail analysis of the variances leads to better understand the planning errors and the operational errors. • Else all the planning errors are accounted as a operational inefficiencies of labors, purchasing and the production. • Revision of the original budget or standard lead to planning variances.
Continue…….
Illustration 1 - Revising the standard Example: at the begging of 20 X 0, WB ltd set a standard marginal cost for its major product of Rs. 25 per unit. The standard cost is recalculated once each year. Actual production costs during August 20 X 0 were Rs. 304, 000, when 8, 000 units were made. With the benefit of hindsight, the management of WB ltd realizes that a more realistic standard cost for current condition would be Rs. 40 per unit. The planned standard cost of Rs. 25 is unrealistically low. Calculate the planning and operational variances.
Question 2: total planning and operational variances Suppose a budget is prepared which includes a raw materials cost per unit of product of Rs. 2 (2 kg of copper at Rs. 1 per kg). Due to a rise in world prices for copper during the year, the average market price of copper rises to Rs. 1. 50 per kg. During the year, 1000 units were produced at a cost of Rs. 3, 250 for 2, 200 kg of copper. Calculate the planning and operational variance Quetion 3: planning variances and sub- variances The standard materials cost of a product is 3 kg. Rs. 1. 50 per Kg=Rs. 3. 50. Actual production of 10, 000 units used 28, 000 kg at a cost of Rs. 50, 000. In retrospect it was realized that the standard materials cost should have been 2. 5 kg per unit at a cost of Rs. 1. 80 per kg (so that the total cost per unit was correct) Calculate the planning and operational variances in as much detail as possible
Budgets What is a budget? – a plan – expressed in monetary terms – covering a future time period – based on a defined level of activity
Budgeting can be used as a planning tool by Management. Therefore primary phases of the budgeting are q Planning q Control
Why comprehensive budgeting Identify the organizational interrelated impact on the operational income, financial position and The cash flow. Fixed budget – Defined period, usually 12 months by month
Problems with traditional budgeting In general, the literature related to the criticism against budgeting can be roughly divided into two main groups; while others argue that the use of budgets is fundamentally defective, others argue that the problems emerge only because of the way that budgets are used. • Game playing (Dysfunctional behavior of the departmental heads) • Time related issue (Planning and implementation gap , negotiation and approval • Strategic issues/not fit with the purpose and the strategy (Libby and Lindsay, 2010)
Alternative approaches • Rolling forecast • Activity based budgeting (ABB) • Zero based budgeting
Budgeting and strategy Strategic planning ‘precedes budgeting and provides the framework within which the annual budget is developed. A budget is, in a sense, a one-year slice of the organization’s strategic plan’.
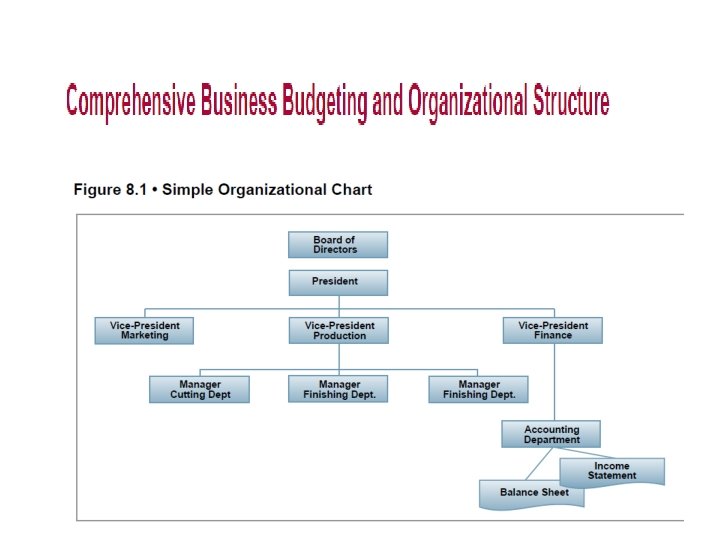
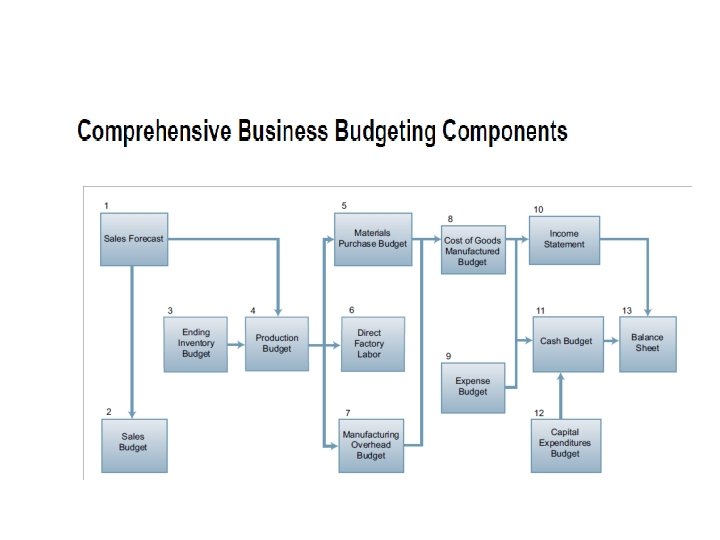
Components of the comprehensive budgeting
Purposes of budgeting • Implement strategy by allocating resources in line with strategic goals • Co-ordinate activities and assist in communication among different parts of an organisation • Motivate managers to achieve targets • Provide a means to control activities • Evaluate and business unit performance
Budget cycle 1. 2. Identify business objectives Forecast future conditions (1) general economic conditions, (2) industry trends, (3) market research studies, (4) anticipated advertising and promotion, (5) previous market share, (6) changes in prices, and (7) technological developments 3. 4. Develop detailed sales budgets by market segments, major customers and product groups Prepare production budgets for the goods or services needed to satisfy the sales forecast and maintain agreed levels of inventory.
Budget cycle (cont. ) 5. Prepare expense budgets by cost centre 6. Prepare capital expenditure budgets 7. Prepare cash forecasts and identify financing requirements 8. Prepare master budget (Income Statement, Balance Sheet and Cash Forecast) 9. Obtain Board approval of profitability and financing targets
The Master Budget • The Master Budget is a set of interrelated budgets that constitutes a plan of action for a specified time period. 38
Formats of the operational and financial budgeting
Production budget
Material usage budget
Labor budget
Factory overhead budget
ENDING FINISHED GOOD INVENTORY BUDGET
SELLING, GENARAL AND ADMINISTRATION BUDGET
CASH BUDGET
Budgeted income statement
Budgeted balance sheet