Standard Deviation and Standard Error of the Mean


 2. Determine the difference between")


 estimates")


- Slides: 19
Standard Deviation and Standard Error of the Mean
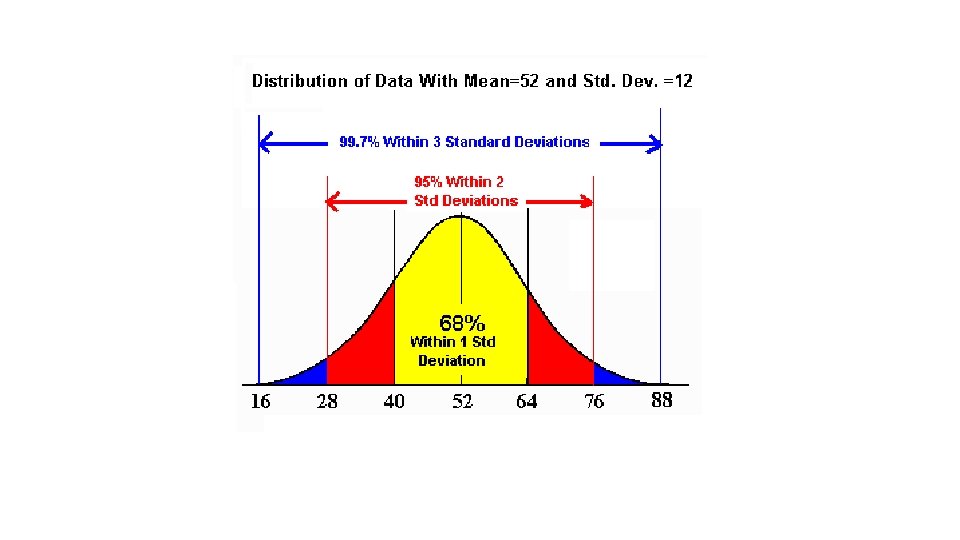
Standard Deviation • Standard Deviation – measure how spread out the data is from the mean
• Lower standard deviation: • Data is closer to the mean • Greater likelihood that the independent variable is causing the changes in the dependent variable • Higher standard deviation: • Data is more spread out from the mean • More likely factors, other than the independent variable, are influencing the dependent variable
Calculating standard deviation, s 1. Calculate the mean (x) 2. Determine the difference between each data point, and the mean 3. Square the differences 4. Sum the squares 5. Divide by sample size (n) minus 1 6. Take the square root
Practice 4 bears were captured in Alaska. Using molecular testing, their ages were determined to be: 5, 4, 9, and 15. Based on your sample: A) What is the mean age of the bears? B) What is the standard deviation? (Round to nearest tenth)
Calculate with 95% confidence • +/- 2 standard deviation • Example: Human body temperature • Mean = 98. 25 Standard deviation = 0. 73 1 SD means add 0. 73 to 98. 25 and subtract 0. 73 from 98. 25 Range = 97. 52 – 98. 98 This is 68% confidence level 2 SD means add 2(0. 73) to 98. 25 and subtract 2(0. 73) from 98. 25 Range = 96. 79 – 99. 71 This is 95% confidence level *If we counted 10, 000 people, we can confidently say 95% of them have a body temperature between 96. 79 – 99. 71
Standard Error: • Indication of how well the mean of a sample (x) estimates the true mean of a population (μ) • Measure of accuracy, if the true mean is known • Measure of precision, if true mean is not known
Calculating Standard Error, SE 1. Calculate standard deviation 2. Divide standard deviation by square root of sample size
Standard Error of the Mean • SEM = standard deviation n = number of data points n • Standard Error of the Mean – allows you to make an inference about how well your sample mean matches with the population mean • +/- 2 SEM is equivalent to 95% Confidence Interval • Ex: Students can infer with 95% confidence that the true mean for the population lies within the boundaries of the sample mean +/- 2 SEM
Practice • Mean = 98. 25 Standard deviation = 0. 73 • 4 students body temperature: 98. 6, 97. 9, 98. 3, 98. 2 • SEM= SD SEM= 0. 73/2 = 0. 365 n • Bars: 98. 25 + 2(0. 365) and 98. 25 – 2(0. 365)
How do we use Standard Error? Create bar graph • • mean on Y-axis sample(s) on the X-axis chemical 1 mean = 30 cm chemical 2 mean = 50 cm
Add error bars! • ± SE • Indicate in figure caption that error bars represent standard error (SE)
Analyze! • Look for overlap of error lines: • If they overlap: The difference is not significant • If they don’t overlap: The difference may be significant
Which is a valid statement? • Fish 2 Whale food caused the most fish growth • Fish 2 Whale food caused more fish growth than did Budget Fude
Statements: • In all four regions, more males exhibited the trait measured than did females. • More males in region 3 exhibited the measured trait than did females
Mean belief scores for misleading ads # of ads identified as misleading • vm. PFC = damage to ventromedial prefrontal cortex • BDC = brain damaged comparison group Statements: 1. The vm. PFC group identified fewer ads as misleading than did the normal group 2. The BDC group identified more ads as misleading than did the normal group.
What you need to do now: • Part 3 Lab: Graph % change on y and molarity on x; draw a line of best fit to determine the molarity of your potato (where it crosses x) • Record your potato’s molarity in correct column of class data • Calculate mean molarity of white and sweet potatoes • Calculate standard deviation for each potato type • Calculate SEM for each potato type and create a graph comparing the means (including error bars representing 2 SEMs) • Write a conclusion as to whether sweet potatoes are indeed significantly sweeter than white potatoes. Justify your conclusion using data from your graph