Planning Research Collecting and Analyzing Research Data Health


 n n Clearly described in the protocol and report Examples n n")


 Starts with people who have disease Matches them with")
 Strength n n n Fast Cheap Useful to generate hypothesis")
 Weakness n n Can only study one outcome Can not")


 Strength n n n n Allows for accurate measurement of")
 Weakness n n n n Time consuming Expensive Can not")
 Studied population (with disease) Randomized TIME Placebo Treatment No Diseased")
 Studied population (without disease) Randomized TIME Placebo Treatment No Diseased")
 n n n Starts with subject with diseases (therapeutic) or without")
 n Strength n n n “Gold Standard” Best design for controlling")


 Non-Probability Sampling n n n Subjective (Judgment) sampling Convenient")


 n Examples n Study A found an association between cigar smoking and")


 n Describe data n n Frequency and Frequency Distribution")
 n Make comparisons n n t-test vs. Wilcoxon Rank-Sum")


 No Difference (H")

 4. Choose a Test Statistic = Relevant Statistic - Hypothesized")
 9. Make a Conclusion n n If Ho is rejected,")
")


 Statistics for each of study • Number of observations")
 “Graphs in Statistical Analysis” The American Statistician, 1973; 27:")


 = 0.")


 Errors in the Hand Literature: The Importance of Power The")
 Errors in the Hand Literature: The Importance of Power The")


- Slides: 96
Planning Research, Collecting and Analyzing Research Data Health Insurance in Transition - 5 th International Conference September 26, 2002, Zagreb, Croatia Yen-Hong Kuo Jersey Shore Medical Center Meridian Health System Neptune, New Jersey U. S. A.
Outline n n n Introduction Planning Research Collecting Research Data Analyzing Research Data Conclusion
Medical Research Observe Phenomenon Propose Hypothesis Plan Research Collect and Analyze Data Interpret Results
Example n Some of my friends are eating vitamin E to prevent colon cancer. n n Hypothesis: Vitamin E can prevent colon cancer Questions n n n How many people are eating vitamin E? How many people are having colon cancer? What is the association between eating vitamin E and having colon cancer? Can vitamin E prevent colon cancer?
Purpose of Research n n Description Estimation Making comparisons Assessing association
Planning Research n n n n Literature Review DEFINITION Consult Experts Study Design Sampling Arrangement Data Collection Arrangement Statistical Analysis Plan Practical Considerations
Literature Review n What has been done and how n n What has not been done n n Population Study design Statistical methods Limitation of the studies Issues missed in the previous studies Learn more about background info Find more relevant studies
DEFINITION n The key to a successful study n n Refine the hypothesis n n “A Problem well defined is a problem half solved” Be specific Define variables n n n Outcome variables Explanatory variables Biological meaningful and clinically useful
DEFINITION (continued) n n Clearly described in the protocol and report Examples n n Classification of BMI (body mass index) Estrogen-Receptor Status (JAMA 2000; 283: 338 -9)
Consult Experts n When? n n BEFORE design your study Who? n n n Colleagues with experiences in study design and statistical analyses Epidemiologist Biostatistician
Design of Analytical Studies n Observational studies n n Cross-sectional / prevalence Case-control / retrospective Cohort / prospective Experimental studies n Controlled clinical trials
Cross-Sectional Study TIME No Disease Exposed Not Exposed Diseased Exposed Not Exposed
Cross-Sectional Study n Data collected at a single point in time n n A “snapshot” Describe prevalence n n (continued) Prevalence vs. Incidence Assess associations
Cross-Sectional Study n Strength n n n Quick Cheap Weakness n Can not establish cause-effect (continued)
Case-Control Study Not Exposed TIME Diseased cases No Disease controls Exposed
Case-Control Study n n (continued) Starts with people who have disease Matches them with people who do not have disease (control) Looks history for exposures Assesses associations
Case-Control Study n (continued) Strength n n n Fast Cheap Useful to generate hypothesis Good for rare diseases Can examine several exposures Estimates odds ratio
Case-Control Study n (continued) Weakness n n Can only study one outcome Can not measure n n Prevalence Incidence Relative risk High susceptibility to bias
Cohort Study Exposed disease free Not Exposed TIME Disease Free Develop Disease
Cohort Study n n Starts with disease-free subjects Classifies subjects as exposed or not exposed Records outcomes Assesses associations
Cohort Study n (continued) Strength n n n n Allows for accurate measurement of exposure variables Estimates incidence Estimates relative risk Can measure multiple outcomes Can adjust for confounding variables Establishes time sequence for causality Eliminates recall bias
Cohort Study n (continued) Weakness n n n n Time consuming Expensive Can not study rare outcomes Confounding variables Disease may have a long pre-clinical phase Exposure may change over time Attrition of study population
Clinical Trial (therapeutic) Studied population (with disease) Randomized TIME Placebo Treatment No Diseased
Clinical Trial (preventive) Studied population (without disease) Randomized TIME Placebo Treatment No Diseased
Clinical Trial (continued) n n n Starts with subject with diseases (therapeutic) or without diseases (preventive) Randomized Blinding n n n Assignment Assessment Placebo controlled
Clinical Trial (continued) n Strength n n n “Gold Standard” Best design for controlling bias Can measure multiple outcomes Best measurement of causal relationship Weakness n n n Expensive Compliance Ethical issues may be a problem
Summary of Analytical Studies Cross. Sectional Case. Control Cohort Controlled Clinical Trial Prevalence None Incidence Outcome Multiple Single Multiple Causality No No No Yes Bias Prone Yes No No Varies Small Large Varies Duration * ** *** Cost $ $$ $$$$ Incidence/ Prevalence Sample Size
Meta-Analysis n Main Goal n n Combine the results of previous studies to reach summary conclusions about a body of research Steps n n Identify studies with relevant data Define inclusion and exclusion criteria Abstract data Analyze abstracted data statistically
Sampling Arrangement n Population n n n Inclusion and exclusion criteria Methods of Sampling (observational) Sample Assignment (experimental) Sample Size Confounding Bias
Methods of Sampling n Probability Sampling n n n n Simple random sampling Systematic sampling Stratified sampling Cluster sampling Multistage sampling Multiphase sampling Area sampling
Methods of Sampling n (continued) Non-Probability Sampling n n n Subjective (Judgment) sampling Convenient (Chunk) sampling Quota Sampling
Sample Assignment n Randomization n Fixed Allocation Randomization n n Simple Blocked Stratified Adaptive Randomization Procedures n n Baseline adaptive randomization procedure Response adaptive randomization
Sample Size n n Does size matter? Why do we care? n n Ethical Consideration Time $$$ How to calculate? n n n Table Software Expert
Sample Size Calculation n Clinically significant effect n n Ho and HA Type I Error Type II Error (or Power) Predicted rate of outcome events or Variance in the outcome measure
Confounding n n Confounding is an apparent association between disease and exposure caused by a third factor not taken into consideration A confounder is a variable that is associated with the exposure and, independent of that exposure, is a risk factor for the disease
Confounding (continued) n Examples n Study A found an association between cigar smoking and baldness. n n What is a possible confounder? Study B found an association between lead-paint ingestion and low IQ. n What is a possible confounder?
How to Control Confounding n Study Design n Restrict study eligibility Match on confounding factor Analysis n n Stratify on the confounding factor Adjust for the confounding factor n Multivariate analysis
Data Collection Arrangement n n Design of data collection form or instrument Instructions for data collection n n n Accurate / valid Precise / reliable Complete Unaffected Data storage and security Confidentiality
Statistical Analysis Plan n Statistical Methods Software Who is responsible for data analysis
Practical Considerations n n n Budget Time Supports Experiences Ethics
Collecting Research Data n n Follow the Data Collection Arrangement Coding for Missing Values Data Arrangement for Statistical Analysis Backup Data
Coding for Missing Values n Example ID 001 002 n DATE SYMPTOM Sep 16, 2002 Fever Sep 16, 2002 Question: Does ID #002 have any symptom?
Data Arrangement n n n Case II ID Date Symptom 001 Sept. 16, 2002 Fever, Rash 002 Sept. 16, 2002 Fever, Diarrhea ID Date Symptom 001 Sept. 16, 2002 Fever 001 Sept. 16, 2002 Rash 002 Sept. 16, 2002 Fever 002 Sept. 16, 2002 Diarrhea Question: Which one is better?
Analyzing Research Data n n Purpose of Statistical Analyses Commonly Uses Statistical Methods Issues in Statistical Analyses Common Statistical Errors
Purpose of Statistical Analyses n n Describe data Estimate parameters Make comparisons Assess association
Commonly Used Statistical Methods Table IV. Statistics used ______________________________________ Student’s t test 2 Fisher’s exact test Analysis of variance Linear regression Mann-Whitney U test Logistic regression Wilcoxon rank-sum test 64 63 30 21 17 11 11 9 (44%) (43%) (21%) (14%) (12%) ( 8%) ( 6%) American Journal of Obstetrics and Gynecology 1996; 175: 1138 -41
Commonly Used Statistical Methods (continued) n Describe data n n Frequency and Frequency Distribution Central Tendency n n Dispersion n Mean vs. Median Range vs. Interquartile Range Variance vs. Standard Deviation Estimate parameters n Confidence Interval
Commonly Used Statistical Methods (continued) n Make comparisons n n t-test vs. Wilcoxon Rank-Sum Test ANOVA vs. Kruskal-Wallis Test Chi-square test vs. Fisher’s Exact Test Assess association n Relative Risk; Odds Ratio Regression analysis Correlation
Example n n Clinical trials were conducted to evaluate a new weight loss drug. Outcome: Satisfaction Group Placebo Drug n Yes (%) n 1 n 2 45 1000 55 1000 Questions: Can this drug work?
Hypothesis Testing n Research Hypothesis n n The research hypothesis is the conjecture or supposition that motivates the research Statistical Hypothesis n n Statistical hypotheses are hypotheses that are stated in such a way that they may be evaluated by appropriate statistical techniques null hypothesis (HO) and alternative hypothesis (HA or H 1)
Decisions from Hypothesis Testing True Situation Decision Difference Exists (HA true) No Difference (H 0 true) Reject H 0 Power: 1 -β Type I Error: α Fail to Reject H 0 Type II Error: β _
Hypothesis Testing Steps 0. Design and Plan Study 1. Evaluate Data n continuous or discrete 2. Review Assumption n normality of the population distribution equality of variance independence of samples 3. State Hypotheses n null hypothesis n n should contain a statement of equality, either =, > or < alternative hypothesis
Hypothesis Testing Steps (continued) 4. Choose a Test Statistic = Relevant Statistic - Hypothesized Parameter Standard Error of the Relevant Statistic 5. Determine Distribution of Test Statistic under Ho 6. State Decision Rule n level of significance: 7. Calculate Test Statistic 8. Make Statistical Decision n Reject or Fail to Reject Ho
Hypothesis Testing Steps (continued) 9. Make a Conclusion n n If Ho is rejected, we conclude that HA is true If Ho is not rejected, we conclude that Ho may be true 10. Calculate the P-Value n P-value: the probability of obtaining a result as extreme as or more extreme than the actual sample value obtained given that the null hypothesis is true
Testing for Example n Outcome: Satisfaction Group Placebo Drug HO: HA : Yes (%) n 1 n 2 45 1000 55 1000 Pplacebo(Yes) = Pdrug(Yes) Pplacebo(Yes) ≠ Pdrug(Yes) n=100 for each group n=1000 for each group P=0. 16 P=0. 00 2 test
Relative Risk and Odds Ratio DISEASE STATE n n _ Risk Factor Present Absent Present A B A+B Absent C D C+D A+C B+D Relative Risk (RR) = A/(A+B) A+B+C+D C/(C+D) Odds Ratio (OR) = [A/(A+C)]/[C/(A+C)] = A/C = AD [B/(B+D)]/[D/(B+D)] B/D BC
Regression Analysis n Simple Linear Regression n n Correlation Logistic Regression Multiple Regression n n Y = β 0 + β 1 X Y = β 0 + β 1 X 1 + β 2 X 2 + …. + βn. Xn Multiple Logistic Regression
Statistical Methods for Meta-Analysis n n n Mantel-Haenszel Method Peto Method Gereral variance-based Method Statistical tests of homogeneity Der. Simonian-Laird Method
Issues in Statistical Analysis n n n Numerical vs. Graphical Representation Standard Deviation vs. Standard Error Confidence Interval vs. P-Value Relative Risk vs. Odds Ratio Statistical Significance vs. Clinical Significance
Numerical vs. Graphical Representation 1 2 Study 3 4 X Y X Y 10. 0 0 8. 04 9. 14 7. 46 8. 00 6. 58 10. 0 0 8. 00 6. 95 8. 14 6. 77 8. 00 5. 76 8. 00 13. 0 0 7. 58 8. 74 12. 7 4 8. 00 7. 71 13. 0 0 9. 00 8. 81 8. 77 7. 11 8. 00 8. 84 9. 00 11. 0 0 8. 33 9. 26 7. 81 8. 00 8. 47 11. 0 0 14. 0 0 9. 96 8. 10 8. 84 8. 00 7. 04 14. 0 0 6. 00 7. 24 6. 13 6. 08 8. 00 5. 25 6. 00 4. 26 3. 10 5. 39 19. 0 0 12. 5 0 4. 00 12. 0 0 10. 8 4 9. 13 8. 15 8. 00 5. 56 12. 0 0 7. 00 4. 82 7. 26 6. 42 8. 00 7. 91 7. 00 5. 68 4. 74 5. 73 8. 00 6. 89 5. 00 _ “Graphs in Statistical Analysis” The American Statistician, 1973; 27: 17 -21
Numerical vs. Graphical Representation (continued) Statistics for each of study • Number of observations (n) = 11 • Mean of the x’s (x) = 9. 0 • Mean of the y’s (y) = 7. 5 • Regression coefficient (b 1) of y on x = 0. 5 • Equation of regression line: y = 3 + 0. 5 x • Sum of squares of x – x = 110. 0 • Regression sum of squares = 27. 50 (1 d. f. ) • Residual sum of squares of y = 13. 75 (9 d. f. ) • Estimated standard error of b 1 = 0. 118 • Multiple R 2 = 0. 667 “Graphs in Statistical Analysis” The American Statistician, 1973; 27: 17 -21
Numerical vs. Graphical Representation (continued) “Graphs in Statistical Analysis” The American Statistician, 1973; 27: 17 -21
Graphical Representation n n n n Bar Chart Pie Chart Histogram Frequency Polygon / Percentage Polygon Box-and-Whisker Plot Scatter Plot Dot Plot Segmented Column Chart
Standard Deviation vs. Standard Error n Example: The mean weight of a population (N=10, 000) is 60 kg, and the SD is 4 kg. Calculate the SE of the mean for the followings: n n n SE=1 A random sample of n=16. SE=0. 4 A random sample of n=100. A sample of n=10, 000 (all subjects from this population). SE=?
Confidence Interval vs. P-Value n P-value n n the probability that any particular outcome would have arisen by chance. limitation of p-value the choice of cut off point Confidence Interval n the strength of the evidence is strong or weak
Confidence Interval vs. P-Value n Example: Assume the prevalence of Alzheimer’s disease in a population is 10%. n n Ho : HA : Prevalence of AD = 0. 10 Prevalence of AD 0. 10
Relative Risk vs. Odds Ratio n Example: A study of association between smoking and lung cancer Smoking Case Yes 75 No 25 Total 100 n n Odds Ratio = Relative Risk = Non-Case 4925 4975 9900 Control 50 50 100
Relative Risk vs. Odds Ratio n n Relative risk can not be used in the case -control study When the incidence of the outcome is low, odds ratio can be used to estimate relative risk n How low is low?
JAMA 1998; 280: 1690 -1691
Statistical Significance vs. Clinical Significance n n Example: Clinical trials were conducted to evaluate a new weight loss drug. Outcome: weight reduction (in pounds) Group Placebo Drug n Mean (SD) 0. 5 (10) 1. 5 (10) n 1 n 2 100 1000 Questions: Can this new drug work?
Perform Hypothesis Testing n n n Hypotheses Level of significance ( ) = 0. 05 Study 1: n=100 in each group n n n P-value: Conclusion: Study 2: n=1000 in each group n n P-value: Conclusion:
Calculate 95% Confidence Interval n Study 1: n=100 in each group n n Placebo: Drug: Difference: [-1. 5, 2. 5] [-0. 5, 3. 5] [-1. 8, 3. 8] Study 2: n=1000 in each group n n n Placebo: Drug : Difference: [-0. 1, 1. 1] [ 0. 9, 2. 1] [ 0. 1, 1. 9]
Significance: Statistical vs. Clinical Difference clinical significance no difference Significant Definitely Important Possibly Important Not Significant Not Important Inconclusive True Negative Result
Common Statistical Errors n n Inaccurate description/calculation Inappropriate use of statistical tests Extrapolation Lack of statistical power
Common Statistical Errors n Inaccurate description/calculation n n n numerical error in simple math use wrong denominator numerical inconsistency standard deviation vs. standard error did not mention one-sided or two-sided test improper use of relative risk or odds ratio
Cerebral Sinovenous Thrombosis in Children N Engl J Med 2001; 345: 417 -23
Endothelial Function and Oxidative Stress in Renovascular Hypertension N Engl J Med 2002; 346: 1954 -62 Figure 3. Correlation between the Maximal Response of Forearm Blood Flow to the Administration of Acetylcholine and Urinary Excretion of 8 -Hydroxy-2'-Deoxyguanosine (Panel A) and the Serum Malondialdehyde-Modified LDL Concentration (Panel B) before and after Angioplasty in Subjects with Renovascular Hypertension.
Common Statistical Errors n Inappropriate use of statistical tests n use simple linear regression n n n n for nonlinear data for repeated measurement without adjusting for possible confounding variables use two-sample t test instead of paired t test use t test instead of ANOVA use 2 test instead of Fisher’s exact test use 2 test instead of Mc. Nemar’s test use parametric method instead of nonparametric method
The Inexact Use of Fisher’s Exact Test in Six Major Medical Journals JAMA 1989; 261: 3430 -3433 Table 1. Specification of Use of Fisher’s Exact Test by Journal No. of Articles That Specified / No. of Articles Reviewed --------------------------------------------------- New England Journal of Medicine Annals of Internal Medicine British Medical Journal The Journal of the American Medical Association Lancet American Journal of Medicine 8 2 3 6 / / 9 4 6 16 4 / 14 0/ 7 ”This overall difference among the journals was statistically significant (P=. 01, 2 x 6 2 contingency table). ”
Reappraisal of Neonatal Clavicular Fracture: Relationship between Infant Size and Neonatal Morbidity Obstet Gynecol 2002; 100: 115 -9
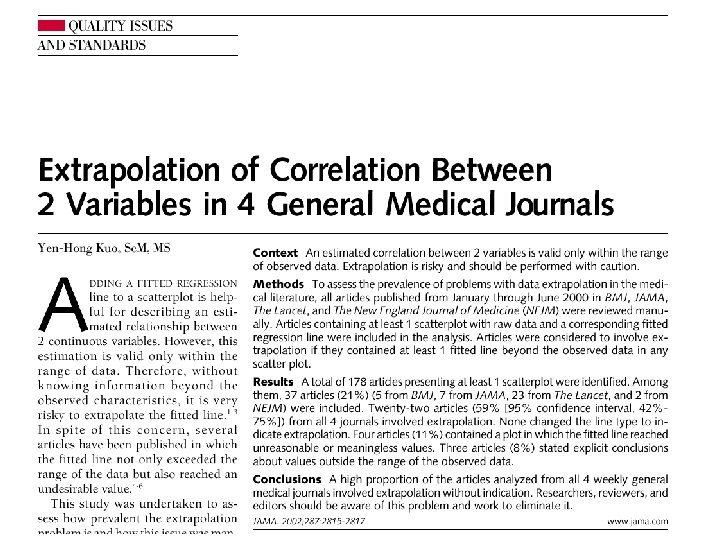
Extrapolation JAMA 2002; 287: 2815 -2817
Correlation between decrease in surface tension and proteinuria at 4 h and 24 h Dashed lines=individual regression prediction; solid line=mean regression prediction; dotted lines=95% confidence limits. Lancet 2000; 355: 901 -902
Common Statistical Errors n Lack of statistical power n n Negative results Sample size and power
Type II ( ) Errors in the Hand Literature: The Importance of Power The Journal of Hand Surgery 1998; 23 A: 20 -25 Table 2. Powers of the 39 Negative Studies 25% Reduction in the Intervention Group Power No. of Studies (%) <. 20 -. 40. 41 -. 60. 61 -. 79 . 80 17 (44) 5 (13) 6 (15) 4 (10) 7 (18) (Journal of Hand Surgery 1976 to 1996)
Type II ( ) Errors in the Hand Literature: The Importance of Power The Journal of Hand Surgery 1998; 23 A: 20 -25 Table 2. Powers of the 39 Negative Studies (continued) 50% Reduction in the Intervention Group Power No. of Studies (%) <. 20 -. 40. 41 -. 60. 61 -. 79 . 80 8 (21) 4 (10) 6 (15) 3 ( 8) 18 (46)
“Can Alcohol Cause Brain Damage? ”
Study I.
Study I. 2 test, P=. 25 Power=. 15 OR=1. 71 95% CI: [0. 69, 4. 23]
Study II. 2 test, P=. 0003 Power=. 95 OR=1. 71 95% CI: [1. 28, 2. 29]
In medical research, Sample Size Does Matter!
Calculate sample size before the study begins!
Conclusion n n n Well define hypothesis and variables Use appropriate study design and statistical methods Plan statistical analyses before the beginning of a study Know your data and use all of them Avoid measurement and statistical errors Focus on clinical significance Consult experts