CHEMISTRY Chapter 2 Analyzing Data Section 2 1


, based on")
. • Zero")

, but this is very")


- Slides: 28
CHEMISTRY Chapter 2 Analyzing Data
Section 2. 1 Units and Measurements In Chemistry, we use the SI for our measurements and calculations. There are 7 Base Units in the SI. A base unit is a defined unit in a system of measurement that is based on an object or event in the physical world, and is independent of other units.
SI Base Units
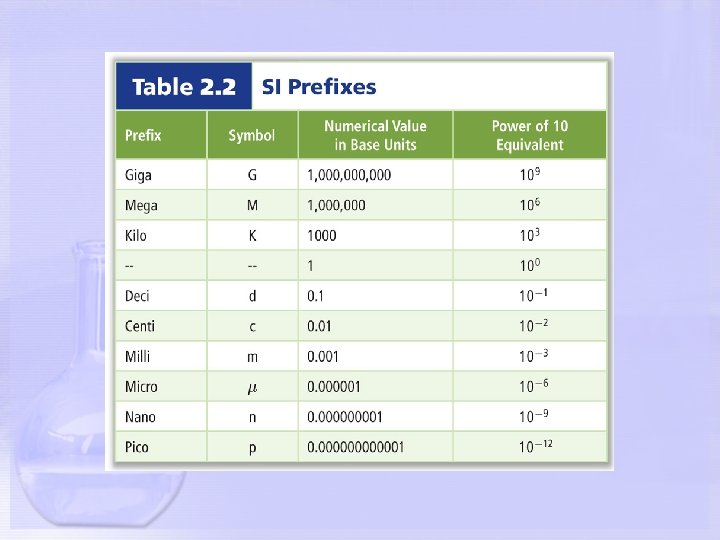
Kangaroos Have Died Drinking Chocolate Milk!!!!!!!!! Kilo Hecto 103 102 Deka 101 1 Deci Centi Milli 10 -1 10 -2 10 -3 Mega 106 Micro 10 -6
• The SI base unit of time is the second (s), based on the frequency of radiation given off by a cesium-133 atom. • The SI base unit for length is the meter (m), the distance light travels in a vacuum in 1/299, 792, 458 th of a second. • The SI base unit of mass is the kilogram (kg), about 2. 2 pounds.
• The SI base unit of temperature is the kelvin (K). • Zero kelvin is the point where there is virtually no particle motion or kinetic energy, also known as absolute zero. • Two other temperature scales are Celsius and Fahrenheit. • K = 0 C + 273
d e r u s mea e b n a c s e i t n a u q l ! ! a s t t i o n N u e s a b I S with a y a b d d e e l l n i a f c e s d i s s i t n a u th e t i s n a u b f A o n o i t a n i b com. t i n u d e v i r de y n a f o k n i h t u o y ? Can ? ? s e l p exam
• Volume is measured in cubic meters (m 3), but this is very large. A more convenient measure is the liter, or one cubic decimeter (dm 3).
• Density is a derived unit, g/cm 3, the amount of mass per unit volume. • The density equation is density = mass/volume D=M/V
Let’s Practice… 1. Find the density of aluminum if a 335 dg sample has a volume of 12. 4 m. L. Answer in g/cm 3. 2. What is the mass of a block of lead if its dimensions are 2. 5 cm by 0. 075 mm by 6. 97 cm? The density of lead is 11. 4 g/cm 3. 3. Determine the volume of a sample of air if its density is 1. 1 g/L and its mass is 0. 812 kg. 4. A coin dealer shows you an ancient gold coin that is 0. 22 dm in diameter and 0. 30 cm thick. Density gold = 19. 3 g/cm 3. What is the mass, in grams, of pure gold?
Section 2. 2 Scientific Notation and Dimensional Analysis Scientific notation can be used to express any number as a number between 1 and 10 (the coefficient) multiplied by 10 raised to a power (the exponent). • To write a number in scientific notation, count the number of places the decimal point must be moved to give a coefficient between 1 and 10. • The number of places moved equals the value of the exponent. • If the original number is >1, it will have a positive exponent or it will have a negative exponent if the original number was <1.
Time to practice… Proton Mass: 0. 00000000000001673 kg Sun Temperature: 15 000 K HIV Length: 0. 00000011 m Mass of Moon: 73 490 000 000 000 kg
Let’s work backwards now… Take these numbers out of scientific notation and write in standard form. 3. 45 x 103 L 7. 01 x 10 -6 m 2. 297 x 107 g 8. 006 x 10 -2 km
Dimensional analysis is a systematic approach to problem solving that uses conversion factors to move, or convert, from one unit to another. • A conversion factor is a ratio of equivalent values having different units. Given unit Conversion factor desired unit given unit desired unit
Practice Time again… 1. Convert 8. 9 gal to L. 2. How many cm are in a length of rope that is 21. 7 yd? 3. How many seconds pass in a typical 7 hr school day? 4. You are pulled over for going 62 mph on Main St. What is this in m/s? FYI… This is a very bad idea, don’t speed!!! 5. Convert 8275 m. L/min to gal/hr.
6. Kids can earn a free i. Phone if they raise $300 in donations. Shelby was able to get her family to pledge enough money so that she will net $28 for each mile she runs. She recently fell and is moving pretty slow, so she can only run 65 in/s. How many hours will it take Shelby to earn enough money for the i. Phone? 7. Convert 56. 2 m 3 into yd 3.
Section 2. 3 Uncertainty in Data Accuracy refers to how close a measured value is to an accepted value. Precision refers to how close a series of measurements are to one another.
Percent error expresses error as a percentage of the accepted value. % Error = │exp – acc │ (100) acc What would we always like for our % Error to equal? ? ?
Different measuring devices have different uses and different degrees of accuracy.
Significant figures include all known digits plus one estimated digit.
Pacific - Atlantic Rule for Significant Digits 1. If the decimal is present, start on the Pacific side (left) at the first nonzero digit and count it and all the digits to the right of it. 2. If the decimal is absent, start on the Atlantic side (right) at the first nonzero digit and count it and all the digits to the left of it.
• Addition and Subtraction - Round numbers so the final answer has the same number of decimal places as the measurement with the least number of decimal places. • Multiplication and Division - Round so that the final answer has the same number of significant figures as the measurement with the least number of significant figures.
Section 2. 4 Representing Data • A graph is a visual display of data that makes trends easier to see than in a table.
• A circle graph, or pie chart, has wedges that visually represent percentages of a fixed whole.
• Bar graphs are often used to show a quantity varies across categories.
• On line graphs, independent variables are plotted on the x-axis and dependent variables are plotted on the y-axis.
Interpreting Data… • Interpolation is reading and estimating values falling between points on the graph. • Extrapolation is estimating values outside the points by extending the line.