Unit 1 Analyzing Data Describing Distributions Analyzing Categorical

Unit 1: Analyzing Data – Describing Distributions Analyzing Categorical Data: Describing the Modal Category and Patterns from Sets and Displays

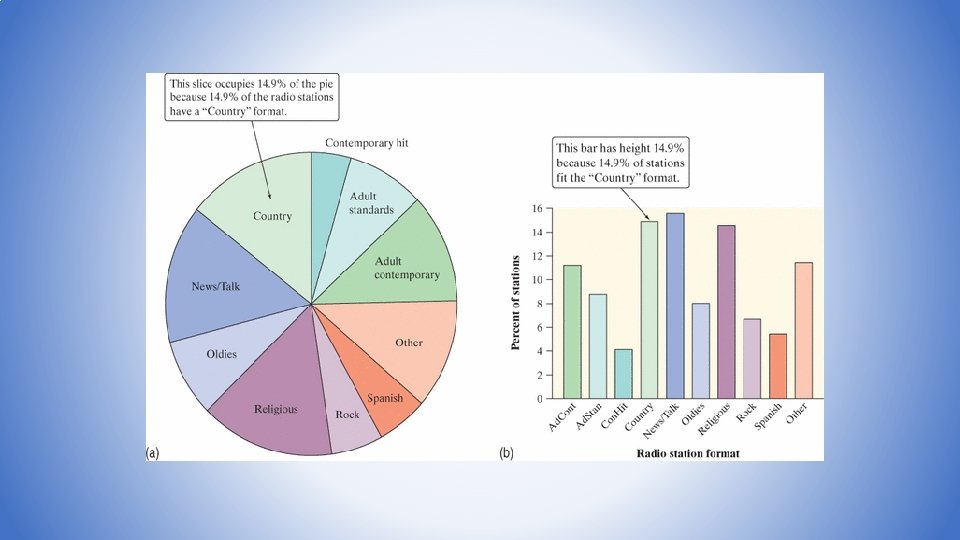
• The values of a categorical variable are labels for the different categories • The distribution of a categorical variable lists the count or percent of individuals who fall into each category. Frequency Table Format Variable Values Relative Frequency Table Count of Stations Format Percent of Stations Adult Contemporary 1556 Adult Contemporary Adult Standards 1196 Adult Standards 8. 6 Contemporary Hit 4. 1 Contemporary Hit 569 11. 2 Country 2066 Country 14. 9 News/Talk 2179 News/Talk 15. 7 Oldies 1060 Oldies Religious 2014 Religious Rock 869 Spanish Language 750 Other Formats Total 1579 13838 7. 7 14. 6 Rock Count Spanish Language Percent 6. 3 5. 4 Other Formats 11. 4 Total 99. 9 Analyzing Categorical Data • Categorical Variables place individuals into one of several groups or categories

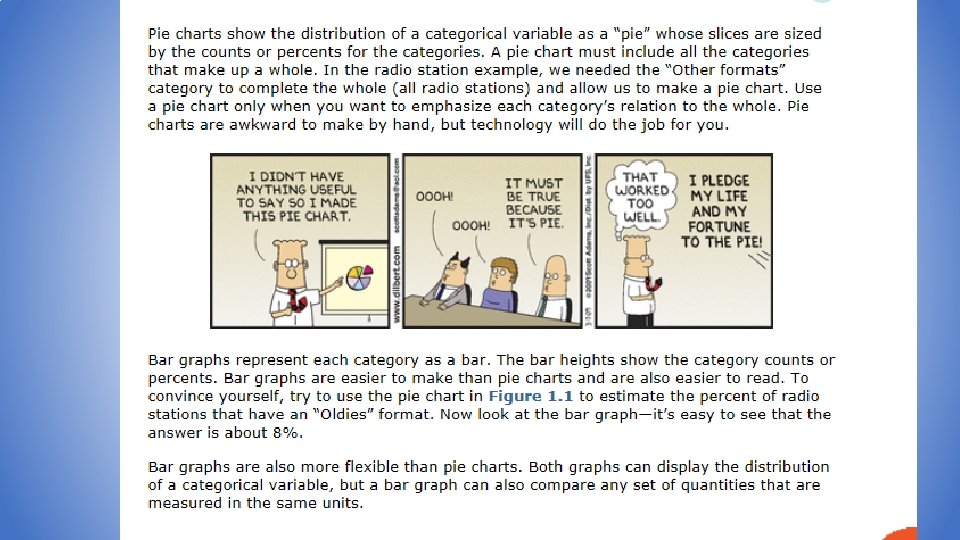
Frequency Table Format Relative Frequency Table Count of Stations Format Percent of Stations Adult Contemporary 1556 Adult Contemporary Adult Standards 1196 Adult Standards 8. 6 Contemporary Hit 4. 1 Contemporary Hit 569 11. 2 Country 2066 Country 14. 9 News/Talk 2179 News/Talk 15. 7 Oldies 1060 Oldies Religious 2014 Religious 7. 7 14. 6 Rock 869 Rock 6. 3 Spanish Language 750 Spanish Language 5. 4 Other Formats Total 1579 13838 Other Formats 11. 4 Total 99. 9 Analyzing Categorical Data • Displaying categorical data Frequency tables can be difficult to read. Sometimes is is easier to analyze a distribution by displaying it with a bar graph or pie chart.

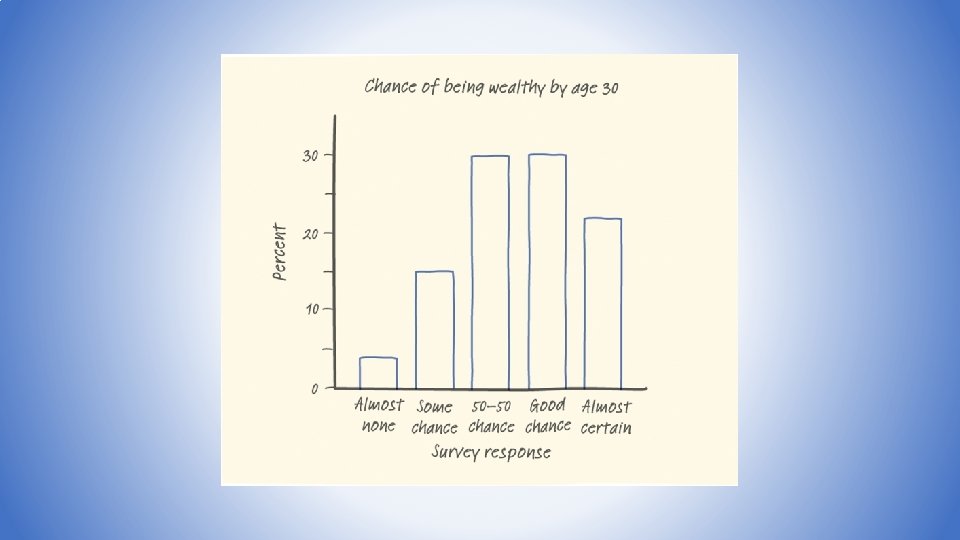
The frequency table below shows the responses to a survey that asked participants if they believed they had a change of being wealthy by the age of 30

Pie & Bar Summary • A pie chart should be used when displaying what part each category is of the whole • Must display ALL categories that make up the whole • Must total to 100% • A bar graph can be used when showing category percentages OR COUNTS • Also, use a bar graph if pieces become difficult to estimate and when comparing groups (we’ll see this tomorrow)

Classwork: Analyze our Statistical Reasoning Categorical Data • Analyze the data displayed on each of the following slides • On a sheet of paper (each student should have their own), provide: • Number your paper as you go by the slide number (top left corner of each slide) • Report the “modal category” (the mode) in context • Two OTHER observations (what can be said from the information displayed? Any patterns? ) • Let’s do the first one together

1

2

3 Which Award Would You Rather Win? 14 12 10 8 6 4 2 0 Olympic Gold Academy Award Nobel Prize

4

5 12 Commute to School 10 8 6 4 2 0 Bus Drive Get a Ride It Varies

6

7

8

9 Play an Organized Sport 20 18 16 14 12 10 8 6 4 2 0 Yes No

10

11
- Slides: 20