Data Collecting Organizing Analyzing DATA TABLES VARIABLES w

Data Collecting, Organizing & Analyzing

& DATA TABLES

VARIABLES w In an experiment there are 2 types of variables • INDEPENDENT VARIABLES (manipulated) & • DEPENDANT VARIABLES (responding)

INDEPENDENT VARIABLE w This is the variable we can control in an experiment. w Independent variables are set up ahead of time, before you start following your procedures (sometimes called controlled parameters)
 • Distance (meters) •")
INDEPENDENT VARIABLE w Examples of Independent variables: • Time (seconds) • Distance (meters) • Amount (grams)

DEPENDENT VARIABLE w Dependent variables are measured during the experiment, after you start following your procedures (sometimes called responding variables).

DEPENDENT VARIABLE w Examples of common Dependent variables: • Temperature, Mass or amounts that change as you go.

Data table columns : IV on left, � DV on the right.

GRAPHING NOTES Refer to these as needed!

RULES OF GRAPHING w Follow these simple rules for GREAT GRAPHS

RULE # 1. w 1. Always draw neat lines with a straight edge or RULER!

RULE # 2. w Make your graph 1/2 page or 1 full page in size. w The bigger the graph the better to see your data!

Rule #3 w Label three places on your graph. w 1. TITLE
 vs. X (independent variable). w")
Title Tips Most graphs are titled Y (dependent variable) vs. X (independent variable). w Or, you can use… The effect of (Independent Variable) on the (Dependent Variable). w The graph title describes the data plotted on the graph. w

What does the graph describe?

RULE # 3 cont. w 2. label the x -axis with the independent variable.

RULE # 3 cont. w 3. label the y-axis with the dependent variable.

Which is which?

Don’t forget to label the units on each axis!

RULE # 4. w Number the x and y axis with a numerical sequence starting with 0, so it fills the entire axis. • examples: 0, 5, 10, 15. . . • 0, 2, 4, 6, . . , 0, 0. 5, 1. 0, 1. 5, 2. 0
 w Subtract the smallest value of a single variable from")
Determining Range (p. 52) w Subtract the smallest value of a single variable from the largest value of the same variable.

What would the range of data be for these axes?

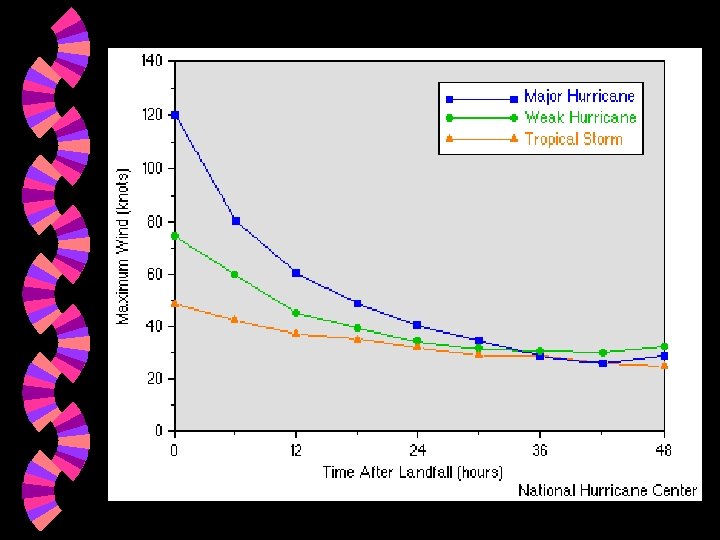
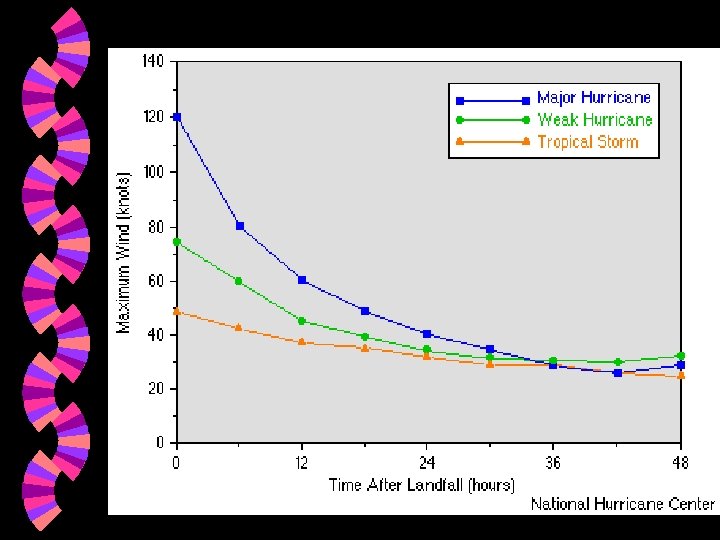
Set the scale of the graph. The scale is the size that is used for each box or grid mark on the graph. w Ex. If your range is 140 you need to choose the scale at specific intervals (every 20 for example) scaled to fit most of the available space. w Remember to use most of the page for your graph! w

RULE # 5. w Number the x and y axis on the lines of the graph paper, not the spaces between the lines.

RULE # 6. w If your graph shows more than one trial of data, or has more than 1 line, USE A KEY w A key can be different colored lines, lines with different textures or patterns.

Data Points ØPlot the data points by putting a dot on the graph for each pair of data in the data table.

Why Draw a Line of Best Fit? w A line of best fit emphasizes the overall trend shown by all the data taken as a whole.

Let’s Practice Complete the Quick Lab on p. 52 #1 -4. *Follow the instructions for graphing and attach the graph to your work.

The End Good Luck and Happy Data Collecting!
- Slides: 31