PHYSICAL CHEMISTRY ERT 108 Semester II 20102011 Huzairy


 (Eq. 6. 15) is the standard equilibrium constant (or the standard")


 Using")
 From Appendix data, for NO 2(g) and N 2 O 4(g); =")

 is assumed independent of T, then; Appendix data gives , then �")
 – plots ΔHº, ΔSº, ΔGº and R ln Kºp vs.")

 / (0. 004 K-1 - 0. 0022")


![Solution: Step 1 Use Appendix data to get ; =[2 (NO 2, g)] -](https://slidetodoc.com/presentation_image_h2/513475671682954350adf6ecc240ea6e/image-35.jpg "Solution: Step 1 Use Appendix data to get ; =[2 (NO 2, g)] -")


- Slides: 39
PHYSICAL CHEMISTRY ERT 108 Semester II 2010/2011 Huzairy Hassan School of Bioprocess Engineering Uni. MAP
Reaction Equilibrium in Ideal Gas Mixtures
Introduction Calculate the equilibrium composition for an ideal-gas reaction from the initial composition, the temperature and pressure, and. To apply the equilibrium condition to an ideal-gas reaction, we need to relate the chemical potential of a component of an ideal gas mixture to observable properties.
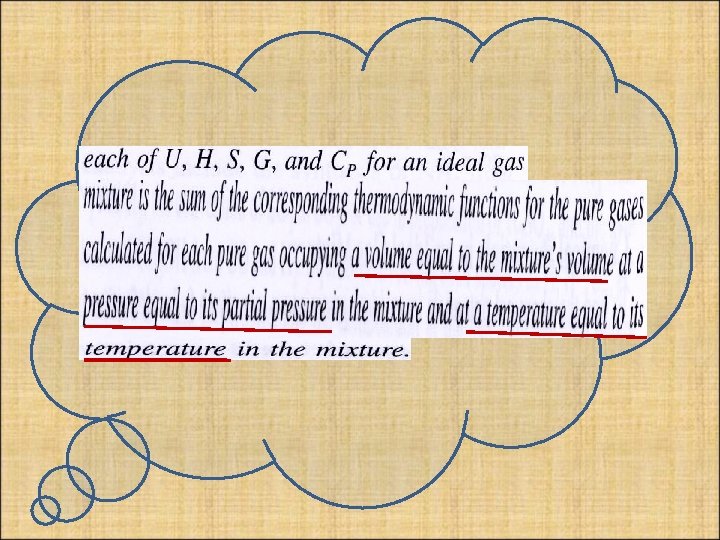
Chemical Potentials in an Ideal Gas Mixture Chemical Potential of a Pure Ideal Gas, µ - µ for a pure gas depends on T and P only. - Since for reaction equilibrium mostly studied at constant T while the partial pressure of the reacting gases vary. variation of µ with pressure.
The Gibbs equation for d. G for a fixed amount of substance is: and division by the number of moles of the pure ideal gas gives; Since the chemical potential µ of a pure substance equals (Eq 4. 86), for constant T, this equation becomes;
If the gas undergoes an isothermal change of state from pressure P 1 and P 2, integration gives; )
Figure 6. 1 plots at fixed T. For a pure ideal gas; and Hm is independent of pressure. So, the pressure dependence of µ in the figure is due to the change of Sm with P. In the zero pressure, S becomes infinite, and µ goes to -.
Chemical Potentials in an Ideal Gas Mixture Definition; - An ideal gas mixture is a gas mixture having the following properties: (1) the equation of state is obeyed for all temperatures, pressures, and compositions (ntot is the total number of moles of gas) (2) if the mixture is separated from pure gas i (i is any one of the mixture’s component) by a thermally conducting rigid membrane permeable to gas i only, then at equilibrium the partial pressure of gas i in the mixture is equal to the pressure of the puregas-i system.
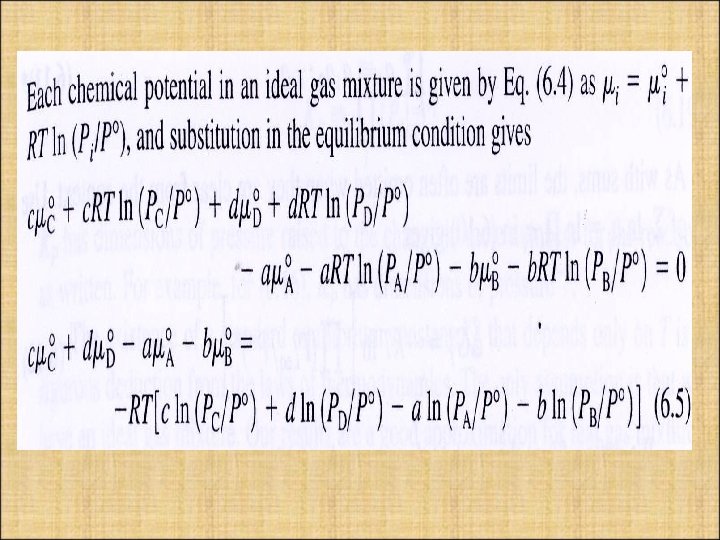
The standard state of component i of an ideal gas mixture at temperature T is defined to be pure ideal gas i at T and pressure P⁰ ≡ 1 bar. Let be the chemical potential of gas i in the mixture, and let be the chemical potential of the pure gas in equilibrium with the mixture through the membrane. For phase equilibrium, From condition (2), at equilibrium. Therefore for ideal gas mixture; (Eq. 6. 3)
From Equations 6. 2 and 6. 3; Is the fundamental thermodynamic equation for an ideal gas mixture. Where is the partial pressure of gas i in the mixture, and is the chemical potential of pure ideal gas i at the standard pressure of 1 bar and at the same temperature T as the mixture.
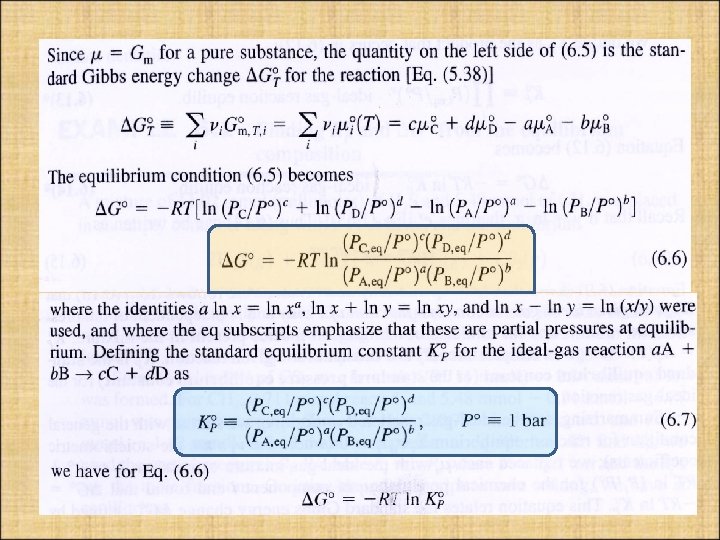
Ideal-Gas Reaction Equilibrium Now, we specialize to the case where all reactants and products are ideal gasses. For the ideal-gas reaction:
(Eq. 6. 14) (Eq. 6. 15) is the standard equilibrium constant (or the standard pressure equilibrium constant) for the ideal-gas reaction.
For example, for the ideal-gas reaction; From Eq. 6. 7; � The standard equilibrium constant (Eq. 6. 18) is dimensionless.
Example 6. 1 - Finding equilibrium composition. and ΔGº from the
Solution: Since 0. 711 mmol of CS 2 was formed, so, for H 2 (the same); 4(0. 711 mmol) = 2. 84 mmol of H 2 was formed. For CH 4 (0. 711 mmol reacted), 5. 48 mmol – 1(0. 711) mmol = 4. 77 mmol CH 4 present at equilibrium. For H 2 S, 11. 02 mmol – 2(0. 711) mmol = 9. 60 mmol H 2 S present at equilibrium. To find , we need partial pressure. We have P = 762 torr and xi are the mole fractions. and
At equilibrium; we have total moles = 9. 60 + 4. 77 + 2. 84 + 0. 711 = 17. 92 and partial pressure,
For the ; �
Temperature Dependence of the Equilibrium Constant Differentiation of Use of with respect to T; gives; (pressure fixed at 1 bar)
From Equation 6. 32 & 6. 33; Where is the reaction’s standard entropy change, then; Since ΔGº = ΔHº - T ΔSº, then; van’t Hoff equation
Multiplication of Eq. 6. 36 by d. T and integration from T 1 to T 2 gives; *
Example 6. 2 Find Change of with T at 600 K for (a) Using the approximation that ΔHº is independent of T; (b) Using the approximation that is independent of T
Solution: (a) From Appendix data, for NO 2(g) and N 2 O 4(g); = 57. 20 k. J/mol = 4730 J/mol From ΔG⁰ = - RT ln = = e – ((4730 J/mol) / (- 8. 314 J/mol K x 298 K)) = 0. 148
From Eq. 6. 39; �
(b) is assumed independent of T, then; Appendix data gives , then �
Figure 6. 6 (a) – plots ΔHº, ΔSº, ΔGº and R ln Kºp vs. T (b) - plots ln Kºp vs. 1/T
Example 6. 3 ΔH⁰ from K⁰P versus T data Use Figure 6. 6 b to estimate ΔH⁰ for temperatures in the range 300 K to 500 K. Solution: Since only an estimation, consider the line is straight. We have 2 points; T-1 = 0. 0040 K-1 , ln Kºp = 20. 0 T-1 = 0. 0022 K-1 , ln Kºp = 0
Hence, the slope is; (20 – 0) / (0. 004 K-1 - 0. 0022 K-1) = 1. 1 x 10⁴ K The slope of plot ln Kºp vs. K-1 is -ΔHº / R, so ΔH⁰ = -R X slope = -(1. 987 cal/mol K)(1. 1 x 10⁴ K) = -22 kcal/mol � (in agreement with Figure 6. 6 a)
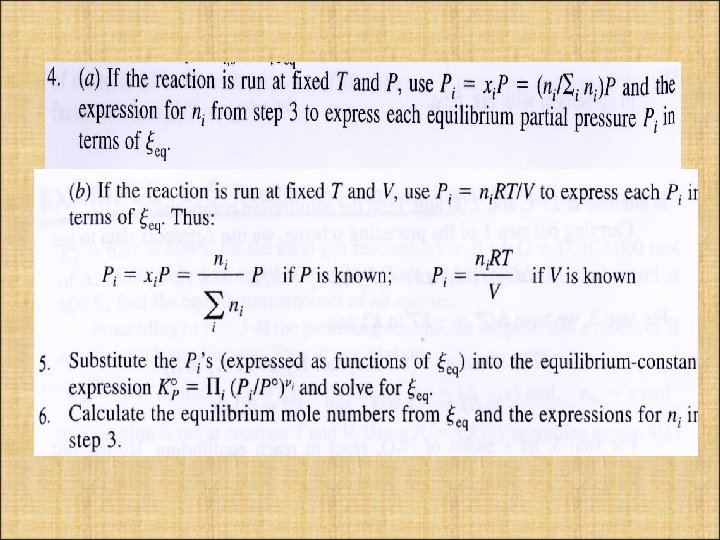
Ideal–gas Equilibrium Calculations Aims- find the equilibrium composition of an ideal-gas reaction mixture and - Equilibrium composition is related to the initial composition by a single variable, the equilibrium extent of reaction ; where ni, 0 is the number of moles of substance i present at the start of reaction. - ξ measures how much reaction has occurred.
The specific steps to find the equilibrium composition of an ideal-gas reaction mixture as follows;
Example 6. 4 Equilibrium composition at fixed T and P Find the equilibrium composition.
Solution: Step 1 Use Appendix data to get ; =[2 (NO 2, g)] - [ (N 2 O 4, g)] = 2(51. 31) – 97. 89 = 4. 73 k. J/mol Step 2
Step 3 Step 4
Step 5
Step 6
Thank you