Oracle Wait Events That Everyone Should Know Kerry



















- Slides: 53
Oracle Wait Events That Everyone Should Know Kerry Osborne Senior Oracle Guy
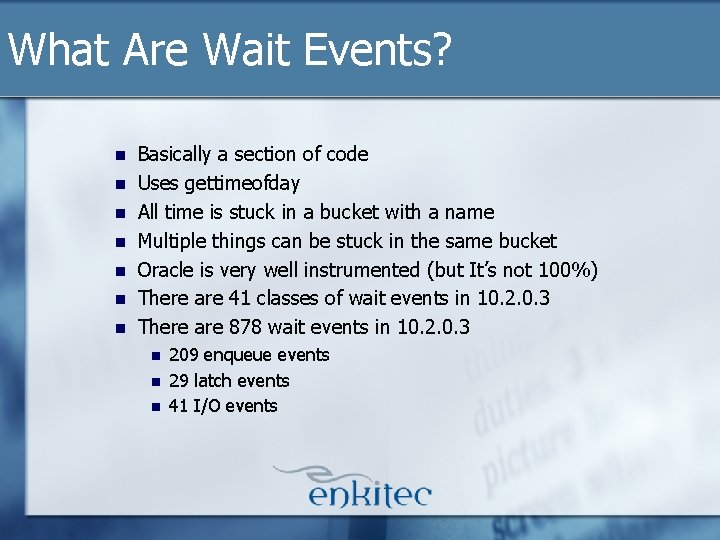
What Are Wait Events? n n n n Basically a section of code Uses gettimeofday All time is stuck in a bucket with a name Multiple things can be stuck in the same bucket Oracle is very well instrumented (but It’s not 100%) There are 41 classes of wait events in 10. 2. 0. 3 There are 878 wait events in 10. 2. 0. 3 n n n 209 enqueue events 29 latch events 41 I/O events
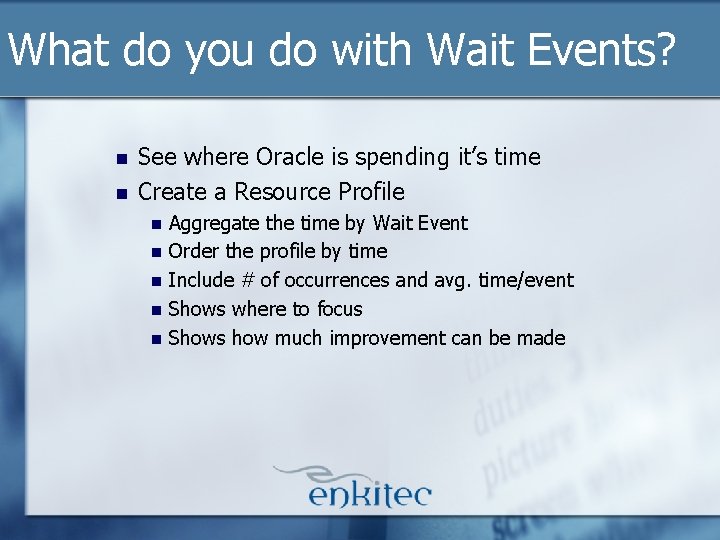
What do you do with Wait Events? n n See where Oracle is spending it’s time Create a Resource Profile n n n Aggregate the time by Wait Event Order the profile by time Include # of occurrences and avg. time/event Shows where to focus Shows how much improvement can be made
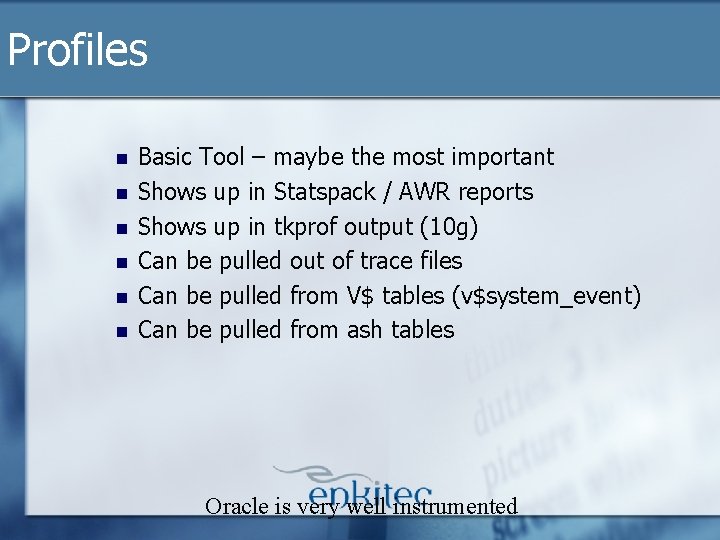
Profiles n n n Basic Tool – maybe the most important Shows up in Statspack / AWR reports Shows up in tkprof output (10 g) Can be pulled out of trace files Can be pulled from V$ tables (v$system_event) Can be pulled from ash tables Oracle is very well instrumented
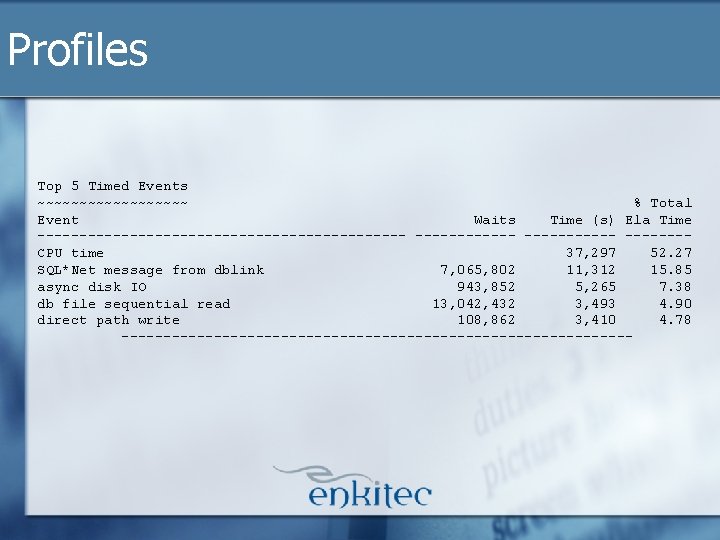
Profiles Top 5 Timed Events ~~~~~~~~~ % Total Event Waits Time (s) Ela Time ---------------------- -------CPU time 37, 297 52. 27 SQL*Net message from dblink 7, 065, 802 11, 312 15. 85 async disk IO 943, 852 5, 265 7. 38 db file sequential read 13, 042, 432 3, 493 4. 90 direct path write 108, 862 3, 410 4. 78 -------------------------------
Why should developers know this stuff? 1. 2. Because you need to know where your code is spending it’s time Scalability is Important
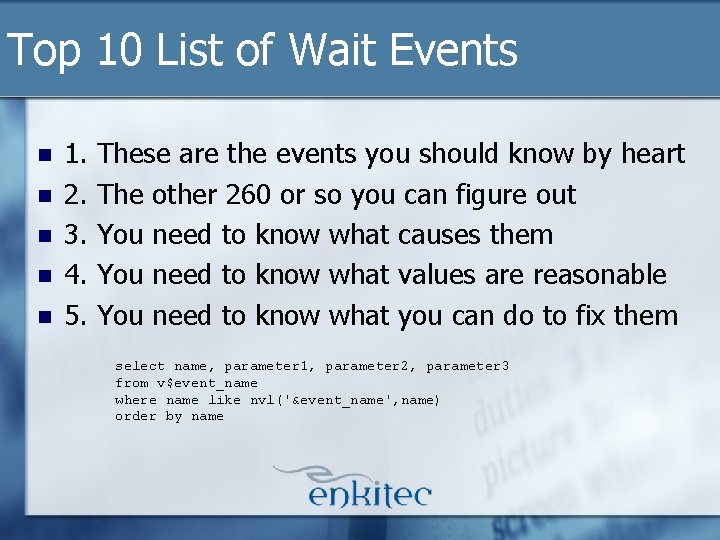
Top 10 List of Wait Events n n n 1. 2. 3. 4. 5. These are the events you should know by heart The other 260 or so you can figure out You need to know what causes them You need to know what values are reasonable You need to know what you can do to fix them select name, parameter 1, parameter 2, parameter 3 from v$event_name where name like nvl('&event_name', name) order by name
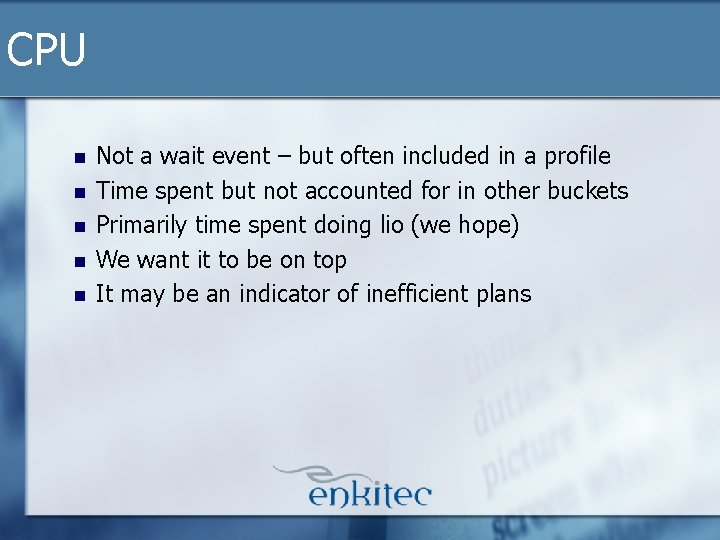
CPU n n n Not a wait event – but often included in a profile Time spent but not accounted for in other buckets Primarily time spent doing lio (we hope) We want it to be on top It may be an indicator of inefficient plans
DB File Sequential Read n n n Single block read Usually index block or data block via rowid Can be done by fts to get chained rows P 1=file, P 2=block, P 3=# of blocks (always 1) Always a user’s server process reading into buffer cache Reasonable e values: <10 ms WAIT #14: nam='db file sequential read' ela= 36745 file#=1 block#=67745 blocks=1 obj#=84920
DB File Sequential Read – “fixes” n Do Less Work n n n Do the Work Faster n n tune SQL n reduce lio’s 7 / obj rule of thumb n Explain plan lies (see notes on this slide) bigger buffer cache Speed up I/O Call Jack
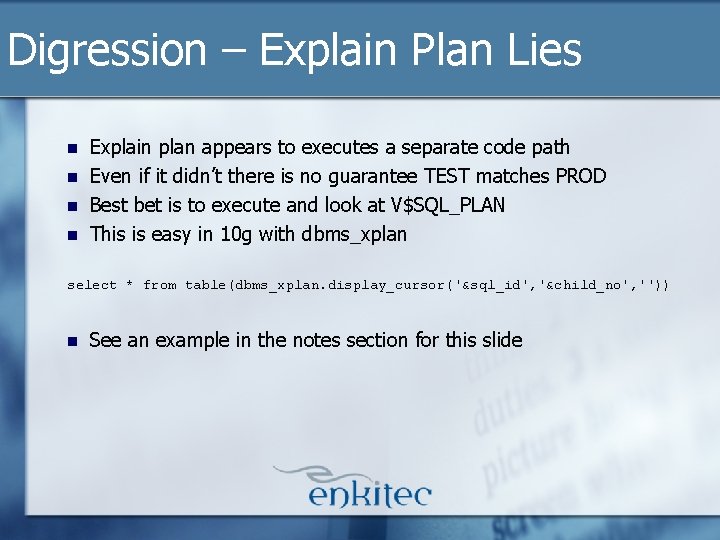
Digression – Explain Plan Lies n n Explain plan appears to executes a separate code path Even if it didn’t there is no guarantee TEST matches PROD Best bet is to execute and look at V$SQL_PLAN This is easy in 10 g with dbms_xplan select * from table(dbms_xplan. display_cursor('&sql_id', '&child_no', '')) n See an example in the notes section for this slide
DB File Scattered Read n n n Multi block read Usually full table scan or index fast full scan P 1=file, P 2=block, P 3=# of blocks (always < MBRC) Always a user’s server process reading into buffer cache Reasonable ela values: <10 ms Relevant parameters: n n DBFMBRC, System Stats: MBRC, _db_file_exec_read_count, _db_file_optimizer_read_count WAIT #14: nam='db file scattered read' ela= 19389 file#=139 block#=44 blocks=5 obj#=83580
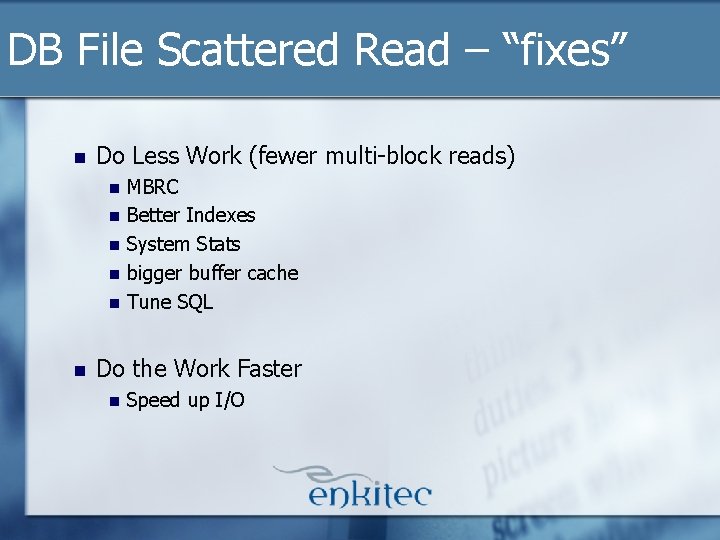
DB File Scattered Read – “fixes” n Do Less Work (fewer multi-block reads) n n n MBRC Better Indexes System Stats bigger buffer cache Tune SQL Do the Work Faster n Speed up I/O
Direct Path Read/Write n n n Usually sorting to Temp Can also be parallel query Could also be insert append, etc… Reasonable ela values: <20 ms Relevant parameters: n n DBFMBRC _db_file_direct_io_count (1 M) WAIT #10: nam='direct path write' ela= 4475 p 1=401 p 2=1518353 p 3=57 WAIT #10: nam='direct path read' ela= 16770 p 1=401 p 2=1482031 p 3=63
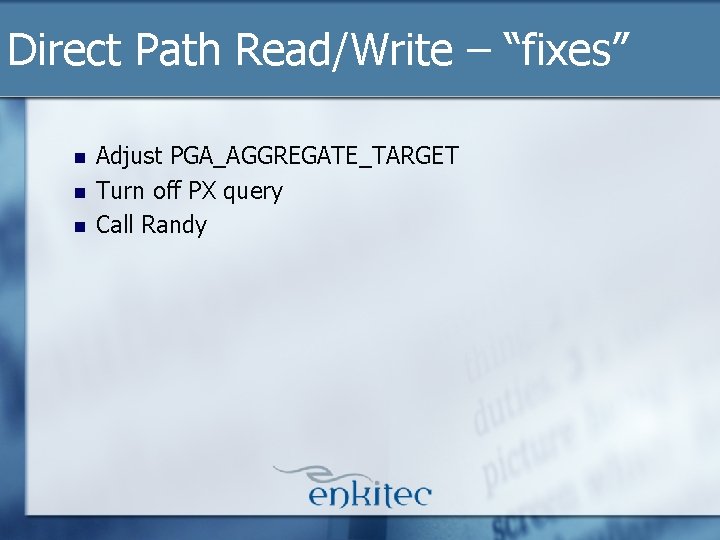
Direct Path Read/Write – “fixes” n n n Adjust PGA_AGGREGATE_TARGET Turn off PX query Call Randy
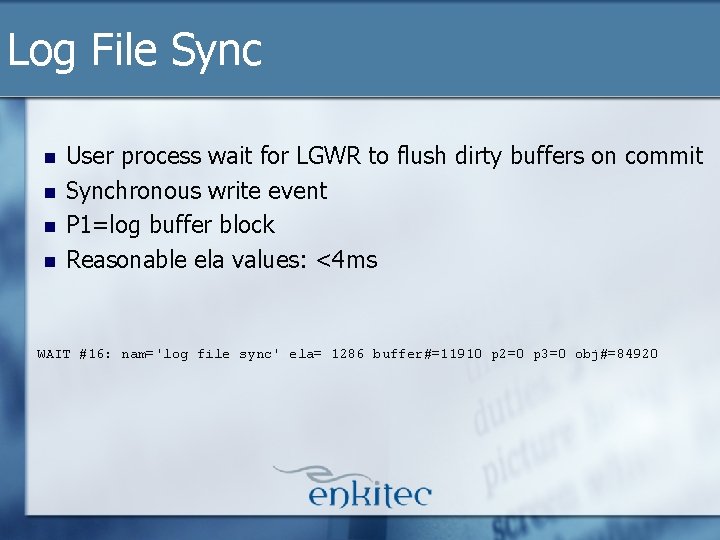
Log File Sync n n User process wait for LGWR to flush dirty buffers on commit Synchronous write event P 1=log buffer block Reasonable ela values: <4 ms WAIT #16: nam='log file sync' ela= 1286 buffer#=11910 p 2=0 p 3=0 obj#=84920
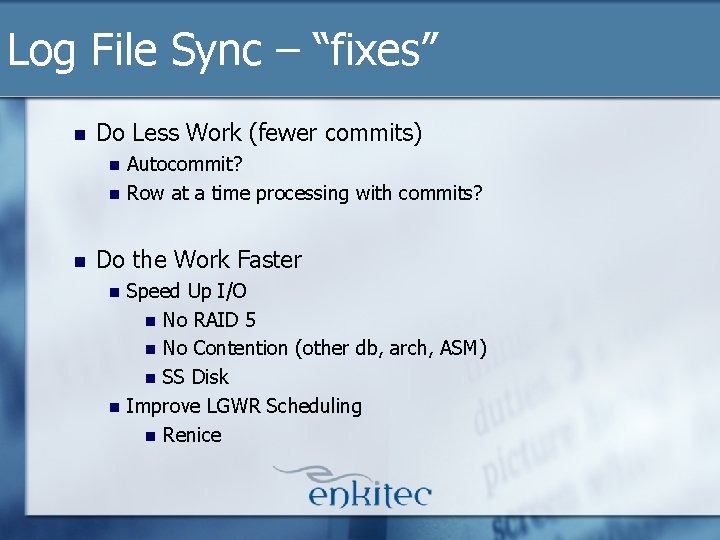
Log File Sync – “fixes” n Do Less Work (fewer commits) n n n Autocommit? Row at a time processing with commits? Do the Work Faster n n Speed Up I/O n No RAID 5 n No Contention (other db, arch, ASM) n SS Disk Improve LGWR Scheduling n Renice
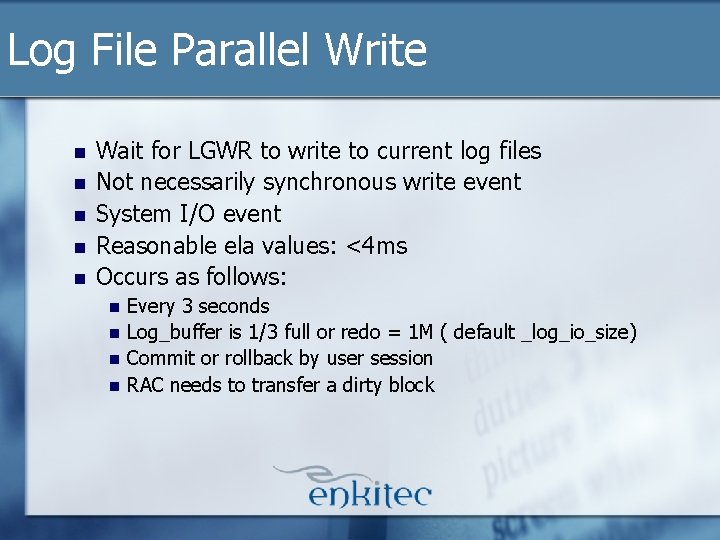
Log File Parallel Write n n n Wait for LGWR to write to current log files Not necessarily synchronous write event System I/O event Reasonable ela values: <4 ms Occurs as follows: n n Every 3 seconds Log_buffer is 1/3 full or redo = 1 M ( default _log_io_size) Commit or rollback by user session RAC needs to transfer a dirty block
Log File Parallel Write – “fixes” n Often fixed by fixing Log File Sync (i. e. speed up i/o, etc) n Force LGWR to write more often
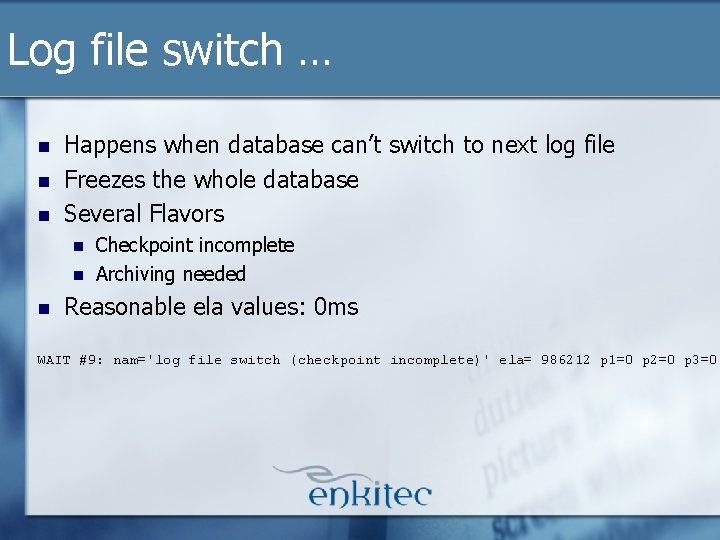
Log file switch … n n n Happens when database can’t switch to next log file Freezes the whole database Several Flavors n n n Checkpoint incomplete Archiving needed Reasonable ela values: 0 ms WAIT #9: nam='log file switch (checkpoint incomplete)' ela= 986212 p 1=0 p 2=0 p 3=0
Log file switch … – “fixes” n n Do less work Make total online log space bigger Force more frequent incremental checkpoints Speed up i/o
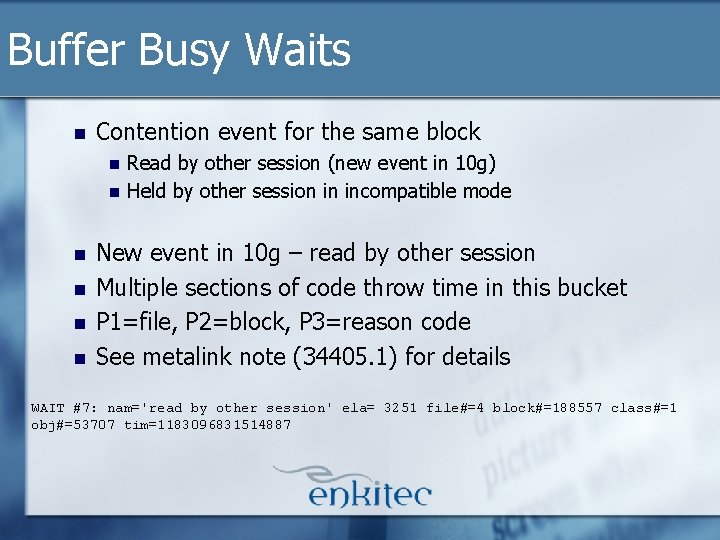
Buffer Busy Waits n Contention event for the same block n n n Read by other session (new event in 10 g) Held by other session in incompatible mode New event in 10 g – read by other session Multiple sections of code throw time in this bucket P 1=file, P 2=block, P 3=reason code See metalink note (34405. 1) for details WAIT #7: nam='read by other session' ela= 3251 file#=4 block#=188557 class#=1 obj#=53707 tim=1183096831514887
Buffer Busy Waits - “fixes” n n It’s complicated – but basically - eliminate the contention For Read by Other Session n n Do Less Work (tune SQL to do less lio) Eliminate i/o – bigger buffer cache, etc… Speed up i/o For Others n n Find type of hot objects and statements suffering Address issue - ASSM, Freelist groups (RAC), etc. .
Free Buffer Waits n No place to put a new block
Free Buffer Waits - “fixes” n Do Less Work n n Reduce the amount of lio Make more buffer space available n n Add memory to the buffer cache Speed up DBWR to flush blocks more quickly n Async_io n More dbwr processes n Renice
SQL*Net message from client n n n Database is idle – waiting on next request from client Often marked as an idle event which it may be Time distribution can be skewed Common technique to ignore anything over 1 sec Reasonable e values: <2 ms Protocol should be tcp (or beq for local processes) WAIT #1: nam='SQL*Net message from client' ela= 336 driver id=1650815232 #bytes=1 p 3=0 obj#=83660
SQL*Net message from client – “fixes” n n n Speed up app server Reduce the number of calls Use the right protocol (tcp to beq) Call network guy Get the users to type faster
SQL*Net more data from client n More than 1 packet required to send SQL statement
SQL*Net more data from client – “fixes” n n Don’t send 50 K SQL statements Use packages
SQL*Net message to Client n n n Time to send a SQL*Net message to a client (sort of) Actually time it took to write the return data from Oracle’s userland SDU buffer to OS kernel-land TCP socket buffer (Tanel Poder) Often marked as an idle event which it may be Reasonable e values: <1 ms (micro seconds actually) P 1=bytes (usually 1 ? ? ? ) WAIT #1: nam='SQL*Net message to client' ela= 2 driver id=1650815232 #bytes=1 p 3=0 obj#=83660
SQL*Net message to Client – “fixes” n n n Use correct protocol Fix network issue Call Andy
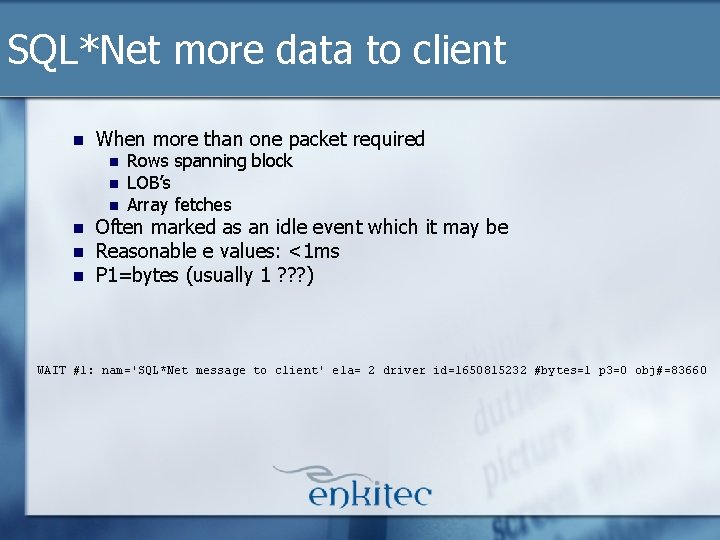
SQL*Net more data to client n When more than one packet required n n n Rows spanning block LOB’s Array fetches Often marked as an idle event which it may be Reasonable e values: <1 ms P 1=bytes (usually 1 ? ? ? ) WAIT #1: nam='SQL*Net message to client' ela= 2 driver id=1650815232 #bytes=1 p 3=0 obj#=83660
SQL*Net more data to client – “fixes” n n n Fix chained/migrated rows Don’t use LOBs Nothing to fix
Enqueues n Locks for objects n n n Que up in order 9 i lumped them all together 10 g has 209 separate events
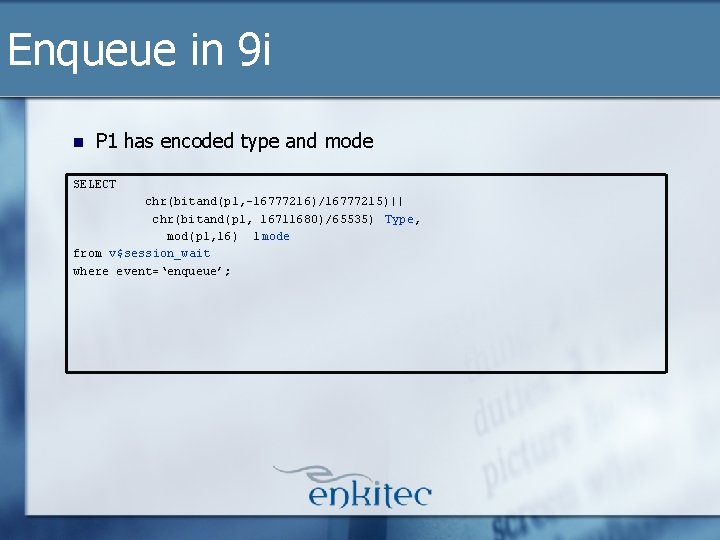
Enqueue in 9 i n P 1 has encoded type and mode SELECT chr(bitand(p 1, -16777216)/16777215)|| chr(bitand(p 1, 16711680)/65535) Type, mod(p 1, 16) l mode from v$session_wait where event=‘enqueue’;
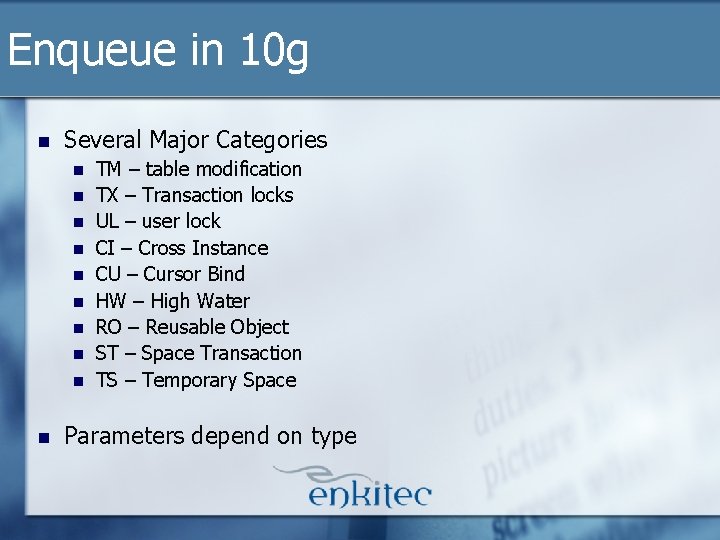
Enqueue in 10 g n Several Major Categories n n n n n TM – table modification TX – Transaction locks UL – user lock CI – Cross Instance CU – Cursor Bind HW – High Water RO – Reusable Object ST – Space Transaction TS – Temporary Space Parameters depend on type
Enqueue: TX row lock n User can’t modify block until other user commits
Enqueue: TX row lock – “fixes” n n n Use ash tables to find statements waiting Fix the code Or do what one of our clients did: write some code to kill any processes blocking for more than 60 seconds – lot’s easier than changing the app
Enqueue: SQ n n Waiting on exclusive access to a sequence Seems minor but can actually be a big issue on some systems
Enqueue: SQ – “fixes” n n Cache the sequence Use NOORDER in RAC
Latches n Locks internal memory structures n n n n Not ordered Very light weight Kid Asking for Candy Model Spins vs. Sleeps (_spin_count, _latch_class_X) Wait events do not include time spent spinning 9 i lumped them all together 10 g has 28 separate events
Latches in 9 i n n All dumped in the Latch Free event P 2 has latch# WAIT #9: nam='latch free' ela= 185 p 1=-4611686003650090584 p 2=157 p 3=0 SQL> Select name from v$latch where latch#=157; NAME --------------------library cache
Latches in 10 g n Primarily Deal with major SGA areas n Shared Pool n n Buffer Cache n n n Latch: cache buffer chains Latch: cache buffers lru chain Log Buffer n n Latch: shared pool Latch: library cache Latch row cache Latch: redo … Parameters depend on type (see v$event_name)
Latch: cache buffers chains n n n Each block hashes to a chain Several chains per latch Several latches per instance (default based on cache size)
Latch: cache buffers chains –”fixes” n n Find hot blocks Fix bad SQL Maybe Increase number of latches Maybe decrease rows per block
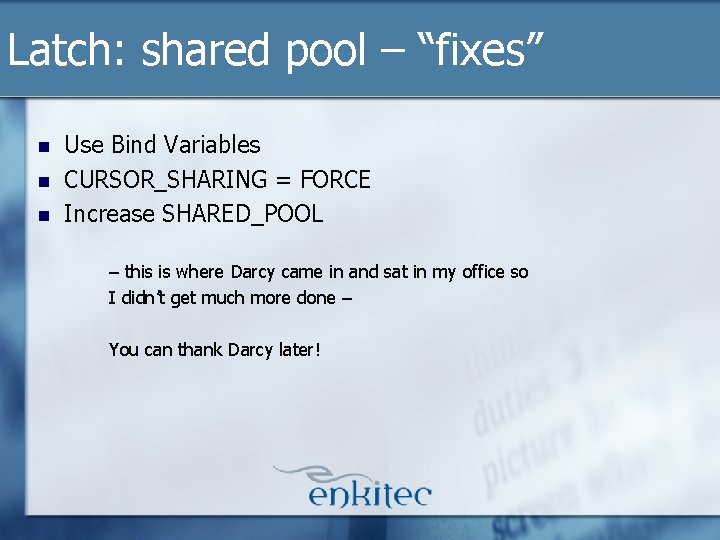
Latch: shared pool n Shared Pool Contention n n Due primarily to parsing See also latch: library cache … WAIT #28: nam='latch: shared pool' ela= 751 address=1611562656 number=213 tries=1 j#=46024
Latch: shared pool – “fixes” n n n Use Bind Variables CURSOR_SHARING = FORCE Increase SHARED_POOL – this is where Darcy came in and sat in my office so I didn’t get much more done – You can thank Darcy later!
Unaccounted for n n n Some tools show this (Hotsos Profiler) Indicates lost time due to rounding (small) Or lost time due to CPU contention (large)
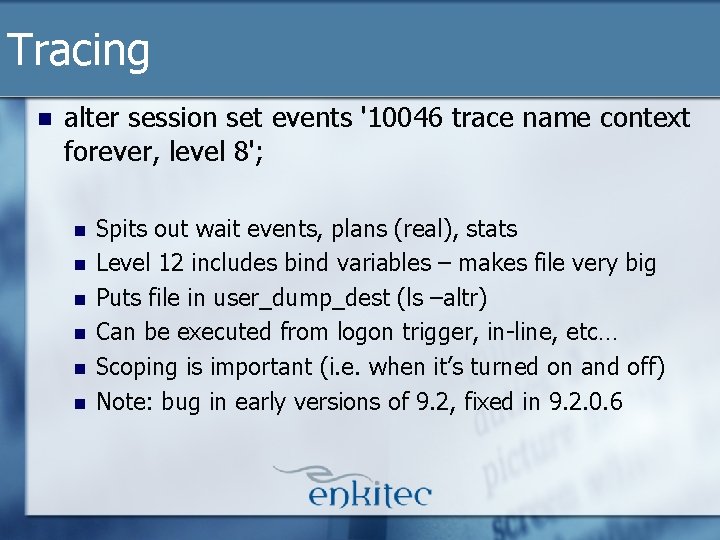
Tracing n alter session set events '10046 trace name context forever, level 8'; n n n Spits out wait events, plans (real), stats Level 12 includes bind variables – makes file very big Puts file in user_dump_dest (ls –altr) Can be executed from logon trigger, in-line, etc… Scoping is important (i. e. when it’s turned on and off) Note: bug in early versions of 9. 2, fixed in 9. 2. 0. 6
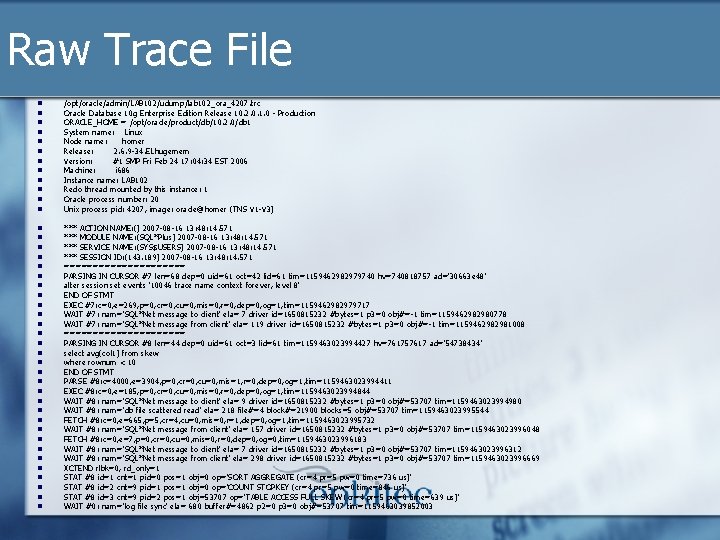
Trace File Contents n n n n WAIT FETCH EXEC PARSE STAT XCTEND PARSING IN CURSOR
Raw Trace File n n n /opt/oracle/admin/LAB 102/udump/lab 102_ora_4207. trc Oracle Database 10 g Enterprise Edition Release 10. 2. 0. 1. 0 - Production ORACLE_HOME = /opt/oracle/product/db/10. 2. 0/db 1 System name: Linux Node name: homer Release: 2. 6. 9 -34. ELhugemem Version: #1 SMP Fri Feb 24 17: 04: 34 EST 2006 Machine: i 686 Instance name: LAB 102 Redo thread mounted by this instance: 1 Oracle process number: 20 Unix process pid: 4207, image: oracle@homer (TNS V 1 -V 3) n n n n n n n n *** ACTION NAME: () 2007 -08 -16 13: 48: 14. 571 *** MODULE NAME: (SQL*Plus) 2007 -08 -16 13: 48: 14. 571 *** SERVICE NAME: (SYS$USERS) 2007 -08 -16 13: 48: 14. 571 *** SESSION ID: (143. 189) 2007 -08 -16 13: 48: 14. 571 =========== PARSING IN CURSOR #7 len=68 dep=0 uid=61 oct=42 lid=61 tim=1159462982979740 hv=740818757 ad='30663 e 48' alter session set events '10046 trace name context forever, level 8' END OF STMT EXEC #7: c=0, e=269, p=0, cr=0, cu=0, mis=0, r=0, dep=0, og=1, tim=1159462982979717 WAIT #7: nam='SQL*Net message to client' ela= 7 driver id=1650815232 #bytes=1 p 3=0 obj#=-1 tim=1159462982980778 WAIT #7: nam='SQL*Net message from client' ela= 119 driver id=1650815232 #bytes=1 p 3=0 obj#=-1 tim=1159462982981008 =========== PARSING IN CURSOR #8 len=44 dep=0 uid=61 oct=3 lid=61 tim=1159463023994427 hv=761757617 ad='54738434' select avg(col 1) from skew where rownum < 10 END OF STMT PARSE #8: c=4000, e=3904, p=0, cr=0, cu=0, mis=1, r=0, dep=0, og=1, tim=1159463023994411 EXEC #8: c=0, e=185, p=0, cr=0, cu=0, mis=0, r=0, dep=0, og=1, tim=1159463023994844 WAIT #8: nam='SQL*Net message to client' ela= 9 driver id=1650815232 #bytes=1 p 3=0 obj#=53707 tim=1159463023994980 WAIT #8: nam='db file scattered read' ela= 218 file#=4 block#=21900 blocks=5 obj#=53707 tim=1159463023995544 FETCH #8: c=0, e=665, p=5, cr=4, cu=0, mis=0, r=1, dep=0, og=1, tim=1159463023995732 WAIT #8: nam='SQL*Net message from client' ela= 157 driver id=1650815232 #bytes=1 p 3=0 obj#=53707 tim=1159463023996048 FETCH #8: c=0, e=7, p=0, cr=0, cu=0, mis=0, r=0, dep=0, og=0, tim=1159463023996183 WAIT #8: nam='SQL*Net message to client' ela= 7 driver id=1650815232 #bytes=1 p 3=0 obj#=53707 tim=1159463023996312 WAIT #8: nam='SQL*Net message from client' ela= 298 driver id=1650815232 #bytes=1 p 3=0 obj#=53707 tim=1159463023996669 XCTEND rlbk=0, rd_only=1 STAT #8 id=1 cnt=1 pid=0 pos=1 obj=0 op='SORT AGGREGATE (cr=4 pr=5 pw=0 time=736 us)' STAT #8 id=2 cnt=9 pid=1 pos=1 obj=0 op='COUNT STOPKEY (cr=4 pr=5 pw=0 time=846 us)' STAT #8 id=3 cnt=9 pid=2 pos=1 obj=53707 op='TABLE ACCESS FULL SKEW (cr=4 pr=5 pw=0 time=639 us)' WAIT #0: nam='log file sync' ela= 680 buffer#=4862 p 2=0 p 3=0 obj#=53707 tim=1159463039852003
Questions? Kerry. Osborne@enkitec. com