Tuning Oracle Database Performance via AWR and code

Tuning Oracle Database Performance via AWR and code changes - a case study

Introduction • In this presentation, I will share my example of Oracle DB based system performance tuning. • By applying code changes as well as using some DBA skills, a Oracle based web system got huge performance gain. 1) 10 times more concurrent users allowed (could be more) 2) 500+ times reduction of page response time!

Background • 1. Event: University course choice system – a ‘Black Friday’ event • 2. Concurrency: 3, 000+ students hit system simultaneously. • 3. Technical Stack: mod_plsql forward web request from Apache to Oracle DB. User can call procedure to rend web page via mod_sql (Apache plug-in). • 4. System issues: Web page response time – extremely high ( hours ) CPU usage – low (around 25%) Concurrent sessions – high (up to 2, 800) I/O request – high ( up to 500 requests per second)

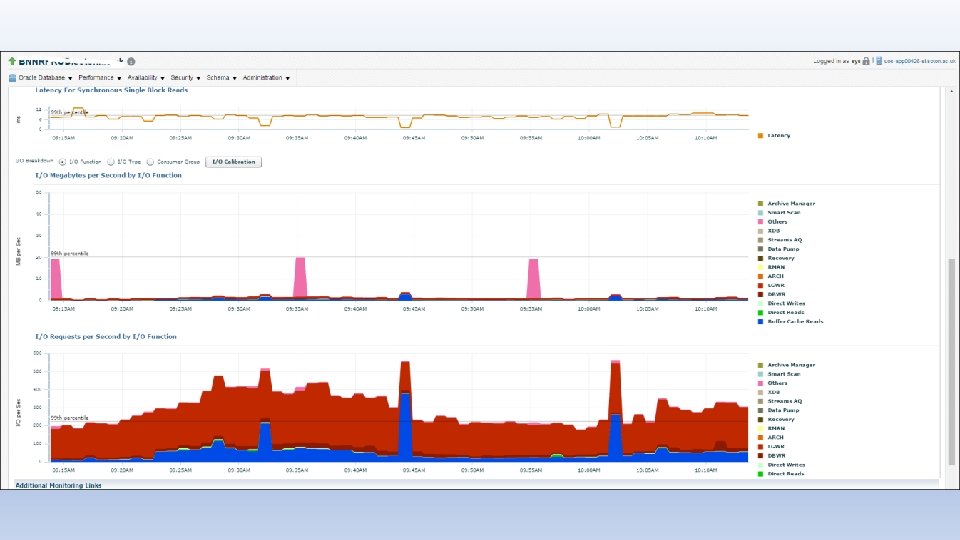
Oracle cloud control manager screen shot

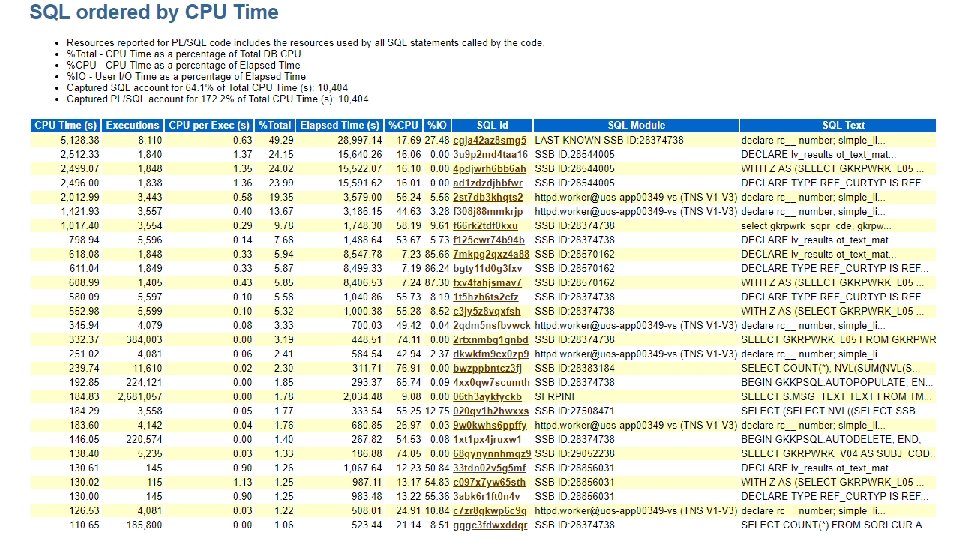
Performance diagnose & tuning methodology • 1. AWR report Top 10 Foreground Events by Total Wait Time ==> Wait Event Histogram ==> Segment Statistics ==> SQL ordered by Elapsed Time SQL ordered by CPU Time SQL ordered by User I/O Wait Time SQL ordered by Gets SQL ordered by Reads

AWR report
 2, 472, 551. 14 4, 648 cgja")
SQL ordered by Elapsed Time Executions (s) 2, 472, 551. 14 4, 648 cgja 42 az 8 smg 5 Elapsed Time %Total per Exec (s) %CPU %IO SQL Id 531. 96 0. 26 0. 00 cgja 42 az 8 smg 5 httpd. worker@uosapp 00446 -vs (TNS V 1 -V 3) 80. 45 SQL Module declare rc__ number; simple_list__ owa_util. vc_arr; complex_list__ owa_util. vc_arr; begin owa. init_cgi_env(: n__, : nm__, : v__); htp. HTBUF_LEN : = 63; null; simple_list__(1) : = 'sys. %'; simple_list__(2) : = 'dbms_%'; simple_list__(3) : = 'utl_%'; simple_list__(4) : = 'owa_%'; simple_list__(5) : = 'owa. %'; simple_list__(6) : = 'htp. %'; simple_list__(7) : = 'htf. %'; simple_list__(8) : = 'wpg_docload. %'; simple_list__(9) : = 'ctxsys. %'; simple_list__(10) : = 'mdsys. %'; if ((owa_match_pattern(p_string => 'bwkkspgr. showpage' /* */, p_simple_pattern => simple_list__ , p_complex_pattern => complex_list__ , p_use_special_chars => false))) then rc__ : = 2; else twbklist. p_main; null; bwkkspgr. showpage(page=>: page); if (wpg_docload. is_file_download) then rc__ : = 1; wpg_docload. get_download_file(: doc_info); null; commit; else rc__ : = 0; null; commit; owa. get_page(: data__, : ndata__); end if; : rc__ : = rc__; end;

1 st - waits: cache: row cache objects • 1. Find suspicious procedure: bwkkspgr. showpage Average execution time: %Total Elapsed Time : 531. 96 seconds 80. 45% • 2. Locate problematic code: 1) Function INSTR & SUBSTR applied on CLOB variable LV_PAGEDEF in below loop, they will be executed 3000+ times per loop. The only purpose of the loop is to rend one html page!!! 2) 99% of showpage procedure execution time spend in the loop CAN’T find any document on this CLOB issue in Google or MOS, decide to make change based on evidence gathered from testing. CLOB is a usual suspect of performance issue!!!

• 3. Solution – replace CLOB with varchar 2 variable when CLOB size is below 32, 767 LV_PAGEDEF CLOB; LV_PAGEDEF_VC VARCHAR 2(32767); --Added to solve performance issue
 Elapsed time for cgja 42 az 8 smg 5")
• 3. Result 1) Elapsed time for cgja 42 az 8 smg 5 changed from 531. 96 seconds to 0. 95 seconds 2) Improvement ratio: 55 , 900 % !!! 3) Latch: row cache objects waits: changed from 12 M to 285 , 99. 9% row cache object wait events gone!!!

2 nd – Waits: library cache • 1. AWR report – No PL/SQL coding issue can be found.

• 2. DB looks good, then how about Apache? Error messages found in Apache mod_plsql logging files …… <1729057634 ms>Str. Arr. Pos. Bind pos 23 Charset Id : 46 <1729184884 ms>Execute: ORA-06550: line 35, column 3: PLS-00306: wrong number or types of arguments in call to 'SHOWPAGE' ORA-06550: line 35, column 3: PL/SQL: Statement ignored <1729184884 ms>(wppr. c, 638) Execute: declare …… Execution time: 184884 -57634=127. 250 s -- 127 seconds execution time spend per call with PLS-00306 thrown at 1729057634
 MOD_PLSQL overhead issue: ……This works for most cases but")
• 3. Error 1) MOD_PLSQL overhead issue: ……This works for most cases but fails if there is an attempt to pass a single value for an array parameter or pass multiple values for a scalar. In such cases, the first attempt to execute the PL/SQL procedure fails. mod_plsql issues a Describe call …… 2) If you define an array type parameter for procedure, but only send one value to it, Oracle mod_plsql will trigger a Describe (name resolve call). 3) What Oracle don’t say is ‘ this process (fails and Describe call) will spend 127 seconds per call !!!

• 4. Dirty hard-coding can improve performance – a lot !!! Hard-coded SHOWPAGE 3 designed for one web page UOS_PMDM_OOC_5 rending only, 127 s reduction per call SUBTYPE ST_TEXT IS VARCHAR 2(4000); PROCEDURE SHOWPAGE 3( PAGE VARCHAR 2 , PFROMPAGE VARCHAR 2 , PSUBMIT VARCHAR 2 , PFORM VARCHAR 2 , PQRYCHKSUM VARCHAR 2 , PDATAITEMS T_QNAMES , C 01 ST_TEXT , C 02 ST_TEXT , C 03 ST_TEXT ) Neat and graceful baseline code with extremely poor performance TYPE T_VARCHARS IS TABLE OF ST_TEXT INDEX BY BINARY_INTEGER; PROCEDURE SHOWPAGE( PAGE VARCHAR 2 …… , C 01 T_VARCHARS , C 02 T_VARCHARS …… , C 38 T_VARCHARS , C 39 T_VARCHARS , C 40 T_VARCHARS , ml_text_id T_VARCHARS , ml_text T_VARCHARS )

3 rd : High water mark – DBA time!!! • 1. Classical dilemma – read or write ? A big table GKRPWRK heavily used in procedure for temporarily store web page parameter for each call – insert/update/select occurred simultaneously in the same table!! 2 million historical records. For each event, 300, 000 new rows will be generated. 2. First reaction – remove historical records, then query & update, insert. However, I got below high watermark issue:
 Waits Wait Avg(ms) % DB time Wait Class enq:")
Event Total Wait Time (sec) Waits Wait Avg(ms) % DB time Wait Class enq: HW - contention 1, 637 8012. 9 4895 latch: cache buffers chains 4, 304 2773. 5 644 19. 3 Concurrency resmgr: cpu quantum 7, 990 2323. 1 291 16. 2 Scheduler 567 6, 119 384. 3 63 log file sync 350 307. 9 880 latch: In memory undo latch 160 304. 4 1903 2. 1 Concurrency library cache: mutex X 449 26. 3 59 . 2 Concurrency latch free 111 17. 7 160 . 1 Other 61 11 180 . 1 User I/O DB CPU buffer busy waits direct path sync 55. 7 Configuration 3. 9 2. 7 Concurrency 2. 1 Commit

• 3. Solution: Change freelist for LOB segment - Rebuilding LOB freepools (Doc ID 365156. 1) Move table GKRPWRK to an independent manually managed table space APP_MAN, set freelist value of segment to 96 (maximum allowed). Pro: high watermark wait event gone and performance improved Cons: Table space will not shrink automatically, keep increasing …… It’s DBA time now: DBA will manually move table GKRPWRK to ASM table space after course option event end (next weekend).
: hours (from")
Final Result • 1. Before tuning Page response time (all 5 pages): hours (from numerous students’ complain collected by service now team) Concurrent users in queue: 20 -40 (using script to limit user access) CPU usage: 25% • 2. After tuning – can support much more users , but…… No abnormal wait events, none !!! Page response time (each page): 1 -2 seconds (Google Analytics) Concurrent users in queue: 200 (using online queue to manage users) CPU usage: below 10%

- Slides: 21