Monitoring and Tuning Oracle for zOS and Oracle


- Slides: 60

Monitoring and Tuning Oracle for z/OS and Oracle for z/Linux

Thomas Niewel Oracle Deutschland Gmb. H Thomas. Niewel@Oracle. com

Agenda • • • Tuning Why ? Reasons for bad Response Time Statspack Diagnosing reasons for bad response Times SQL Tuning – TKPROF – Explain Plan • 3 WLM

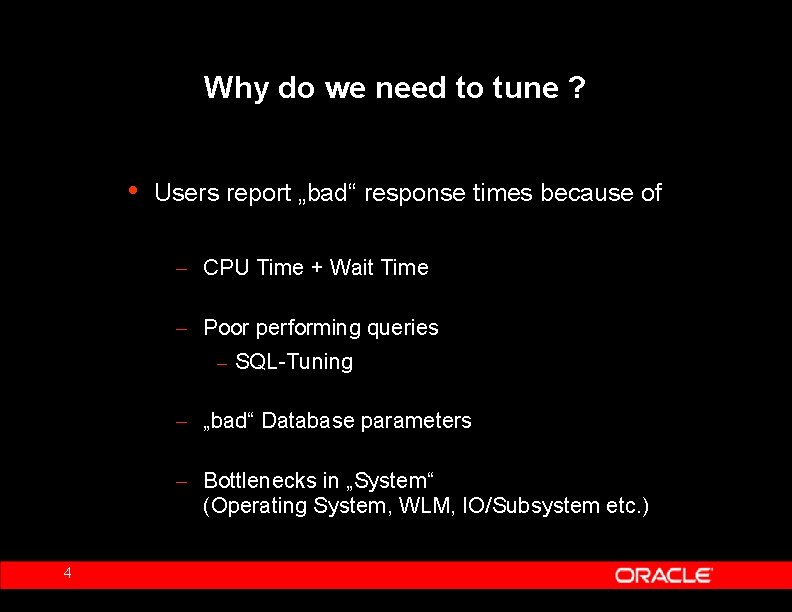
Why do we need to tune ? • Users report „bad“ response times because of – CPU Time + Wait Time – Poor performing queries – SQL-Tuning – „bad“ Database parameters – Bottlenecks in „System“ (Operating System, WLM, IO/Subsystem etc. ) 4

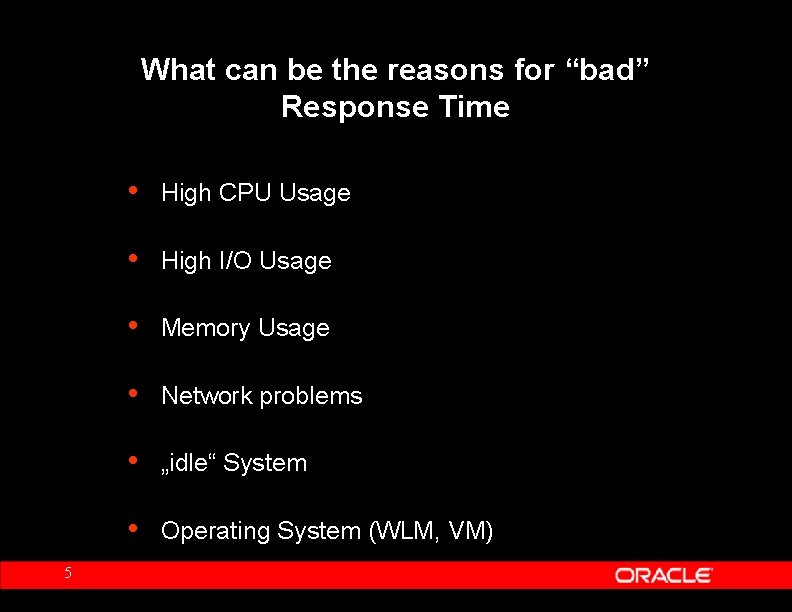
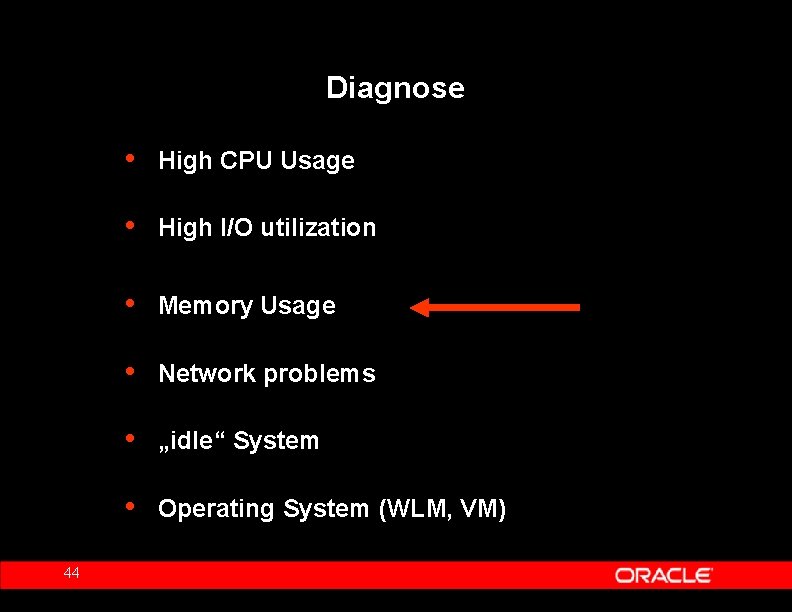
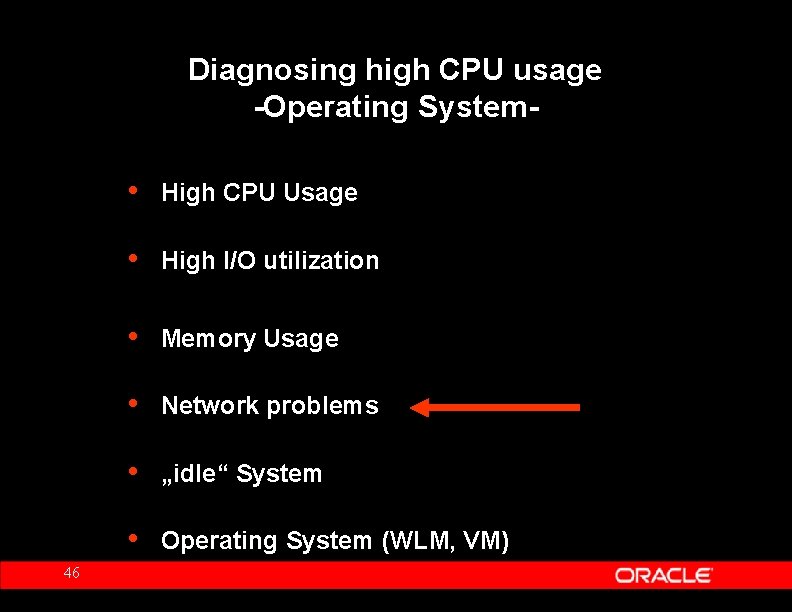
What can be the reasons for “bad” Response Time 5 • High CPU Usage • High I/O Usage • Memory Usage • Network problems • „idle“ System • Operating System (WLM, VM)

Diagnose from the Oracle point of view Statspack A short overview 6

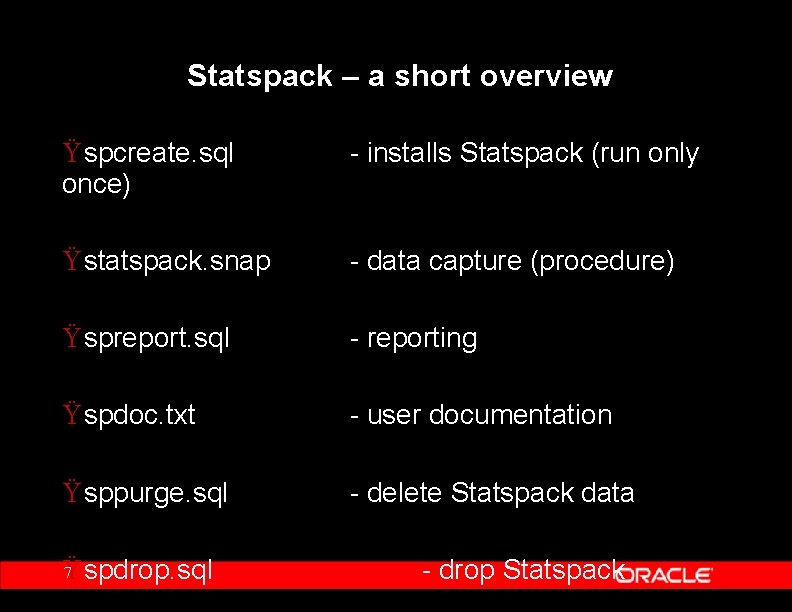
Statspack – a short overview Ÿ spcreate. sql once) - installs Statspack (run only Ÿ statspack. snap - data capture (procedure) Ÿ spreport. sql - reporting Ÿ spdoc. txt - user documentation Ÿ sppurge. sql - delete Statspack data 7 spdrop. sql Ÿ - drop Statspack

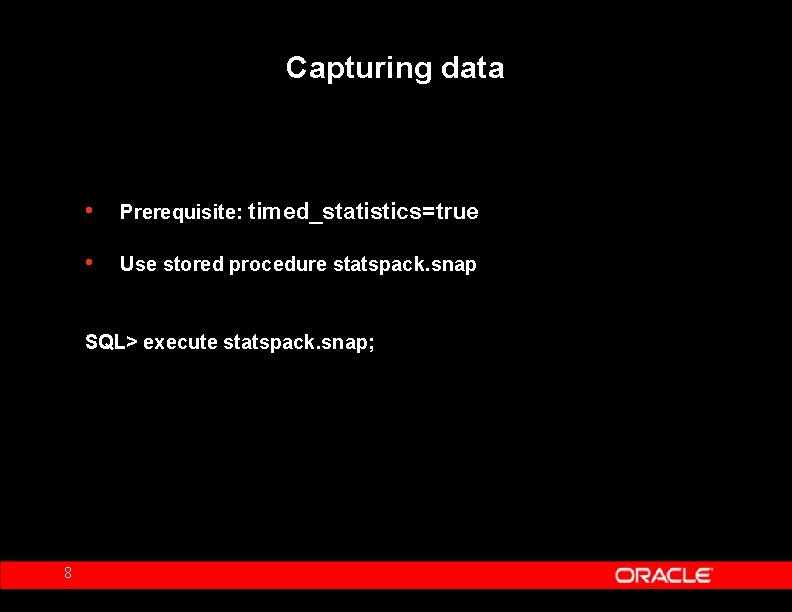
Capturing data • Prerequisite: timed_statistics=true • Use stored procedure statspack. snap SQL> execute statspack. snap; 8

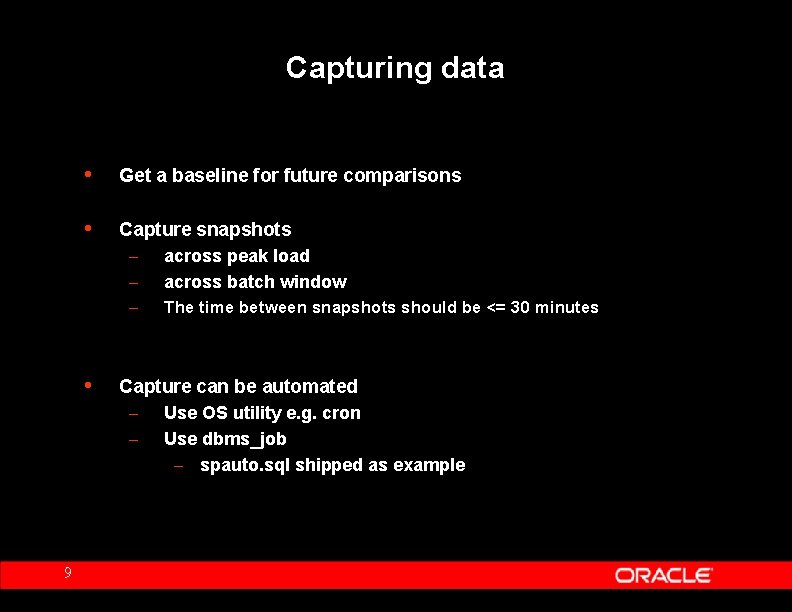
Capturing data • Get a baseline for future comparisons • Capture snapshots – across peak load – across batch window – • The time between snapshots should be <= 30 minutes Capture can be automated – Use OS utility e. g. cron – Use dbms_job – 9 spauto. sql shipped as example

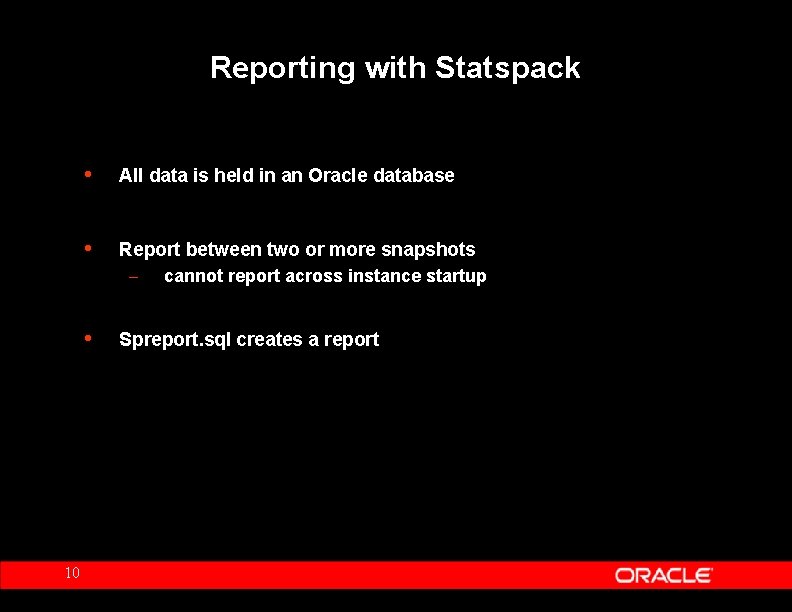
Reporting with Statspack 10 • All data is held in an Oracle database • Report between two or more snapshots – cannot report across instance startup • Spreport. sql creates a report

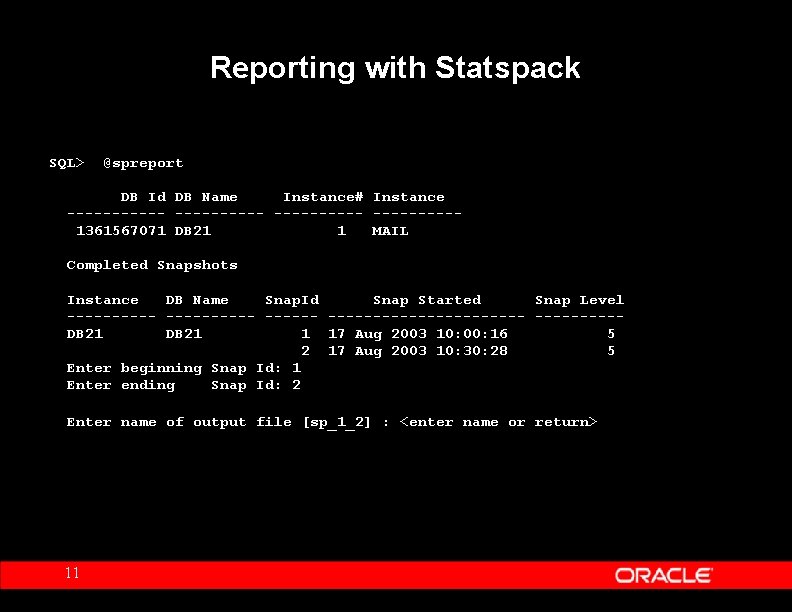
Reporting with Statspack SQL> @spreport DB Id DB Name Instance# Instance -----------1361567071 DB 21 1 MAIL Completed Snapshots Instance DB Name Snap. Id Snap Started Snap Level ---------------DB 21 1 17 Aug 2003 10: 00: 16 5 2 17 Aug 2003 10: 30: 28 5 Enter beginning Snap Id: 1 Enter ending Snap Id: 2 Enter name of output file [sp_1_2] : <enter name or return> 11

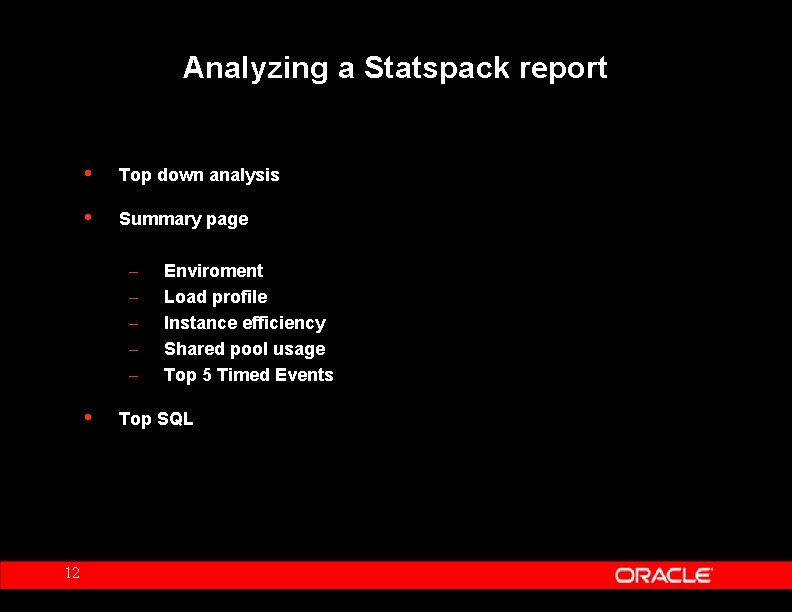
Analyzing a Statspack report • Top down analysis • Summary page – – – • 12 Enviroment Load profile Instance efficiency Shared pool usage Top 5 Timed Events Top SQL

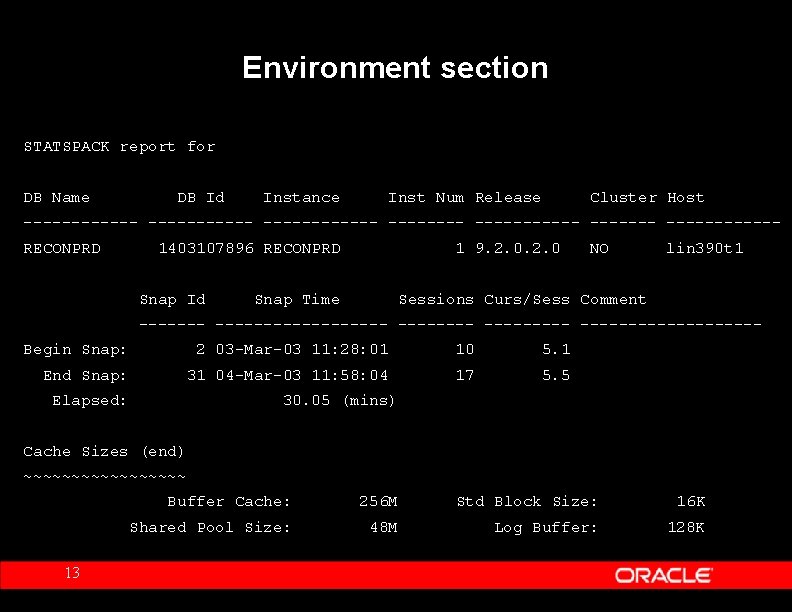
Environment section STATSPACK report for DB Name DB Id Instance Inst Num Release Cluster Host -------------------RECONPRD 1403107896 RECONPRD Snap Id 1 9. 2. 0 Snap Time NO lin 390 t 1 Sessions Curs/Sess Comment ------------- ---------Begin Snap: 2 03 -Mar-03 11: 28: 01 10 5. 1 End Snap: 31 04 -Mar-03 11: 58: 04 17 5. 5 Elapsed: 30. 05 (mins) Cache Sizes (end) ~~~~~~~~~ 13 Buffer Cache: 256 M Std Block Size: 16 K Shared Pool Size: 48 M Log Buffer: 128 K

Load profile 14 • Contains a number of common ratios • Allows characterisation of the application • Can point to problems – high hard parse rate – high IO rate – high login rate

Load profile 15 • Useful if you have a comparable baseline • What has changed? – txn/sec change implies changed workload – redo size/txn implies changed transaction mix – physical reads/txn implies changed SQL or plan

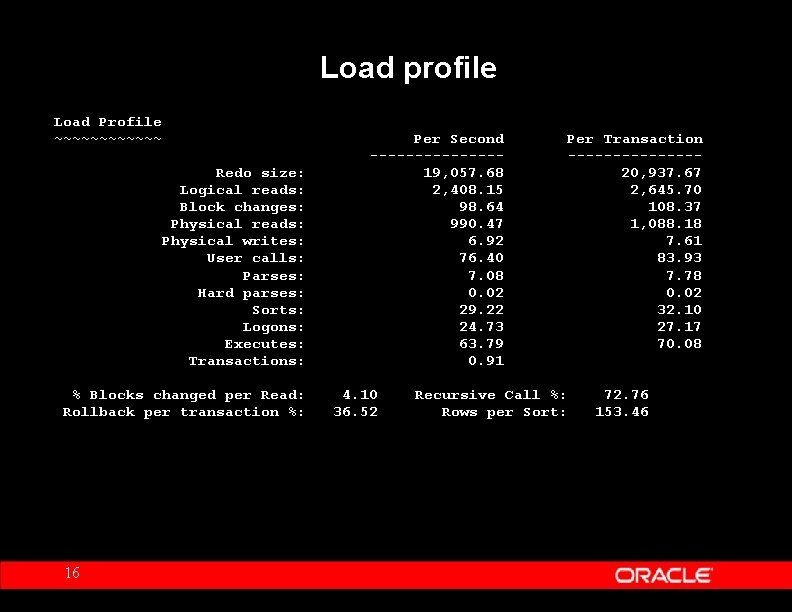
Load profile Load Profile ~~~~~~ Redo size: Logical reads: Block changes: Physical reads: Physical writes: User calls: Parses: Hard parses: Sorts: Logons: Executes: Transactions: % Blocks changed per Read: Rollback per transaction %: 16 Per Second -------19, 057. 68 2, 408. 15 98. 64 990. 47 6. 92 76. 40 7. 08 0. 02 29. 22 24. 73 63. 79 0. 91 4. 10 36. 52 Per Transaction -------20, 937. 67 2, 645. 70 108. 37 1, 088. 18 7. 61 83. 93 7. 78 0. 02 32. 10 27. 17 70. 08 Recursive Call %: Rows per Sort: 72. 76 153. 46

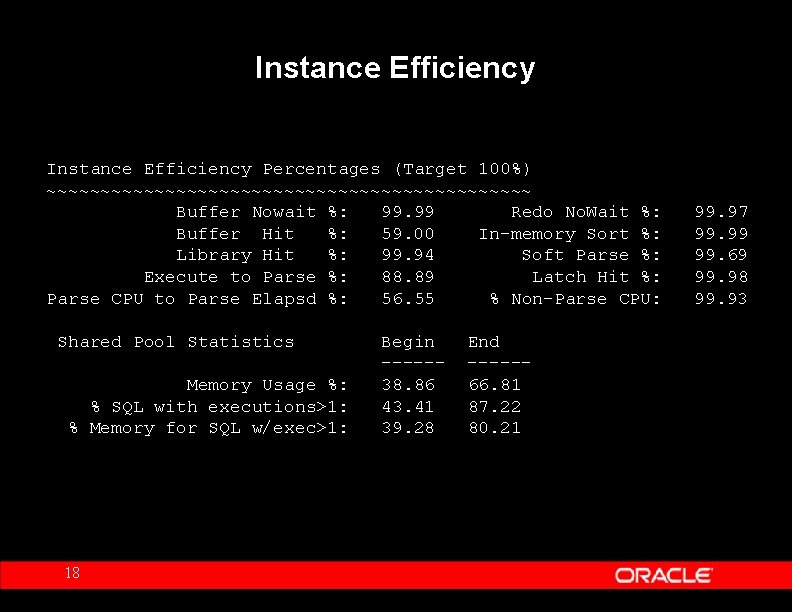
Instance Efficiency 17 • Gives an overview of how the instance is performing • Can also be used with a comparable baseline • Shared pool Statistics allow quick identification of cursor sharing problems

Instance Efficiency Percentages (Target 100%) ~~~~~~~~~~~~~~~~~~~~~~~ Buffer Nowait %: 99. 99 Redo No. Wait %: Buffer Hit %: 59. 00 In-memory Sort %: Library Hit %: 99. 94 Soft Parse %: Execute to Parse %: 88. 89 Latch Hit %: Parse CPU to Parse Elapsd %: 56. 55 % Non-Parse CPU: Shared Pool Statistics Memory Usage %: % SQL with executions>1: % Memory for SQL w/exec>1: 18 Begin -----38. 86 43. 41 39. 28 End -----66. 81 87. 22 80. 21 99. 97 99. 99 99. 69 99. 98 99. 93

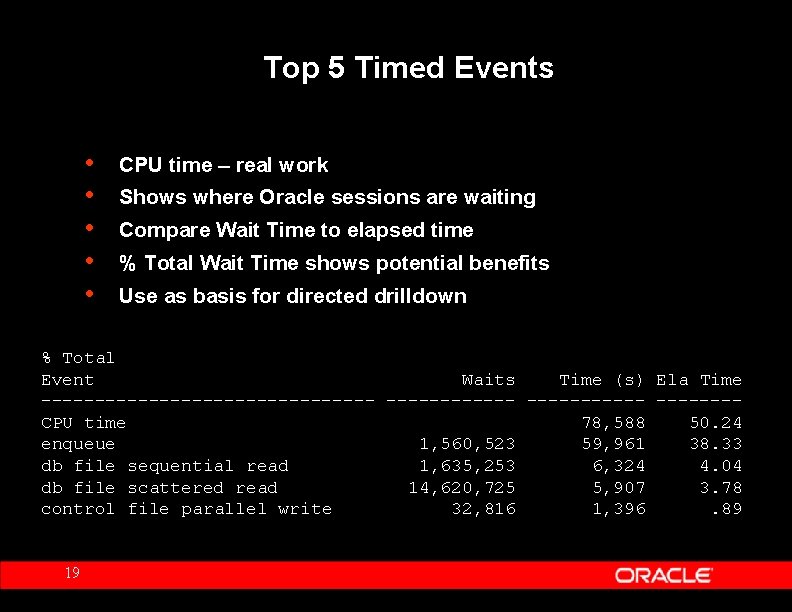
Top 5 Timed Events • • • CPU time – real work Shows where Oracle sessions are waiting Compare Wait Time to elapsed time % Total Wait Time shows potential benefits Use as basis for directed drilldown % Total Event Waits Time (s) Ela Time ---------------- -------CPU time 78, 588 50. 24 enqueue 1, 560, 523 59, 961 38. 33 db file sequential read 1, 635, 253 6, 324 4. 04 db file scattered read 14, 620, 725 5, 907 3. 78 control file parallel write 32, 816 1, 396. 89 19

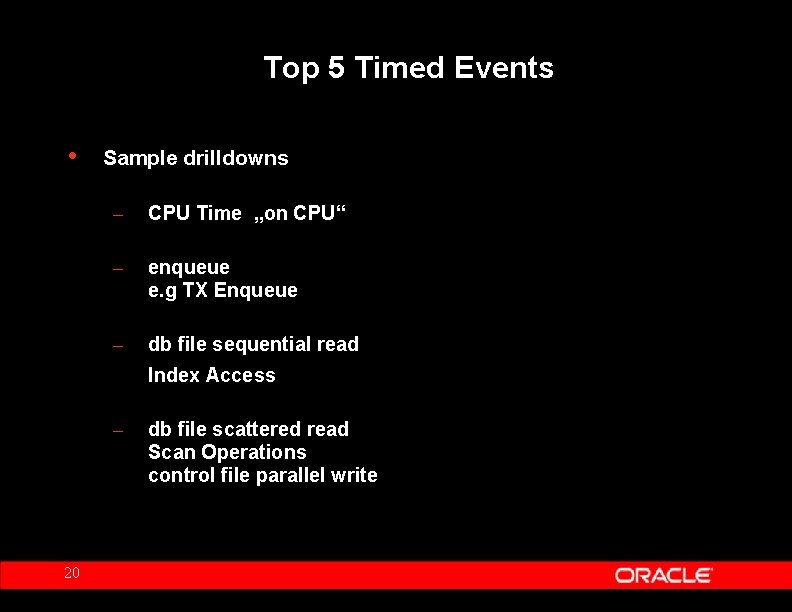
Top 5 Timed Events • Sample drilldowns – CPU Time „on CPU“ – enqueue e. g TX Enqueue – db file sequential read Index Access – 20 db file scattered read Scan Operations control file parallel write

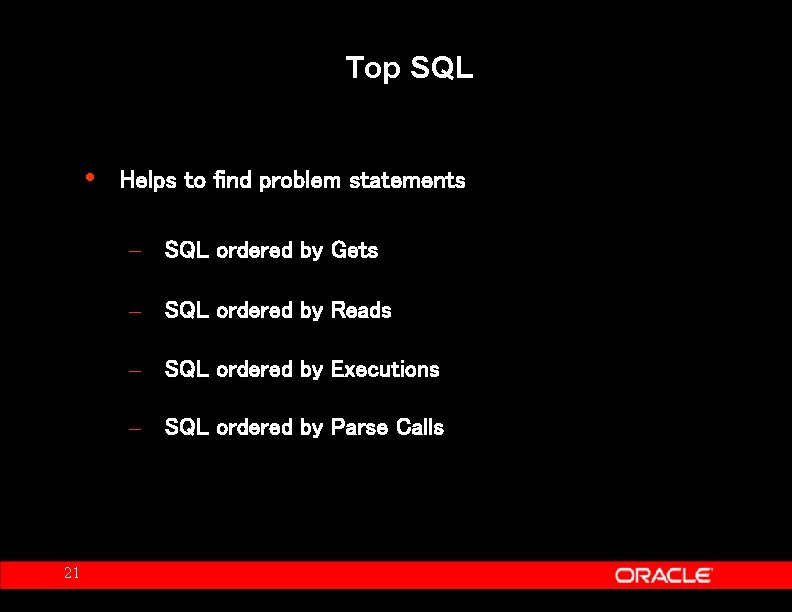
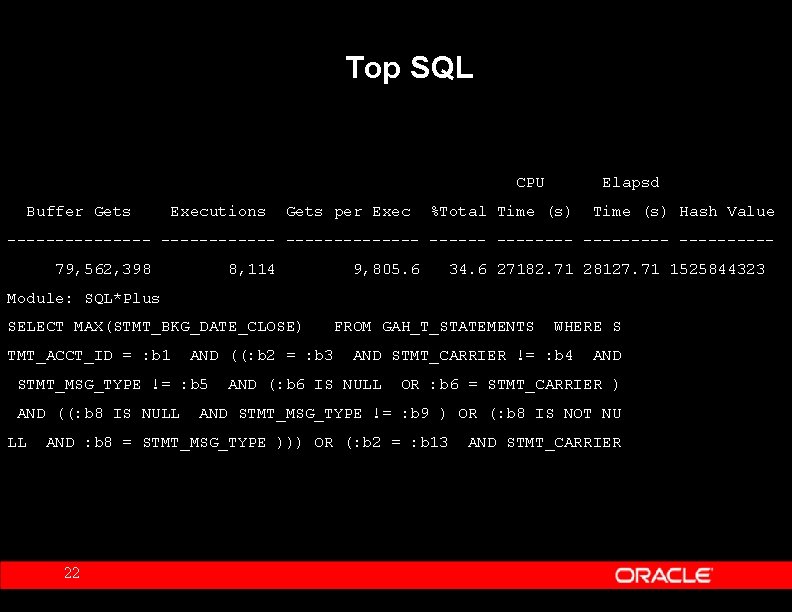
Top SQL • Helps to find problem statements – SQL ordered by Gets – SQL ordered by Reads – SQL ordered by Executions – SQL ordered by Parse Calls 21

Top SQL CPU Buffer Gets Executions Gets per Exec Elapsd %Total Time (s) Hash Value ---------------- ---------79, 562, 398 8, 114 9, 805. 6 34. 6 27182. 71 28127. 71 1525844323 Module: SQL*Plus SELECT MAX(STMT_BKG_DATE_CLOSE) TMT_ACCT_ID = : b 1 AND ((: b 2 = : b 3 STMT_MSG_TYPE != : b 5 AND ((: b 8 IS NULL LL FROM GAH_T_STATEMENTS AND STMT_CARRIER != : b 4 AND (: b 6 IS NULL AND OR : b 6 = STMT_CARRIER ) AND STMT_MSG_TYPE != : b 9 ) OR (: b 8 IS NOT NU AND : b 8 = STMT_MSG_TYPE ))) OR (: b 2 = : b 13 22 WHERE S AND STMT_CARRIER

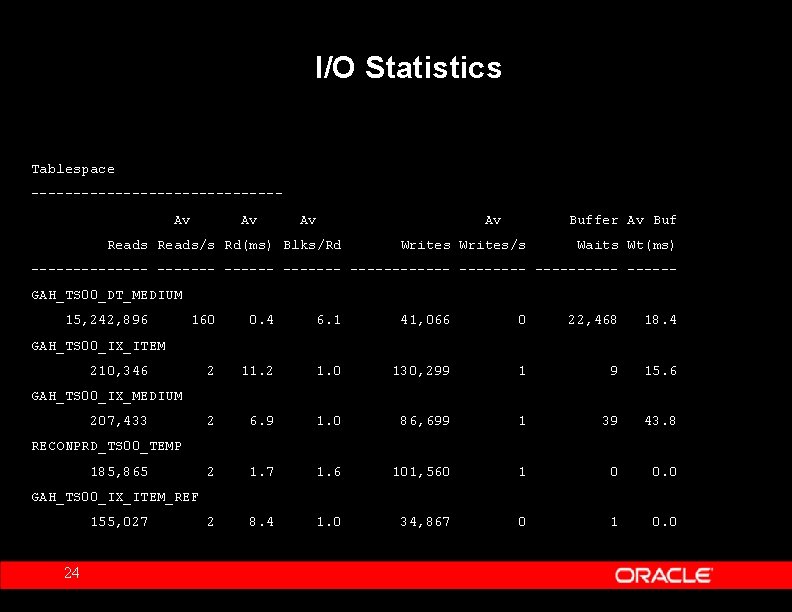
I/O Statistics • Help to find I/O Problems – Tablespace IO Stats – File IO Stats 23

I/O Statistics Tablespace ---------------Av Av Av Reads/s Rd(ms) Blks/Rd Av Buffer Av Buf Writes/s Waits Wt(ms) ------- ------------ -----GAH_TS 00_DT_MEDIUM 15, 242, 896 160 0. 4 6. 1 41, 066 0 22, 468 18. 4 2 11. 2 1. 0 130, 299 1 9 15. 6 2 6. 9 1. 0 86, 699 1 39 43. 8 2 1. 7 1. 6 101, 560 1 0 0. 0 2 8. 4 1. 0 34, 867 0 1 0. 0 GAH_TS 00_IX_ITEM 210, 346 GAH_TS 00_IX_MEDIUM 207, 433 RECONPRD_TS 00_TEMP 185, 865 GAH_TS 00_IX_ITEM_REF 155, 027 24

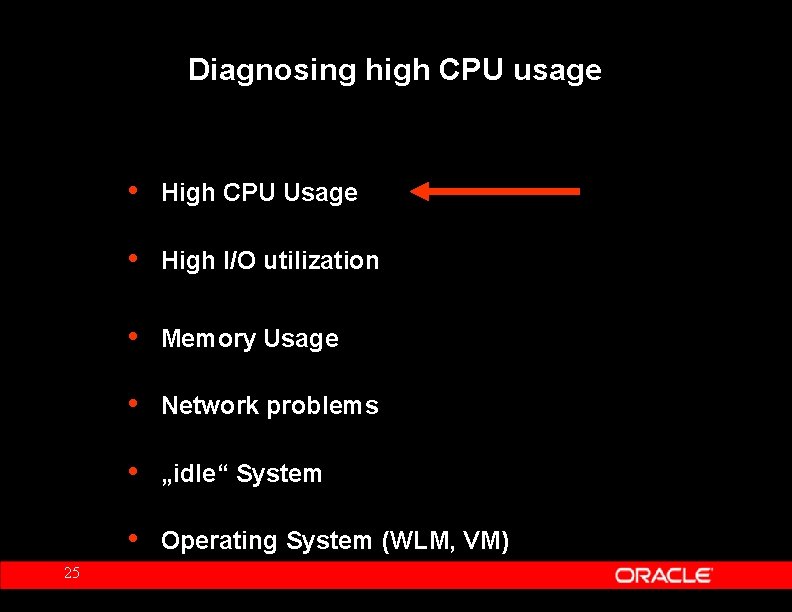
Diagnosing high CPU usage 25 • High CPU Usage • High I/O utilization • Memory Usage • Network problems • „idle“ System • Operating System (WLM, VM)

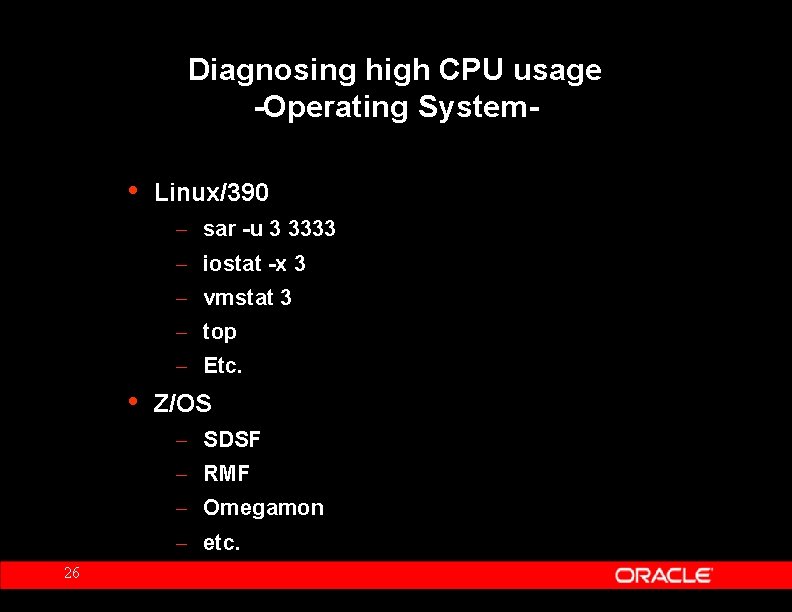
Diagnosing high CPU usage -Operating System- • Linux/390 – sar -u 3 3333 – iostat -x 3 – vmstat 3 – top – Etc. • Z/OS – SDSF – RMF – Omegamon – etc. 26

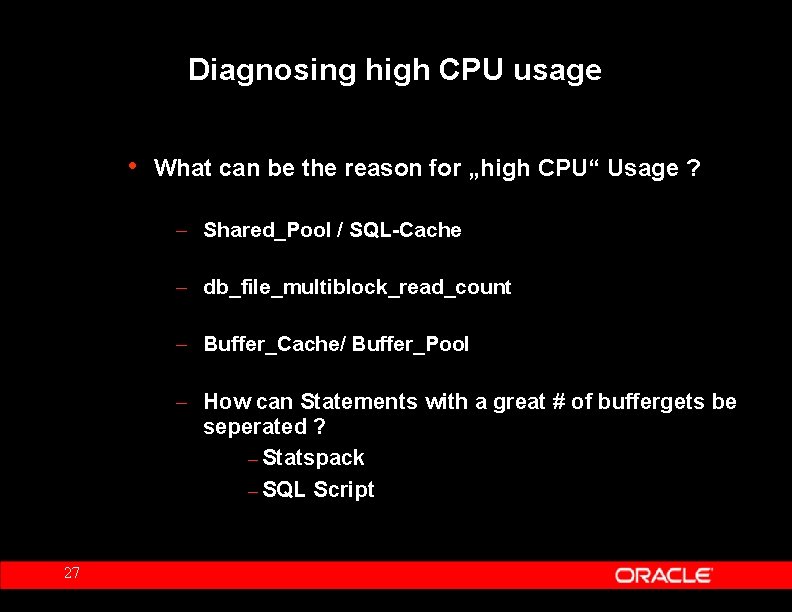
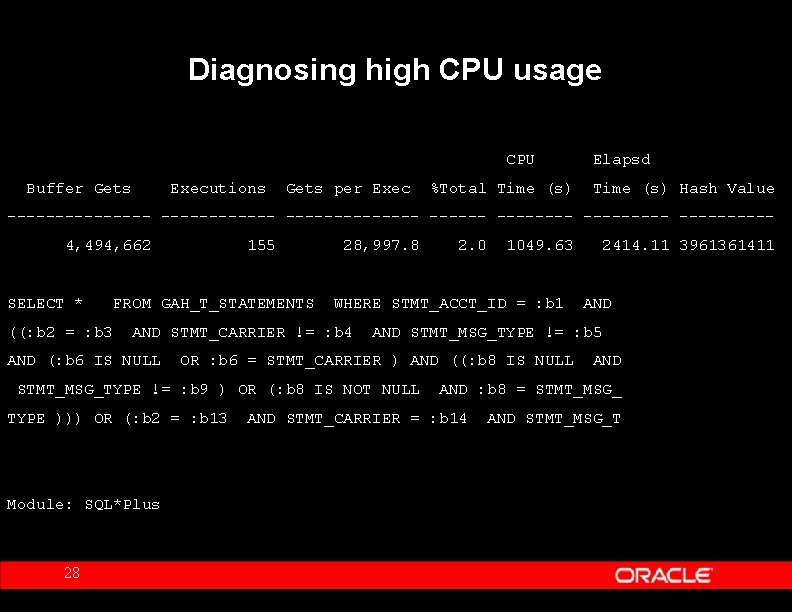
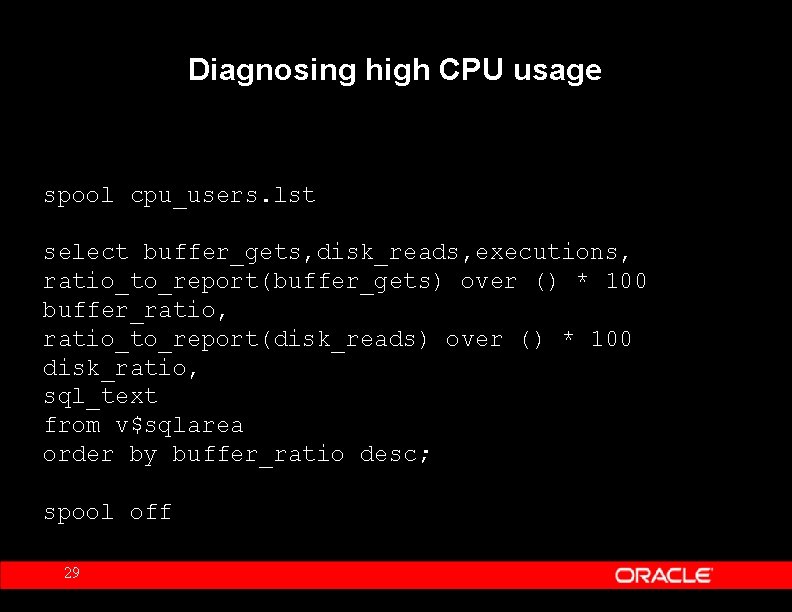
Diagnosing high CPU usage • What can be the reason for „high CPU“ Usage ? – Shared_Pool / SQL-Cache – db_file_multiblock_read_count – Buffer_Cache/ Buffer_Pool – How can Statements with a great # of buffergets be seperated ? – Statspack – SQL Script 27

Diagnosing high CPU usage CPU Buffer Gets Executions Gets per Exec %Total Time (s) Elapsd Time (s) Hash Value ---------------- ---------4, 494, 662 SELECT * 155 ((: b 2 = : b 3 FROM GAH_T_STATEMENTS 28, 997. 8 OR : b 6 = STMT_CARRIER ) AND ((: b 8 IS NULL TYPE ))) OR (: b 2 = : b 13 28 2414. 11 3961361411 AND STMT_MSG_TYPE != : b 5 STMT_MSG_TYPE != : b 9 ) OR (: b 8 IS NOT NULL Module: SQL*Plus 1049. 63 WHERE STMT_ACCT_ID = : b 1 AND STMT_CARRIER != : b 4 AND (: b 6 IS NULL 2. 0 AND : b 8 = STMT_MSG_ AND STMT_CARRIER = : b 14 AND STMT_MSG_T

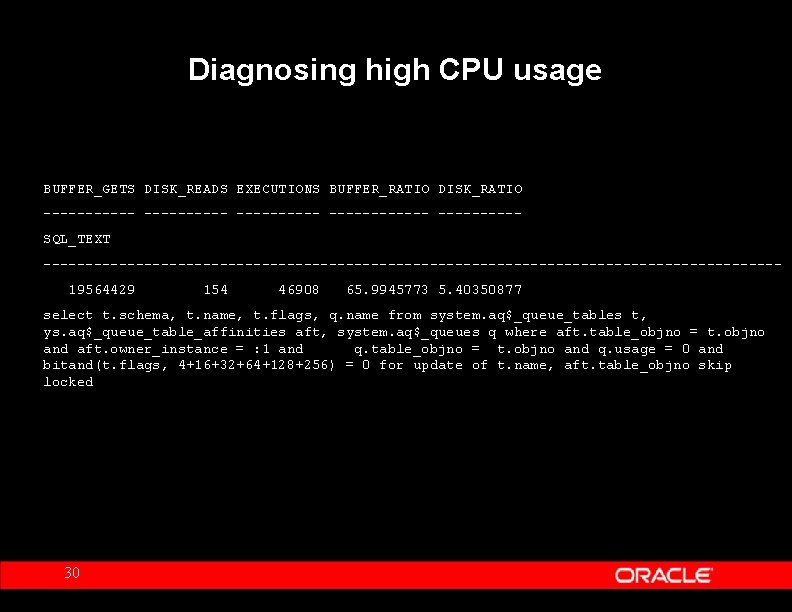
Diagnosing high CPU usage spool cpu_users. lst select buffer_gets, disk_reads, executions, ratio_to_report(buffer_gets) over () * 100 buffer_ratio, ratio_to_report(disk_reads) over () * 100 disk_ratio, sql_text from v$sqlarea order by buffer_ratio desc; spool off 29

Diagnosing high CPU usage BUFFER_GETS DISK_READS EXECUTIONS BUFFER_RATIO DISK_RATIO ------------ -----SQL_TEXT --------------------------------------------19564429 154 46908 65. 9945773 5. 40350877 select t. schema, t. name, t. flags, q. name from system. aq$_queue_tables t, ys. aq$_queue_table_affinities aft, system. aq$_queues q where aft. table_objno = t. objno and aft. owner_instance = : 1 and q. table_objno = t. objno and q. usage = 0 and bitand(t. flags, 4+16+32+64+128+256) = 0 for update of t. name, aft. table_objno skip locked 30

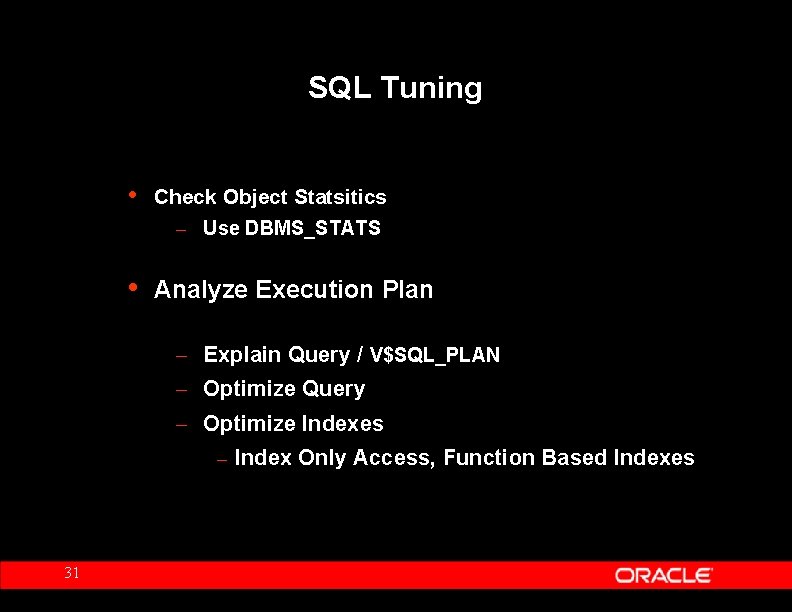
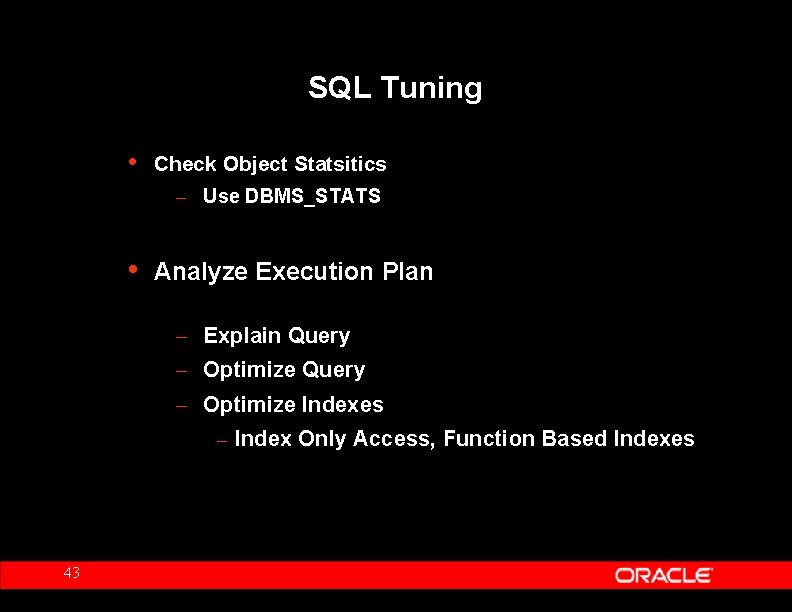
SQL Tuning • Check Object Statsitics – Use DBMS_STATS • Analyze Execution Plan – Explain Query / V$SQL_PLAN – Optimize Query – Optimize Indexes – Index Only Access, Function Based Indexes 31

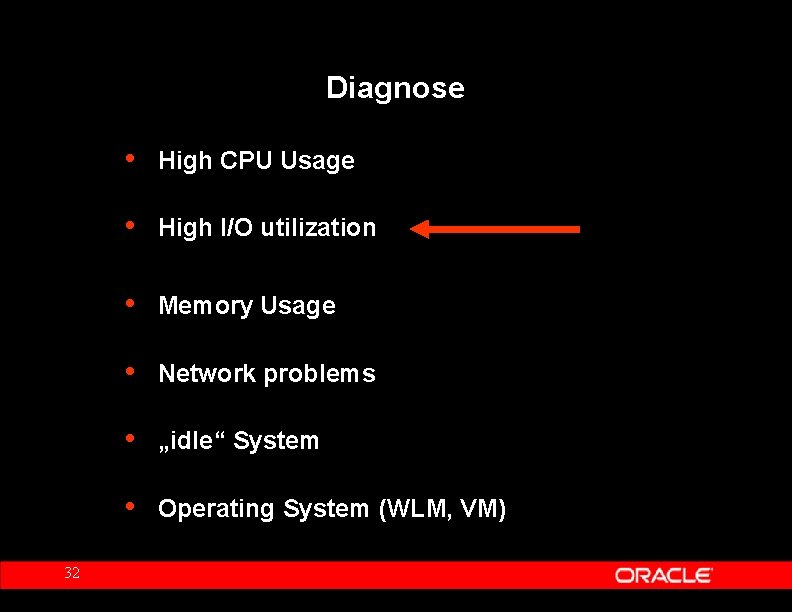
Diagnose 32 • High CPU Usage • High I/O utilization • Memory Usage • Network problems • „idle“ System • Operating System (WLM, VM)

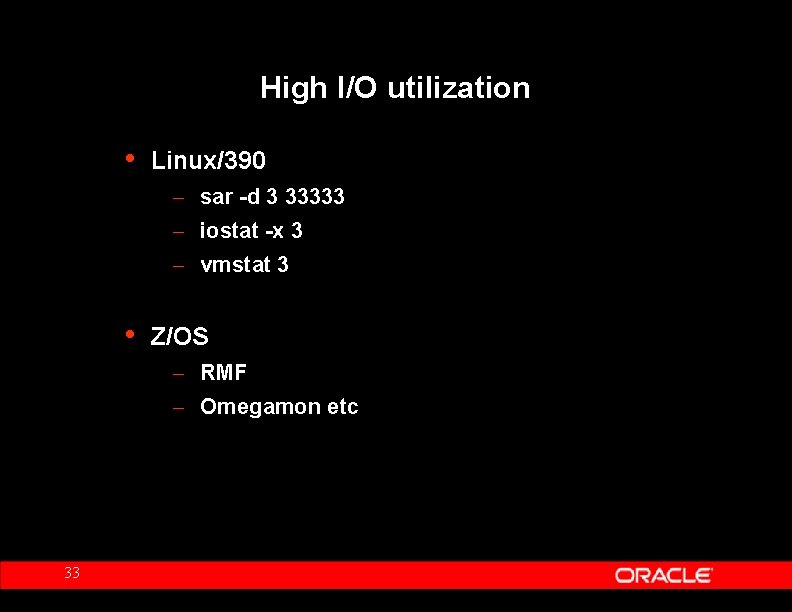
High I/O utilization • Linux/390 – sar -d 3 33333 – iostat -x 3 – vmstat 3 • Z/OS – RMF – Omegamon etc 33

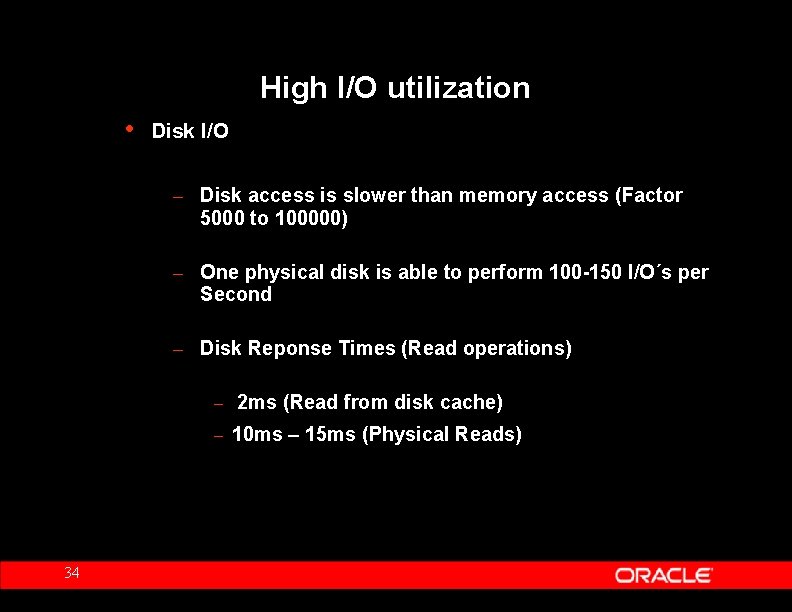
High I/O utilization • Disk I/O – Disk access is slower than memory access (Factor 5000 to 100000) – One physical disk is able to perform 100 -150 I/O´s per Second – Disk Reponse Times (Read operations) – 2 ms (Read from disk cache) – 10 ms – 15 ms (Physical Reads) 34

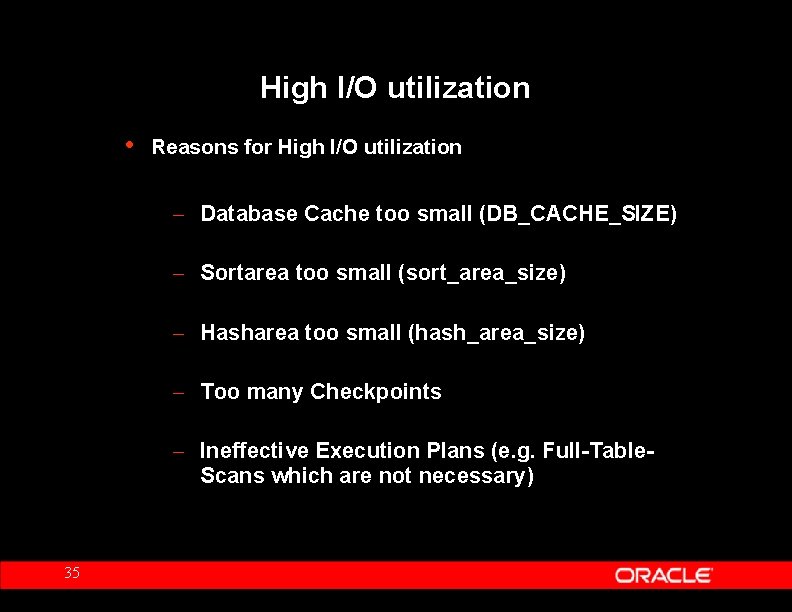
High I/O utilization • Reasons for High I/O utilization – Database Cache too small (DB_CACHE_SIZE) – Sortarea too small (sort_area_size) – Hasharea too small (hash_area_size) – Too many Checkpoints – Ineffective Execution Plans (e. g. Full-Table. Scans which are not necessary) 35

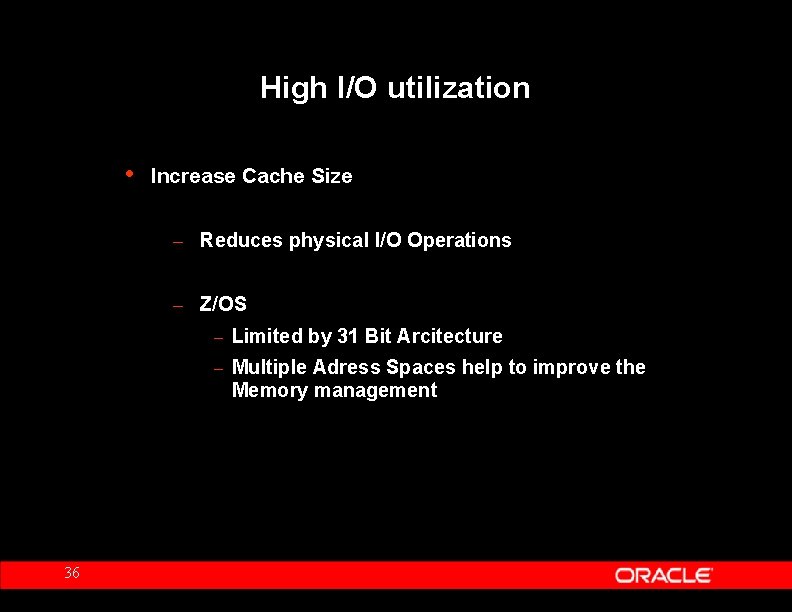
High I/O utilization • Increase Cache Size – Reduces physical I/O Operations – Z/OS – Limited by 31 Bit Arcitecture – Multiple Adress Spaces help to improve the Memory management 36

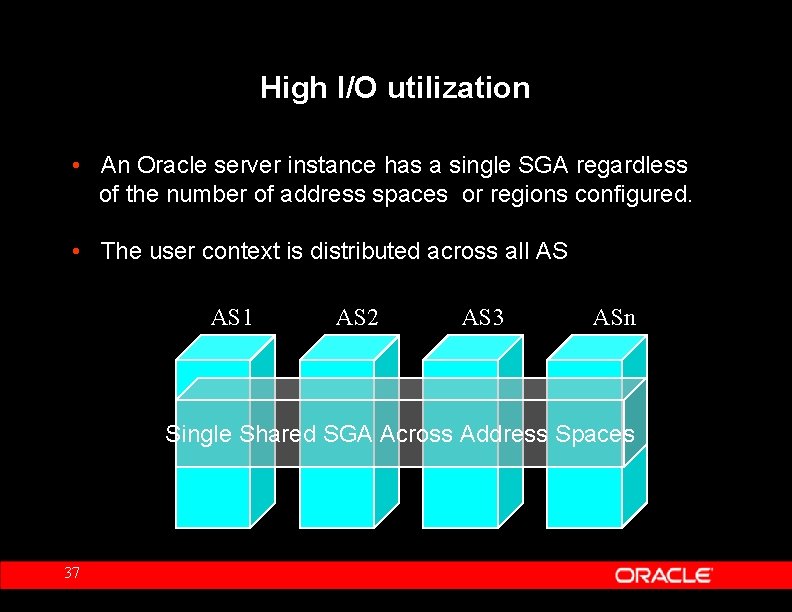
High I/O utilization • An Oracle server instance has a single SGA regardless of the number of address spaces or regions configured. • The user context is distributed across all AS AS 1 AS 2 AS 3 ASn Single Shared SGA Across Address Spaces 37

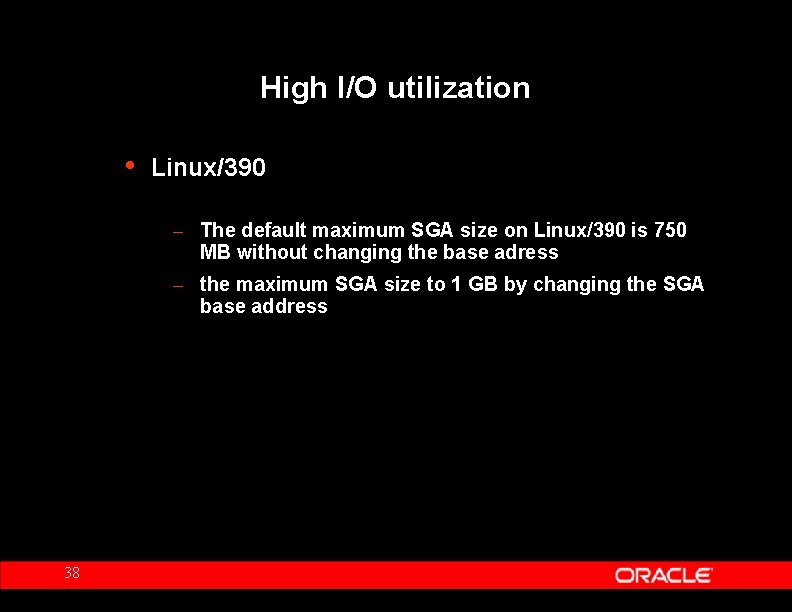
High I/O utilization • Linux/390 – The default maximum SGA size on Linux/390 is 750 MB without changing the base adress – the maximum SGA size to 1 GB by changing the SGA base address 38

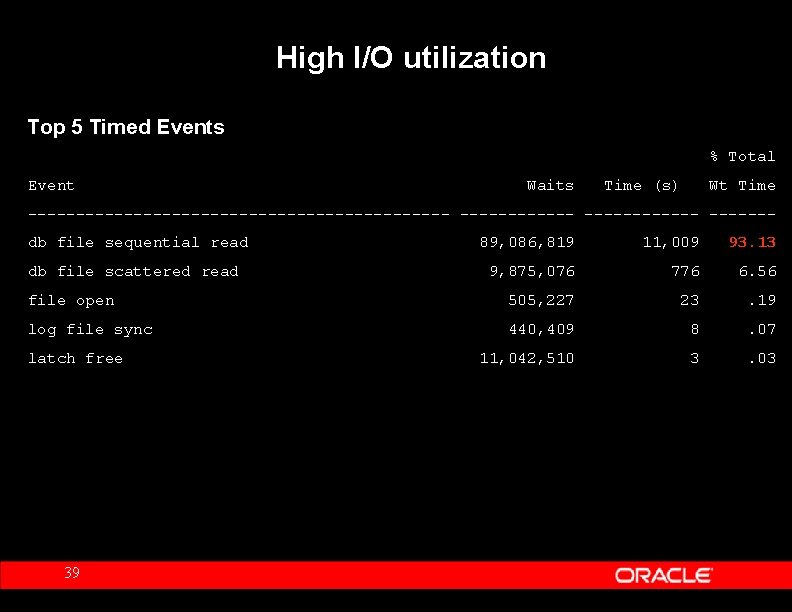
High I/O utilization Top 5 Timed Events % Total Event Waits Time (s) Wt Time ---------------------- ------db file sequential read 89, 086, 819 11, 009 93. 13 db file scattered read 9, 875, 076 776 6. 56 file open 505, 227 23 . 19 log file sync 440, 409 8 . 07 11, 042, 510 3 . 03 latch free 39

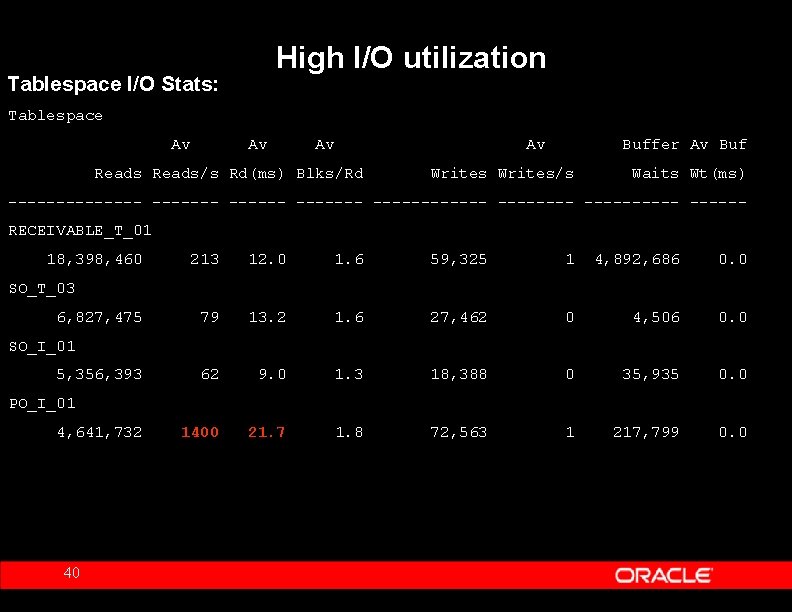
High I/O utilization Tablespace I/O Stats: Tablespace Av Av Reads/s Rd(ms) Blks/Rd Buffer Av Buf Writes/s Waits Wt(ms) ------- ------------ -----RECEIVABLE_T_01 18, 398, 460 213 12. 0 1. 6 59, 325 1 4, 892, 686 0. 0 79 13. 2 1. 6 27, 462 0 4, 506 0. 0 62 9. 0 1. 3 18, 388 0 35, 935 0. 0 1400 21. 7 1. 8 72, 563 1 217, 799 0. 0 SO_T_03 6, 827, 475 SO_I_01 5, 356, 393 PO_I_01 4, 641, 732 40

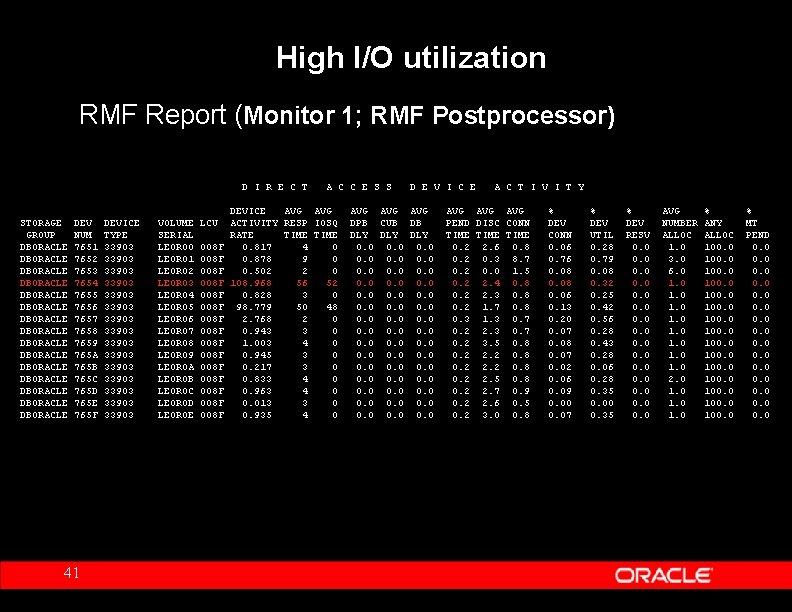
High I/O utilization RMF Report (Monitor 1; RMF Postprocessor) D I R E C T STORAGE GROUP DBORACLE DBORACLE DBORACLE DBORACLE DEV NUM 7651 7652 7653 7654 7655 7656 7657 7658 7659 765 A 765 B 765 C 765 D 765 E 765 F 41 DEVICE TYPE 33903 33903 33903 33903 VOLUME SERIAL LEOR 00 LEOR 01 LEOR 02 LEOR 03 LEOR 04 LEOR 05 LEOR 06 LEOR 07 LEOR 08 LEOR 09 LEOR 0 A LEOR 0 B LEOR 0 C LEOR 0 D LEOR 0 E LCU 008 F 008 F 008 F 008 F A C C E S S DEVICE AVG ACTIVITY RESP IOSQ RATE TIME 0. 817 4 0 0. 878 9 0 0. 502 2 0 108. 968 56 52 0. 828 3 0 98. 779 50 48 2. 768 2 0 0. 943 3 0 1. 003 4 0 0. 945 3 0 0. 217 3 0 0. 833 4 0 0. 963 4 0 0. 013 3 0 0. 935 4 0 D E V I C E AVG AVG DPB CUB DB DLY DLY 0. 0 0. 0 0. 0 0. 0 A C T I V I T Y AVG AVG PEND DISC CONN TIME 0. 2 2. 6 0. 8 0. 2 0. 3 8. 7 0. 2 0. 0 1. 5 0. 2 2. 4 0. 8 0. 2 2. 3 0. 8 0. 2 1. 7 0. 8 0. 3 1. 3 0. 7 0. 2 2. 3 0. 7 0. 2 3. 5 0. 8 0. 2 2. 2 0. 8 0. 2 2. 5 0. 8 0. 2 2. 7 0. 9 0. 2 2. 6 0. 5 0. 2 3. 0 0. 8 % DEV CONN 0. 06 0. 76 0. 08 0. 06 0. 13 0. 20 0. 07 0. 08 0. 07 0. 02 0. 06 0. 09 0. 00 0. 07 % DEV UTIL 0. 28 0. 79 0. 08 0. 32 0. 25 0. 42 0. 56 0. 28 0. 43 0. 28 0. 06 0. 28 0. 35 0. 00 0. 35 % DEV RESV 0. 0 0. 0 AVG NUMBER ALLOC 1. 0 3. 0 6. 0 1. 0 2. 0 1. 0 % ANY ALLOC 100. 0 100. 0 % MT PEND 0. 0 0. 0

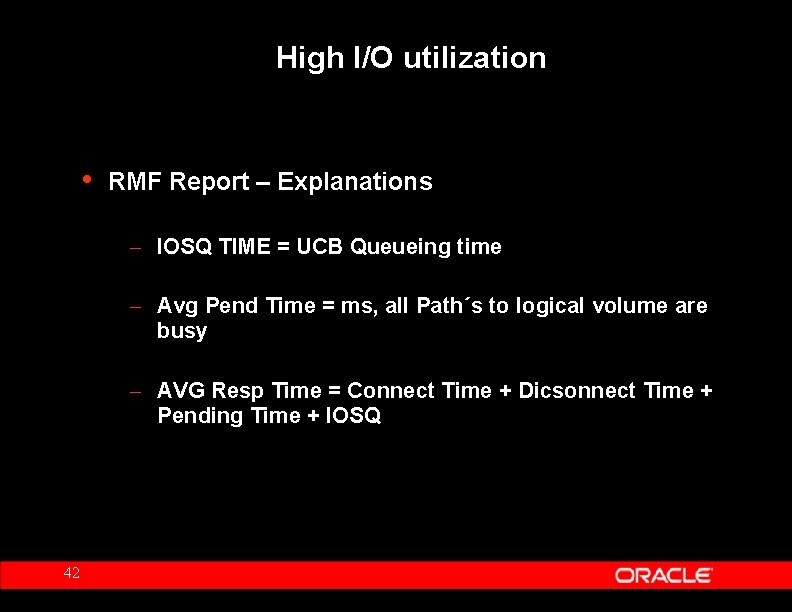
High I/O utilization • RMF Report – Explanations – IOSQ TIME = UCB Queueing time – Avg Pend Time = ms, all Path´s to logical volume are busy – AVG Resp Time = Connect Time + Dicsonnect Time + Pending Time + IOSQ 42

SQL Tuning • Check Object Statsitics – Use DBMS_STATS • Analyze Execution Plan – Explain Query – Optimize Indexes – Index Only Access, Function Based Indexes 43

Diagnose 44 • High CPU Usage • High I/O utilization • Memory Usage • Network problems • „idle“ System • Operating System (WLM, VM)

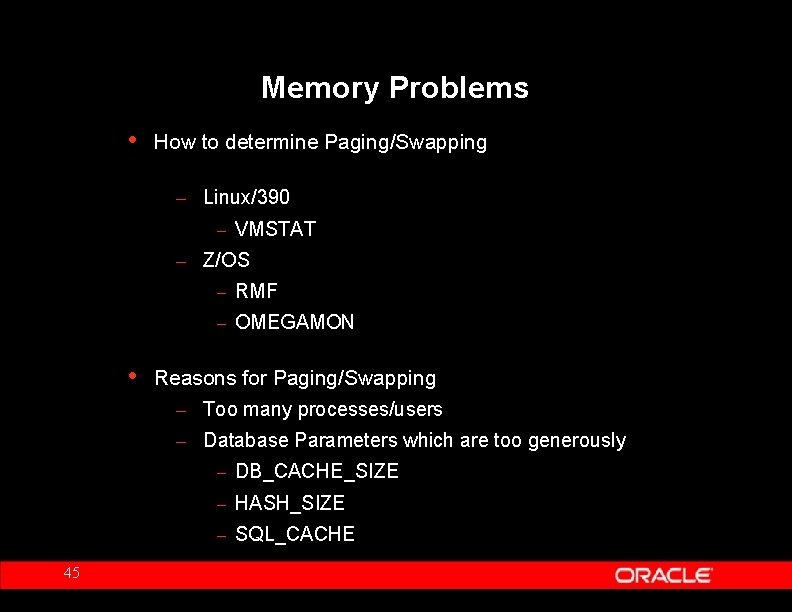
Memory Problems • How to determine Paging/Swapping – Linux/390 – VMSTAT – Z/OS – RMF – OMEGAMON • 45 Reasons for Paging/Swapping – Too many processes/users – Database Parameters which are too generously – DB_CACHE_SIZE – HASH_SIZE – SQL_CACHE

Diagnosing high CPU usage -Operating System- 46 • High CPU Usage • High I/O utilization • Memory Usage • Network problems • „idle“ System • Operating System (WLM, VM)

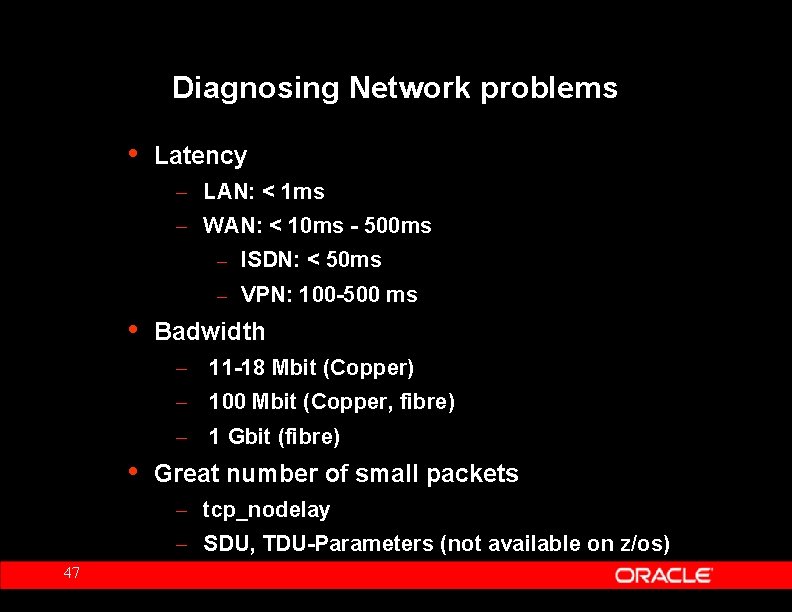
Diagnosing Network problems • Latency – LAN: < 1 ms – WAN: < 10 ms - 500 ms – ISDN: < 50 ms – VPN: 100 -500 ms • Badwidth – 11 -18 Mbit (Copper) – 100 Mbit (Copper, fibre) – 1 Gbit (fibre) • Great number of small packets – tcp_nodelay – SDU, TDU-Parameters (not available on z/os) 47

Diagnosing high CPU usage -Operating System- 48 • High CPU Usage • High I/O utilization • Memory Usage • Network problems • „idle“ System • Operating System (WLM, VM)

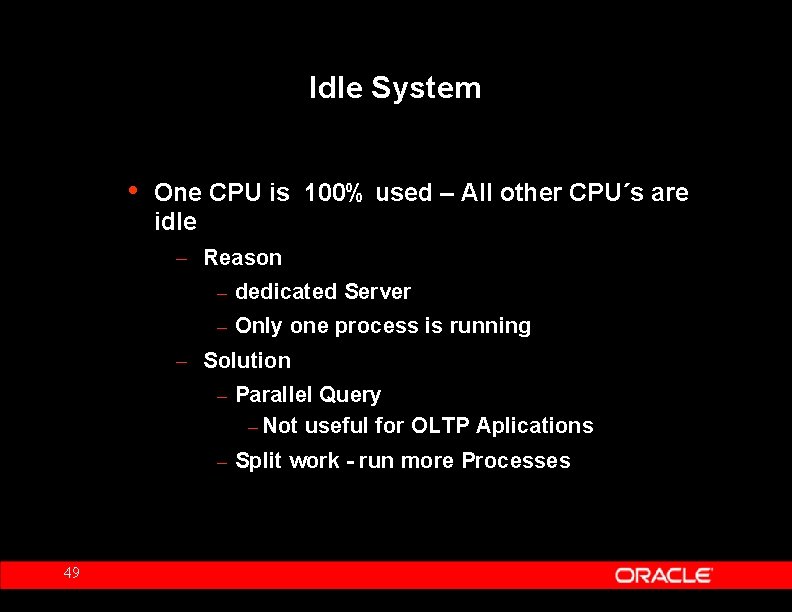
Idle System • One CPU is 100% used – All other CPU´s are idle – Reason – dedicated Server – Only one process is running – Solution – Parallel Query – Not useful for OLTP Aplications – Split work - run more Processes 49

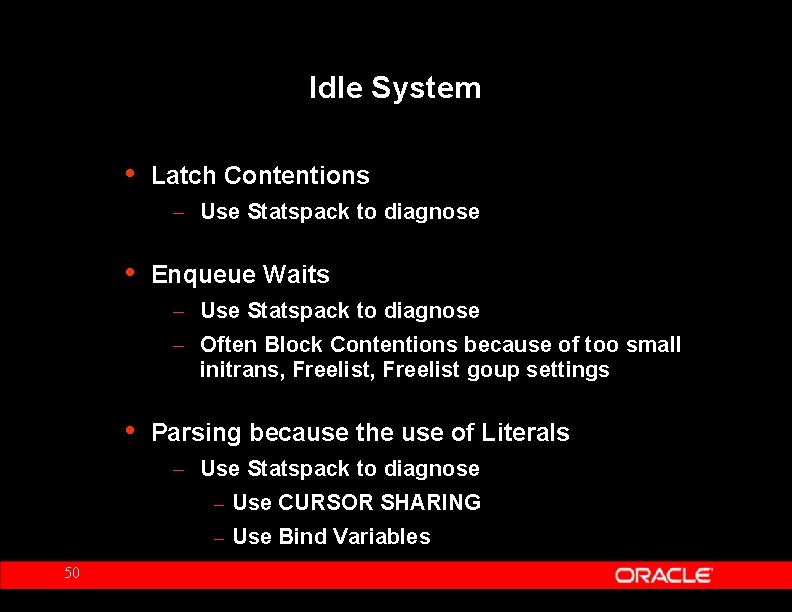
Idle System • Latch Contentions – Use Statspack to diagnose • Enqueue Waits – Use Statspack to diagnose – Often Block Contentions because of too small initrans, Freelist goup settings • Parsing because the use of Literals – Use Statspack to diagnose – Use CURSOR SHARING – Use Bind Variables 50

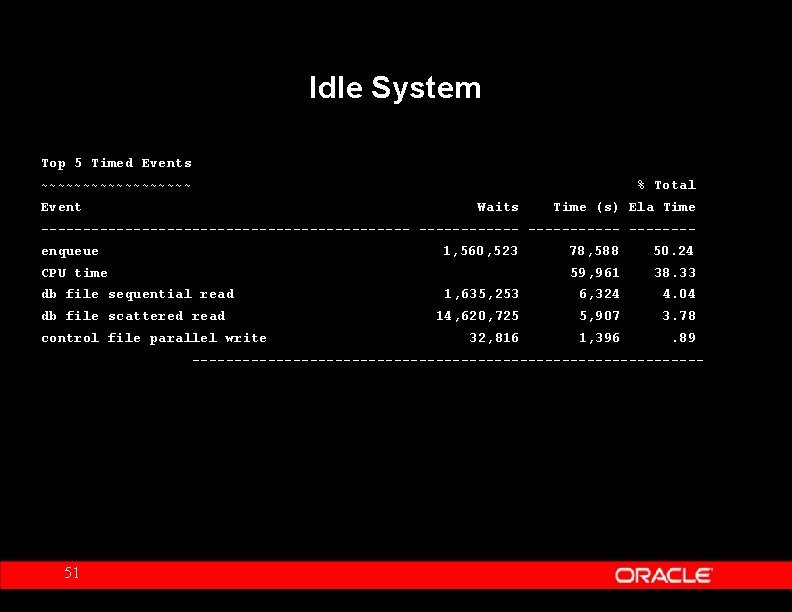
Idle System Top 5 Timed Events ~~~~~~~~~ % Total Event Waits Time (s) Ela Time ---------------------- -------enqueue 1, 560, 523 78, 588 50. 24 59, 961 38. 33 1, 635, 253 6, 324 4. 04 14, 620, 725 5, 907 3. 78 32, 816 1, 396 . 89 CPU time db file sequential read db file scattered read control file parallel write ------------------------------- 51

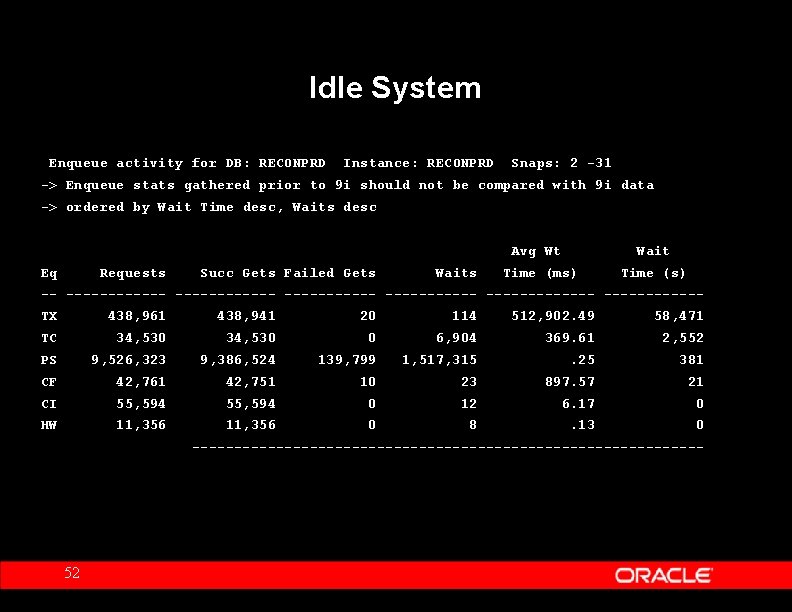
Idle System Enqueue activity for DB: RECONPRD Instance: RECONPRD Snaps: 2 -31 -> Enqueue stats gathered prior to 9 i should not be compared with 9 i data -> ordered by Wait Time desc, Waits desc Avg Wt Eq Requests Succ Gets Failed Gets Wait Time (ms) Time (s) -- ------------ -----------TX 438, 961 438, 941 20 114 512, 902. 49 58, 471 TC 34, 530 0 6, 904 369. 61 2, 552 PS 9, 526, 323 9, 386, 524 139, 799 1, 517, 315 . 25 381 CF 42, 761 42, 751 10 23 897. 57 21 CI 55, 594 0 12 6. 17 0 HW 11, 356 0 8 . 13 0 ------------------------------- 52

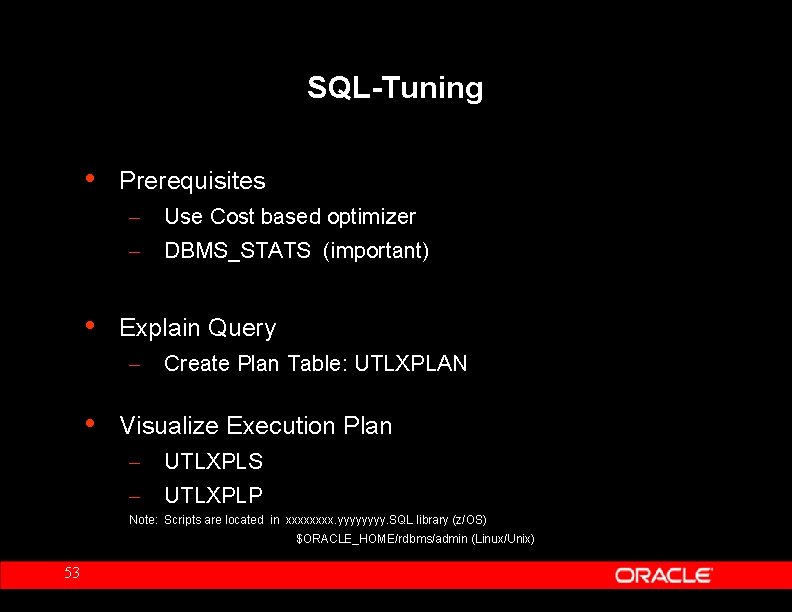
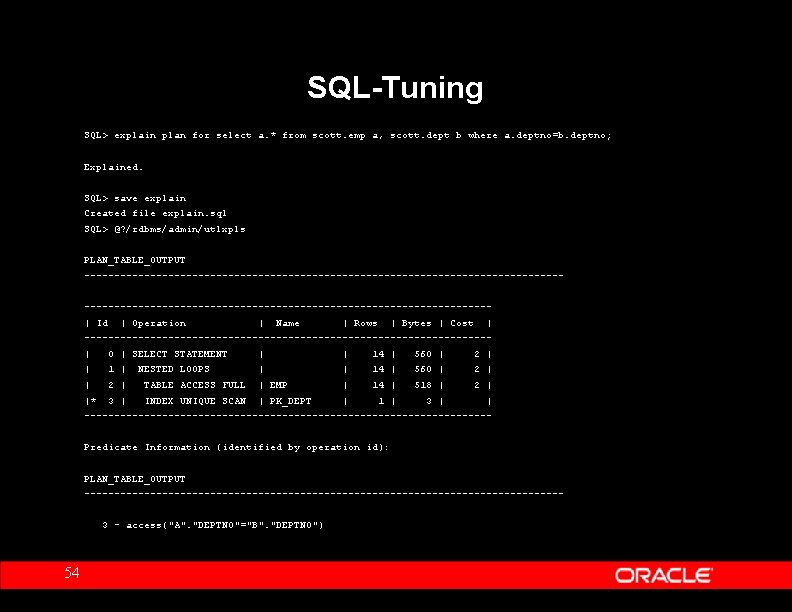
SQL-Tuning • • Prerequisites – Use Cost based optimizer – DBMS_STATS (important) Explain Query – • Create Plan Table: UTLXPLAN Visualize Execution Plan – UTLXPLS – UTLXPLP Note: Scripts are located in xxxx. yyyy. SQL library (z/OS) $ORACLE_HOME/rdbms/admin (Linux/Unix) 53

SQL-Tuning SQL> explain plan for select a. * from scott. emp a, scott. dept b where a. deptno=b. deptno; Explained. SQL> save explain Created file explain. sql SQL> @? /rdbms/admin/utlxpls PLAN_TABLE_OUTPUT -------------------------------------------------------------------------| Id | Operation | Name | Rows | Bytes | Cost | ----------------------------------| 0 | SELECT STATEMENT | | 14 | 560 | 2 | | 1 | | | 14 | 560 | 2 | TABLE ACCESS FULL | EMP | 14 | 518 | 2 | |* 3 | INDEX UNIQUE SCAN | PK_DEPT | 1 | 3 | | NESTED LOOPS ----------------------------------Predicate Information (identified by operation id): PLAN_TABLE_OUTPUT ----------------------------------------3 - access("A". "DEPTNO"="B". "DEPTNO") 54

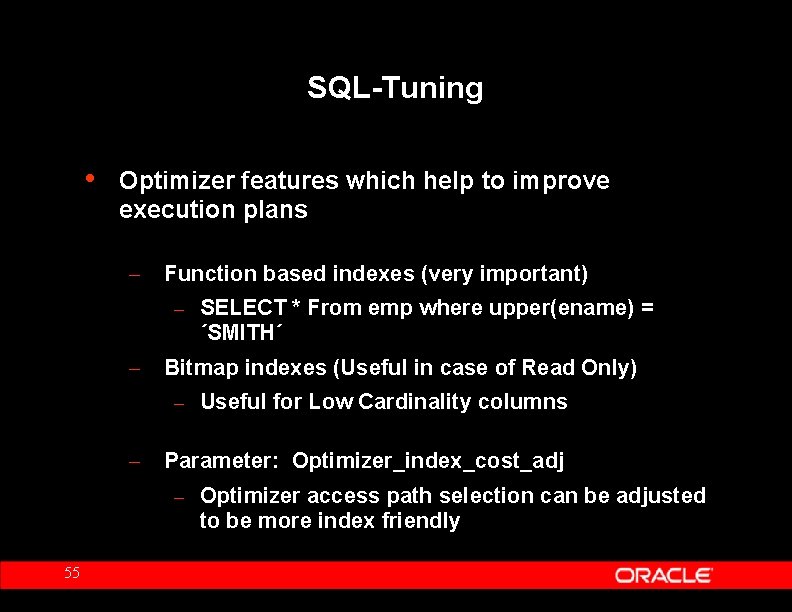
SQL-Tuning • Optimizer features which help to improve execution plans – Function based indexes (very important) – SELECT * From emp where upper(ename) = ´SMITH´ – Bitmap indexes (Useful in case of Read Only) – Useful for Low Cardinality columns – Parameter: Optimizer_index_cost_adj – Optimizer access path selection can be adjusted to be more index friendly 55

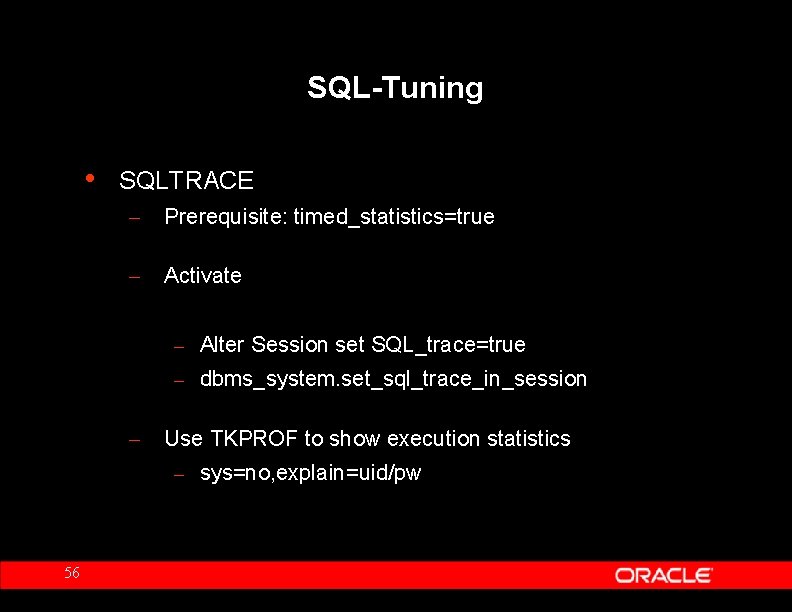
SQL-Tuning • SQLTRACE – Prerequisite: timed_statistics=true – Activate – Alter Session set SQL_trace=true – dbms_system. set_sql_trace_in_session – Use TKPROF to show execution statistics – sys=no, explain=uid/pw 56

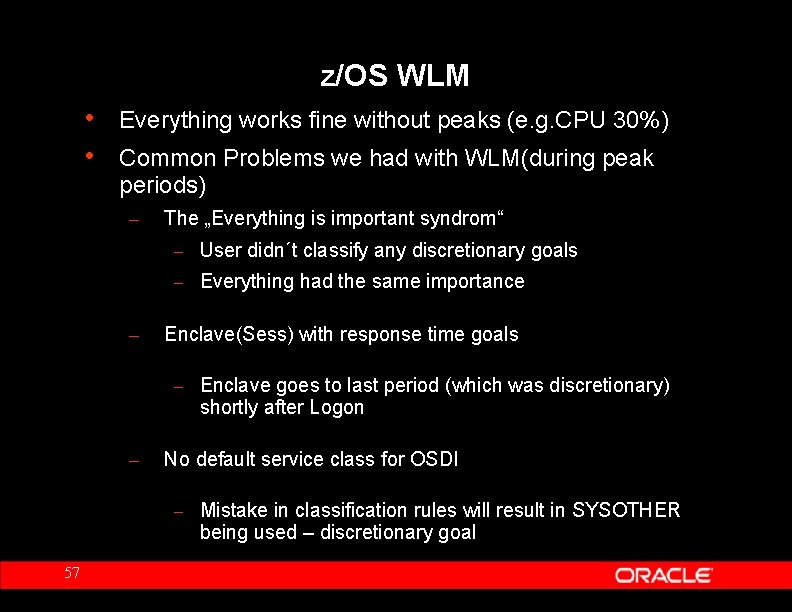
z/OS WLM • • Everything works fine without peaks (e. g. CPU 30%) Common Problems we had with WLM(during peak periods) – The „Everything is important syndrom“ – User didn´t classify any discretionary goals – Everything had the same importance – Enclave(Sess) with response time goals – Enclave goes to last period (which was discretionary) shortly after Logon – No default service class for OSDI – Mistake in classification rules will result in SYSOTHER being used – discretionary goal 57

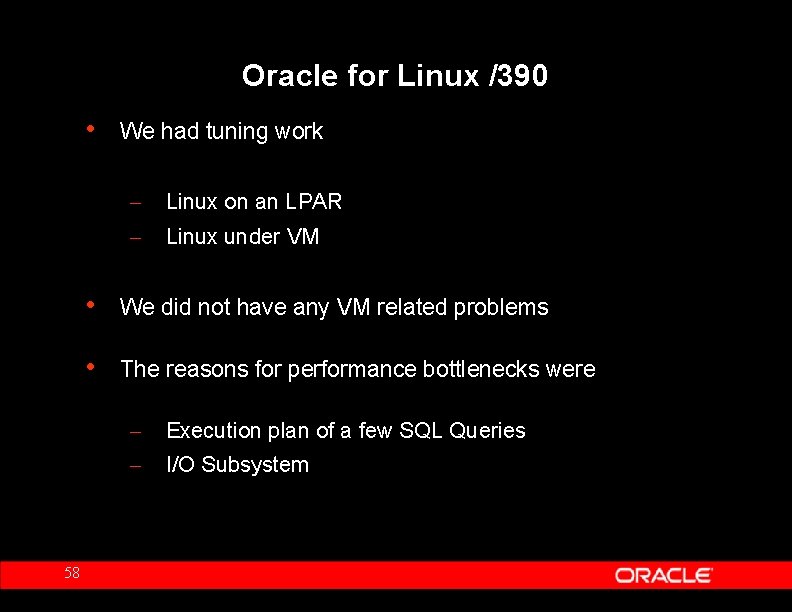
Oracle for Linux /390 • 58 We had tuning work – Linux on an LPAR – Linux under VM • We did not have any VM related problems • The reasons for performance bottlenecks were – Execution plan of a few SQL Queries – I/O Subsystem

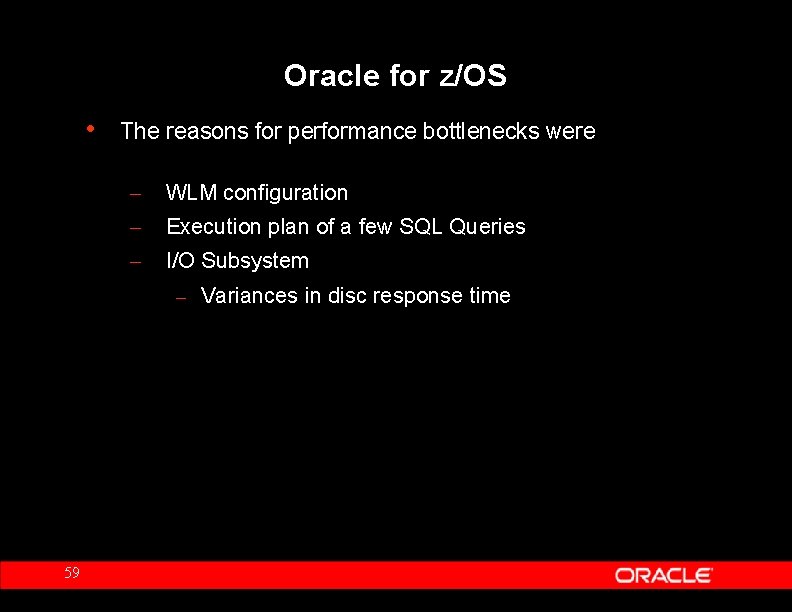
Oracle for z/OS • The reasons for performance bottlenecks were – WLM configuration – Execution plan of a few SQL Queries – I/O Subsystem – Variances in disc response time 59

? 60