Your tuning arsenal AWR ADDM ASH Metrics and


 – Interface")


")
 from v$system_event group by wait_class order by sum(time_waited) desc; WAIT_CLASS")


 • High-load SQL statements • Time")


 –")


")

 • • • CPU bottlenecks Excessive parsing Lock contention")

 $OH/rdbms/admin/addmrpt. sql")
 from dba_advisor_findings where")
 count, message from dba_advisor_findings")

")


 • False positives (check validity")

 -> V$SYSMETRIC_HISTORY • V$EVENTMETRIC (V$SYSTEM_EVENT) -> V$EVENT_METRIC_HISTORY • V$SYSMETRIC_SUMMARY")


- Slides: 63
Your tuning arsenal: AWR, ADDM, ASH, Metrics and Advisors John Kanagaraj DB Soft Inc Expert Session #260
Speaker Qualifications • John is a Principal Consultant @ DB Soft Inc. • Executive Editor for IOUG’s SELECT Journal • Co-author of “Oracle Database 10 g Insider Solutions” • Technical Editors for various books • Frequent presenter – IOUG/OAUG/OOW • Published in SELECT, OAUG Insight, SQL Server Magazine
SELECT: Call for Articles/Reviewers – Distributed to all IOUG members worldwide • Submit an article or Review one! • Contact ‘select@ioug. org’
What this presentation is about • • • Tuning tools in Oracle 10 g. R 2 AWR, ADDM, ASH, Metrics, Advisors Look “Under the hood” Real life Examples Audience Survey: Use of GUI tools, DB Console, Grid Control
Philosophy behind Oracle DB 10 g • “Automation” – Incremental steps in 9 i (Advisors, Time) – Major changes in many areas – Most significant change in Performance management – “Out of the box” setups – GUI “hides” the complexity (and details!)
Previous status • DB never lacked perf. statistics • Then what was lacking? – Consistency – Common/Unified interface – Stats storage and presentation – Interpretation
Now in Oracle DB 10 g…. • Performance Management – Consistency (AWR) – Interface (DB Console/Views) – Storage/Presentation (AWR/DBC) – Interpretation (Advisors) • Builds on previous concepts! • HOWEVER (!!) – Check licensing
“OWI” - The “Wait” interface • • • OWI – Term never acknowledged “What is the session waiting for? ” Rolls up session/system level Ignores the “CPU” component Well understood (after many years!)
The basics – Session State • Session State: – Starting up or shutting down – Executing on the CPU – Waiting in the CPU queue to execute – Waiting for an event external to the process to complete (OWI)
An earlier realization • Oracle recognized this • Look at a STATSPACK report – “Top 5 Wait Events” – 8 i/9 i. R 1 – “Top 5 Timed Event” – 9 i. R 2 (and 10 g) • CPU stats from V$SESSTAT and V$SYSSTAT
Time Model in 10 g • • V$SYS_TIME_MODEL – System V$SESS_TIME_MODEL – Session Some values are roll-ups of others E. g. “DB Time” => “DB CPU” + Connection management time + Parse time + (others) • Extremely valuable (V$SESSTAT++)
SQL> select stat_name, value from v$sys_time_model 2 where value > 0; STAT_NAME VALUE -----------------------DB time 893170091346 DB CPU 176244910473 sequence load elapsed time 10215471781 parse time elapsed 4524012412 hard parse elapsed time 3657262901 failed parse elapsed time 103540062 hard parse (sharing criteria) elapsed time 365217641 hard parse (bind mismatch) elapsed time 5923514 repeated bind elapsed time 14768010 connection management call elapsed time 328536127 PL/SQL execution elapsed time 5554924592 PL/SQL compilation elapsed time 333815896 background elapsed time 13782131027 background cpu time 4572399582 Zero values for statistics such as ‘Java execution elapsed time’
Wait Classes in 10 g • • • From 100 events (7. 3. 4) to 874 (10. 2)! 10 g classified events under “Wait Class” Rollup in V$SYSTEM_WAIT_CLASS Complete set in V$EVENT_NAME New WAIT_CLASS column in various “wait” views (system and session level)
SQL> select wait_class, sum(time_waited) from v$system_event group by wait_class order by sum(time_waited) desc; WAIT_CLASS SUM(TIME_WAITED) ---------------Idle 1167524793 User I/O 50076396 Application 23244155 System I/O 544713 Concurrency 462203 Network 44112 Other 11973 Commit 11021 Configuration 5736 SQL> select wait_class, name from v$event_name 3 where wait_class in ('System I/O', 'Concurrency') order by wait_class, name; WAIT_CLASS ---------Concurrency Concurrency System I/O NAME ------------------------------buffer busy waits enq: TX - index contention (** Enqueue type broken out!**) latch: cache buffers chains (** Latch type broken out!**) latch: library cache os thread startup LGWR sequential i/o control file parallel write recovery read
Front page news – DB Console
Automatic Workload Repository • Performance Data Warehouse for 10 g • AWR collects, stores performance data – In-memory component (V$/Metric views) – “Persisted” in WR tables (SYSAUX) – 162 tables – WRI$, WRH$, WRM$ • Self managing “out of the box” • Set retention, frequency, baseline
Automatic Workload Repository • Active Session History (ASH) • High-load SQL statements • Time model statistics (both System/Session) • Object usage - access counts for segments • Snapshots of V$ and some Metrics
AWR – “Statspack on Steroids” • • • Similar to STATSPACK “snapshots” Reportable – AWRRPT. SQL AWR snapshot automatically analyzed Accessible via GUI and API/SQL (*) High-impact SQL captured differently Stores session level info as well
AWR – Storage in SYSAUX SQL> select occupant_name, occupant_desc, space_usage_kbytes 2 from v$sysaux_occupants 3 where occupant_name like 'SM%‘; Name -----SM/AWR SM/ADVISOR SM/OPTSTAT SM/OTHER Description Used KB --------------------------Server Manageability-Automatic Workload Repository 200192 Server Manageability-Advisor Framework 39104 Server Manageability-Optimizer Statistics History 102912 Server Manageability-Other Components 9472 • Overheads of AWR – Storage, Collection, Archive log usage, latching • Metalink Note 296765. 1
AWR Baselines • • • Enables performance “baselining” Collection of two or more snapshots Stored in “_BL” tables; data retained View using WRM$_BASELINE Reports diff via AWRDDRPT. SQL Can also be used with SQL Tuning Sets
API - DBMS_WORKLOAD_REPOSITORY • Scripts in $OH/rdbms/admin – awrrpt. sql AWR report (STATSPACK) – awrddrpt. sql AWR Diff-Diff report – awrextr. sql frontends a Data. Pump dump – awrinfo. sql Space usage by AWR/ASH – awrsqrpt. sql Execution statistics for specific SQL statement
ASH – What’s up with sessions • • • Historical view of active sessions V$ACTIVE_SESSION_HISTORY Active sessions sampled every second Stored in circular memory buffer Every 10 th sample persisted in AWR Enables “after-the-fact” analysis!!!
ASH – Session states exposed! • “On-the-spot” analysis • Retroactive analysis – From memory buffer (V$ACTIVE_SESSION_HISTORY) – From persisted AWR data (WRH$_ACTIVE_SESSION_HISTORY connected via SNAP_ID) • High load SQL execution behavior • Determine Blocking sessions and “hot” segments • SESSION_STATE : “ON CPU” or “WAITING”
ASH – What is happening to me? ! SQL> select event, seq#, p 1, p 2, p 3, blocking_session 2 from v$active_session_history 3 where session_id = 113 and session_serial# = 333; EVENT Seq# P 1 P 2 P 3 Blk. Sess -------------- ------------db file sequential read 34786 29 182279 1 0 db file scattered read 34870 19 103899 8 0 db file sequential read 34954 29 183370 1 0 db file scattered read 35040 19 102299 8 0 enq: TX - row lock contention 35119 1415053318 524322 11255 142 db file scattered read 35204 19 99643 8 0 db file scattered read 35207 19 102371 8 0 enq: TX - row lock contention 35220 1415053318 524322 11255 142 db file scattered read 35232 19 100019 8 0 enq: TX - row lock contention 35243 1415053318 524322 11255 142 db file scattered read 35256 19 102747 8 0
ASH Report - New in 10 g. R 2 • Summary of all user activity over the selected period • Drill down to a more granular period • List details of only a Session, SQL ID, Wait Class, Service, Module or Client ID over a particular period • “Top” Background events, P 1 -P 3 values, etc. • $OH/rdbms/admin/ashrpt. sql + GUI
Activity Over Time -> Analysis period is divided into smaller time slots -> Top 3 events are reported in each of those slots -> 'Slot Count' shows the number of ASH samples in that slot -> 'Event Count' shows the number of ASH samples waiting for that event in that slot -> '% Event' is 'Event Count' over all ASH samples in the analysis period Slot Event Slot Time (Duration) Count Event Count % Event ------------------- ------19: 50: 18 (42 secs) 86 enq: TX - row lock contention 43 8. 10 db file scattered read 39 7. 34 CPU + Wait for CPU 4 0. 75 19: 51: 00 (1. 0 min) 119 enq: TX - row lock contention 58 10. 92 db file scattered read 50 9. 42 CPU + Wait for CPU 11 2. 07 19: 52: 00 (1. 0 min) 126 enq: TX - row lock contention 60 11. 30 db file scattered read 50 9. 42 CPU + Wait for CPU 13 2. 45 19: 53: 00 (1. 0 min) 123 enq: TX - row lock contention 59 11. 11 db file scattered read 49 9. 23 CPU + Wait for CPU 15 2. 82 19: 54: 00 (38 secs) 77 enq: TX - row lock contention 37 6. 97 db file scattered read 36 6. 78 CPU + Wait for CPU 3 0. 56
ASH - Others • Underscore parameters (last 2 new in 10 g. R 2) _ash_enable (Enable ASH? ) _ash_disk_filter_ratio (inmemory to flush -10) _ash_eflush_trigger (emergency flush 66% by default) _ash_sampling_interval (1 second) _ash_disk_write_enable (enable ASH history flushing to disk) _ash_sample_all (sample everything including inactive sessions) • ASH Dump – Metalink Note 243132. 1
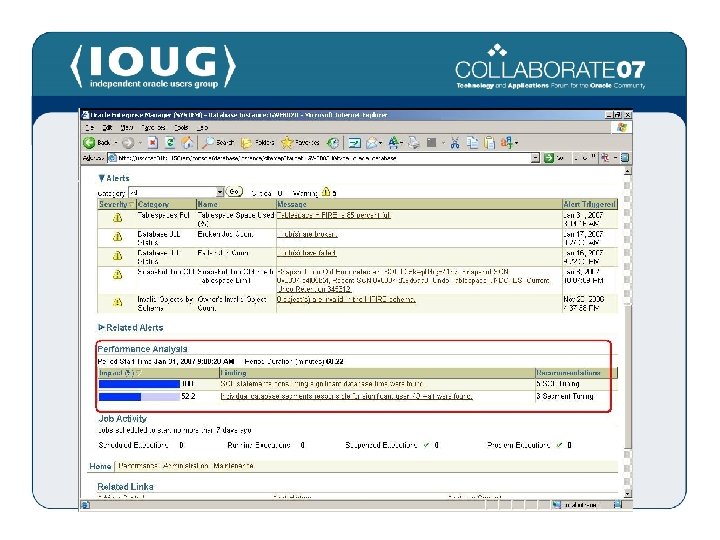
ADDM – Your unpaid Tuning Expert! • • Starting point for most investigations Runs after every AWR snapshot Determines and records performance issue Recommends corrective action Generates probable benefit Suggest use of other advisors Common currency - “DB Time” (qualitative!)
ADDM checks for: (partial list) • • • CPU bottlenecks Excessive parsing Lock contention Concurrency I/O capacity Incorrect sizing of Oracle memory and file structures High-load SQL, Java and PL/SQL statements Poor connection management Hot objects RAC-specific issues
ADDM – Findings/Recommendations • • • Hardware changes Database-configuration changes Schema-level changes Application changes Using other advisors (for example) – SQL Tuning / Access Advisor – Segment Advisor
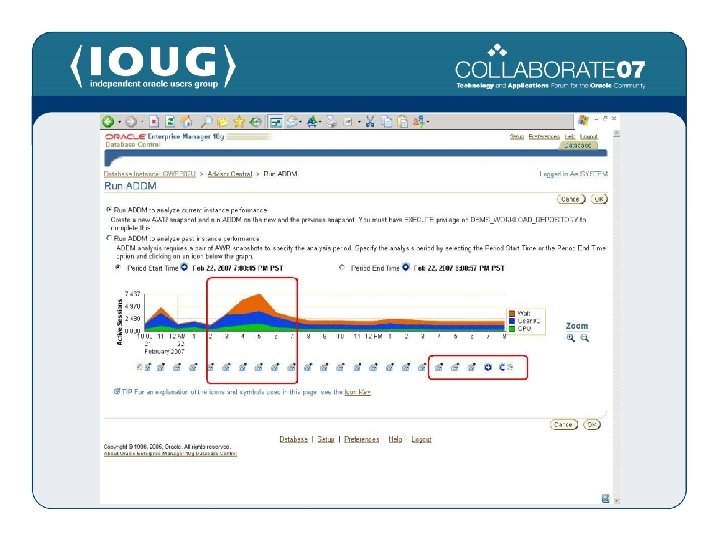
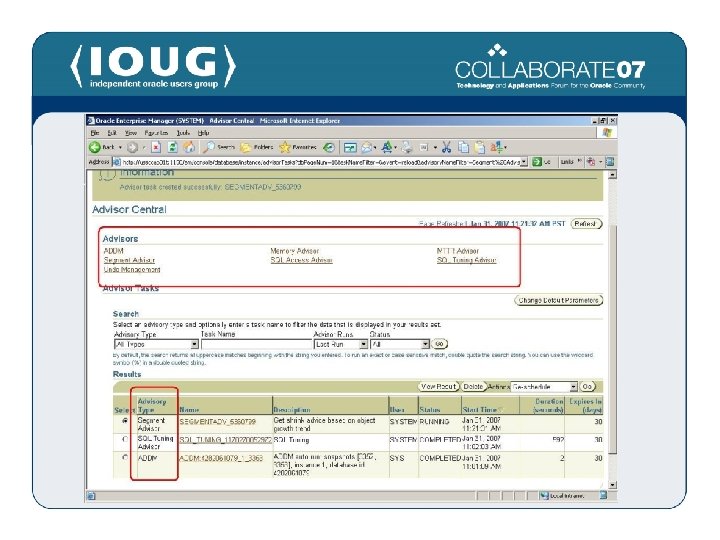
ADDM – Accessing “ADDu. M” • • GUI! (easiest because of linkage) $OH/rdbms/admin/addmrpt. sql API – DBMS_ADVISOR In-built PL/SQL Look at following tables – – DBA_ADVISOR_LOG DBA_ADVISOR_FINDINGS DBA_ADVISOR_RECOMMENDATIONS DBA_ADVISOR_ACTIONS – DBA_ADVISOR_RATIONALE
ADDM – Don’t stare at the screen! SQL> select type, count(*) from dba_advisor_findings where task_id in (select task_id from dba_advisor_log where execution_start > sysdate - 1) group by type; TYPE -----INFORMATION WARNING SYMPTOM PROBLEM COUNT(*) -------46 1 49 79
ADDM – Don’t stare at the screen! SQL> select count(*) count, message from dba_advisor_findings where task_id in (select task_id from dba_advisor_log where execution_start > sysdate - 1) and type = 'PROBLEM‘ group by message order by 1 desc; COUNT MESSAGE -----------------------------------24 SQL statements consuming significant database time were found. 24 SQL statements were found waiting for row lock waits. 24 Individual database segments responsible for significant user I/O wait were found. 4 The execution plan of this statement can be improved by creating one or more indices 1 PL/SQL execution consumed significant database time. 1 Significant virtual memory paging was detected on the host operating system. 1 The throughput of the I/O subsystem was significantly lower than expected
Advisors – More freebies! • 9 i – Buff. Cache, Summary, Sh. Pool, etc • New in Oracle Database 10 g – SQL Tuning Advisor – SQL Access Advisor – Segment Advisor – Redolog sizing Advisor – Undo Advisor
Advisor Framework • Ensures consistency and uniformity – Access (GUI, API - DBMS_ADVISOR, DBMS_SQLTUNE) – Storage (Collection, AWR) – Invocation (easily and seamlessly between each other) – Parameterization (WR%ADV%PAR%) – Reporting (Common tables and API)
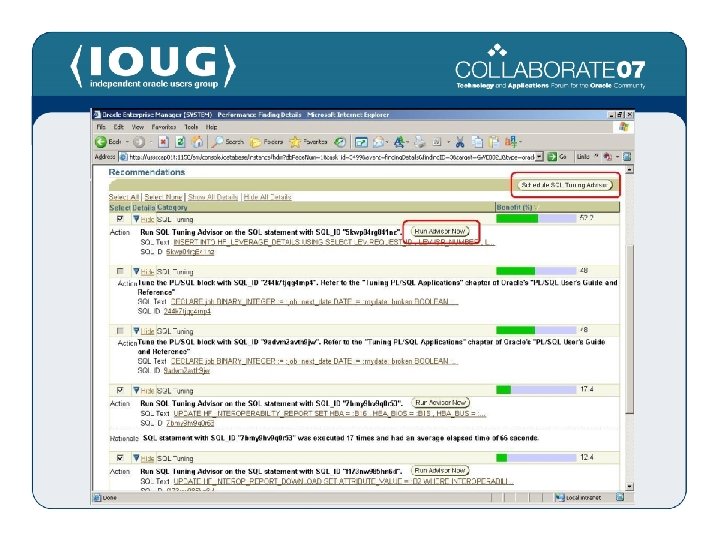
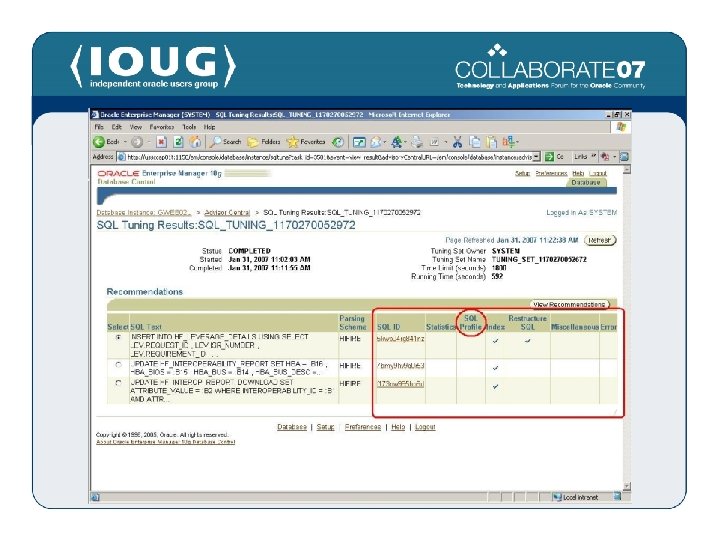
SQL Tuning Advisor – What? • • • Frontend to Automatic Tuning Optimizer Extension (reuse) of Optimizer (CBO) Performs “what-if” analysis Creates an “SQL Profile” (as required) Not restricted by “time to optimize” (_optimizer_max_permutations = 2000)
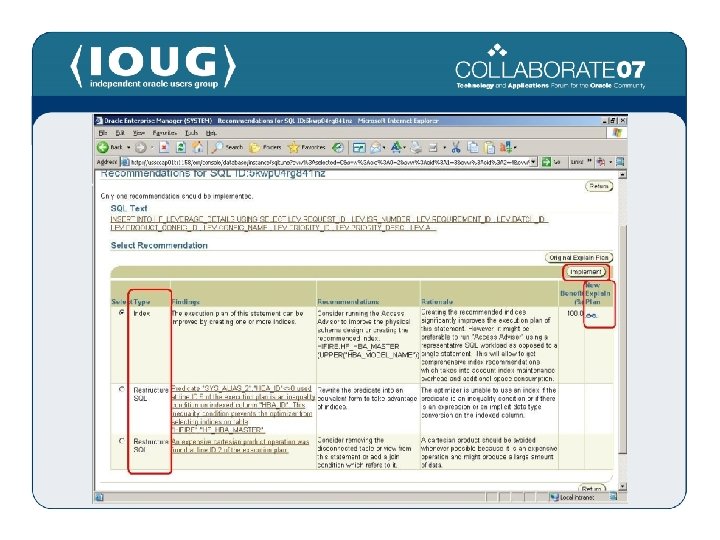
SQL Tuning Advisor – How? • The following advice is provided – – Gather missing or stale statistics Create new indexes Restructure SQL statement SQL profiles • SQL Profile – collects additional information via sampling/partial execution techniques – verifies and adjusts CBO’s estimates at runtime
SQL Profiles • Similar in function to Outlines • Stored in the Data dictionary when accepted (DBA_SQL_PROFILES) • Located by hash value of SQL statement • Enabled by category so “test-and-set” • Access/manipulate – DBMS_SQLTUNE • Precedence given to Stored Outlines (? ? !!)
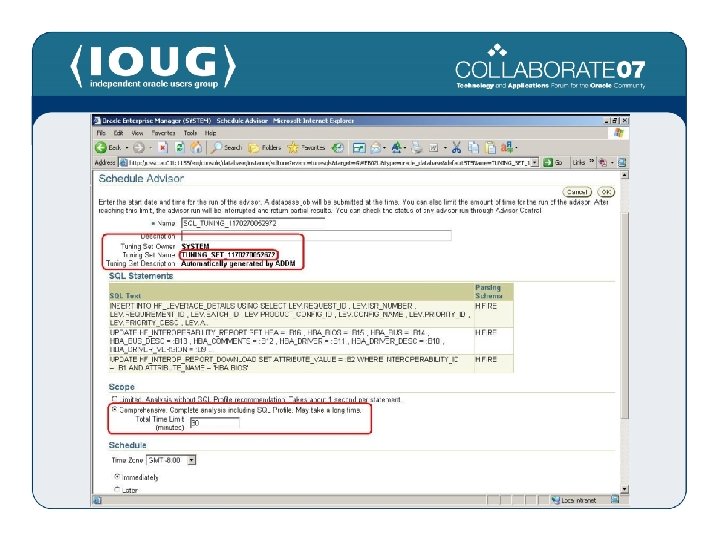
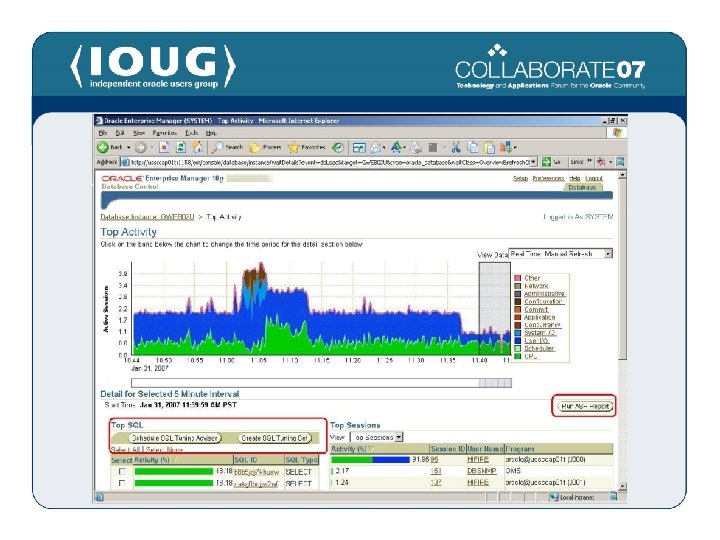
SQL Tuning Set • • Set of SQLs to be tuned all together DB object of SQLs and environments User can set priority within set Created from Top SQL (Spot/Period), ADDM -> Tuning Advisor, Userspecified • Use DBMS_SQLTUNE to manipulate
SQL Access Advisor – 9 i Sum. Adv++ • • • Works alongside SQL Tuning Advisor Advice on MV, Indexes, MV logs Considers space usage vs performance Inputs: STS, User-defined, Hypothetical Advanced: Workload type (RO), Drop unused indexes, Filters (Top N, Module)
Segment Advisor
Undo Advisor
Undo Advisor
Memory Advisor
Memory Advisor
Avoiding Advisor Pitfalls • Out-of-the-box thinking (redesign; rethink approach) • False positives (check validity for all situations – e. g. Index non-usage) • Changing workload or environment (additional load, new code, H/W or S/W changes)
Metrics and SGA • Statistics views -> Cumulative counters • Metrics -> Rate of change of counters • Alerts on rate -> Server Generated Alerts (changeable via EM) • Metrics -> In memory and persisted – Short/Long durations: 15/60 seconds – 3 mins of 15 seconds; 1 hr of 60 seconds
Metric Views • V$METRIC/V$SYSMETRIC (V$SYSSTAT) -> V$SYSMETRIC_HISTORY • V$EVENTMETRIC (V$SYSTEM_EVENT) -> V$EVENT_METRIC_HISTORY • V$SYSMETRIC_SUMMARY (Avg/Min/St. Dev) • WRH$_SYSMETRIC_SUMMARY • V$METRICNAME / V$METRICGROUP • Service metrics, Event Histogram, File/Temp Metrics
Server Generated Alerts • • • Alerts when set thresholds are reached DBA_THRESHOLDS V$ALERT_TYPES Under “SYSMAN” schema; uses AQ Fully functional monitoring system Controlled by EM (GC/DBC)
Tidbits - Tracing the Advisors • • • _db_mttr_trace_to_alert _optimizer_trace _smm_trace _stn_trace _xpl_trace Dump trace entries to alert Optimizer trace parameter SQL memory Manager SQL tracing parameter Explain Plan tracing • “Don’t do this at home!”
Tidbits – Advisor Messages • $OH/rdbms/mesg/smgus. msg • “Host CPU was a bottleneck and the instance was consuming %s% of the host CPU. All wait times will be inflated by wait for CPU. ” • “The SQL statement with SQL_ID "%s" was found waiting for the Interested Transaction List (ITL) enqueue on the %s "%s. %s" with object id %s. "
Tidbits – Statistics Aggregation • DBMS_MONITOR package • Enable stat collection & tracing at various levels (Client ID, Session, Service, Module, Action) • Boon for Connection. Pooled applications • Metalink Note: 281787. 1 • OTN articles
Where do you go from here? • Oracle DB 10 g Perf. Tuning Guide • ML Note: 332889. 1 Issues & Best Practices • ML Note: 276103. 1 Perf. Tuning using Advisors & Server Manageability • Books, OTN, IOUG, …
Items learnt in this session • • • Tuning tools in Oracle 10 g. R 2 AWR, ADDM, ASH, Metrics, Advisors Look “Under the hood” Real life Examples Next steps
Q & A – Feedback Your tuning arsenal: AWR, ADDM, ASH, Metrics and Advisors Expert Session #260 John Kanagaraj, DB Soft Inc ora_apps_dba_y@yahoo. com Please complete evaluation form!