Oracle Performance Tuning Overview of performance tuning strategies

- Slides: 18

Oracle Performance Tuning Overview of performance tuning strategies Allan Young June 2008

What is tuning? • Group of activities used to optimize and homogenize the performance of a database • Maximize use of system resources to perform work as efficiently and rapidly as possible • Goals – Minimizing response time – Increasing throughput – Increasing load capabilities – Decreasing recovery time 2

Who tunes? • Application Designers • Application Developers • Database Administrators • System Architects 3

Methodology • Ratios – – • Buffer Cache in high 90’s for OLTP Dictionary Cache Wait Interface – – – db file sequential read db file scattered read buffer busy wait Good Book • Oracle Wait Interface: A Practical Guide to Performance Diagnostics & Tuning – 4 Oracle Press

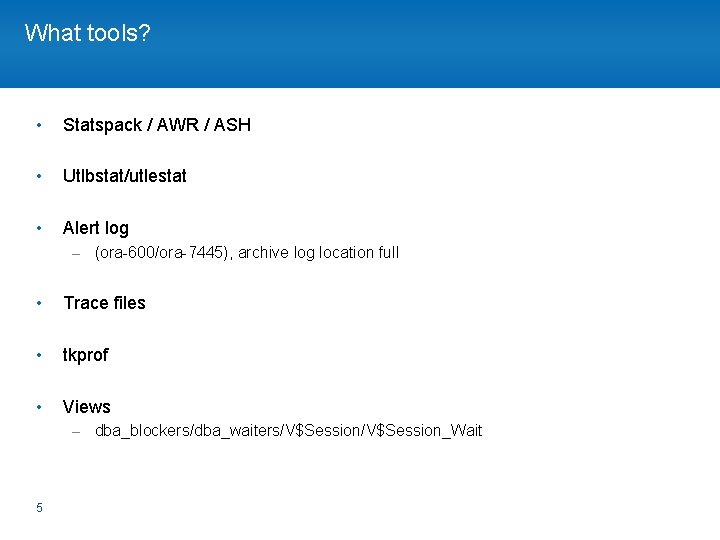
What tools? • Statspack / AWR / ASH • Utlbstat/utlestat • Alert log – (ora-600/ora-7445), archive log location full • Trace files • tkprof • Views – dba_blockers/dba_waiters/V$Session_Wait 5

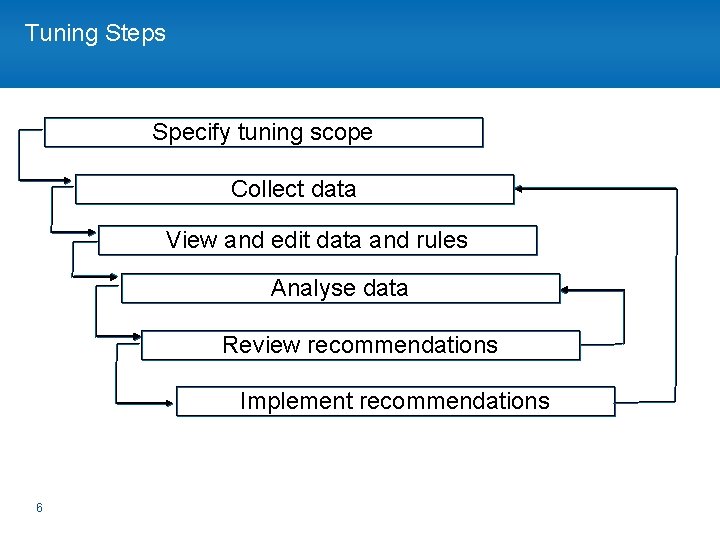
Tuning Steps Specify tuning scope Collect data View and edit data and rules Analyse data Review recommendations Implement recommendations 6

Quick Checks for Performance • Alert log for errors • Unix / Windows system logs for errors • Vmstat • perfmon 7

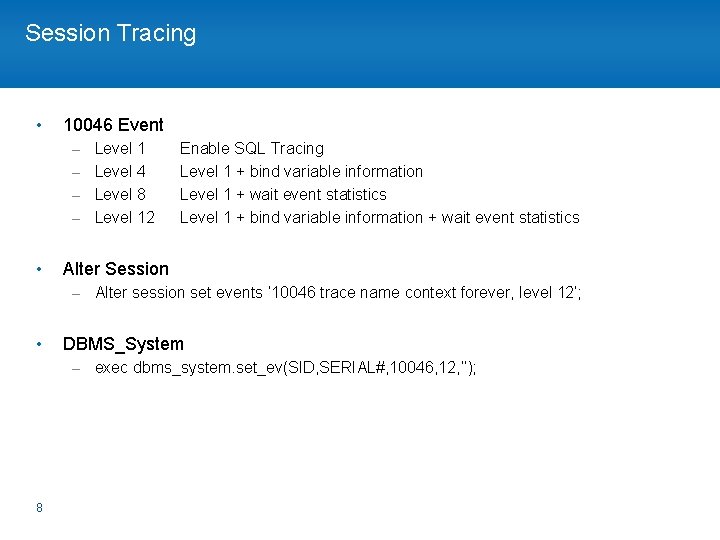
Session Tracing • 10046 Event – Level 1 – Level 4 – Level 8 – Level 12 • Enable SQL Tracing Level 1 + bind variable information Level 1 + wait event statistics Level 1 + bind variable information + wait event statistics Alter Session – Alter session set events ‘ 10046 trace name context forever, level 12’; • DBMS_System – exec dbms_system. set_ev(SID, SERIAL#, 10046, 12, ’’); 8

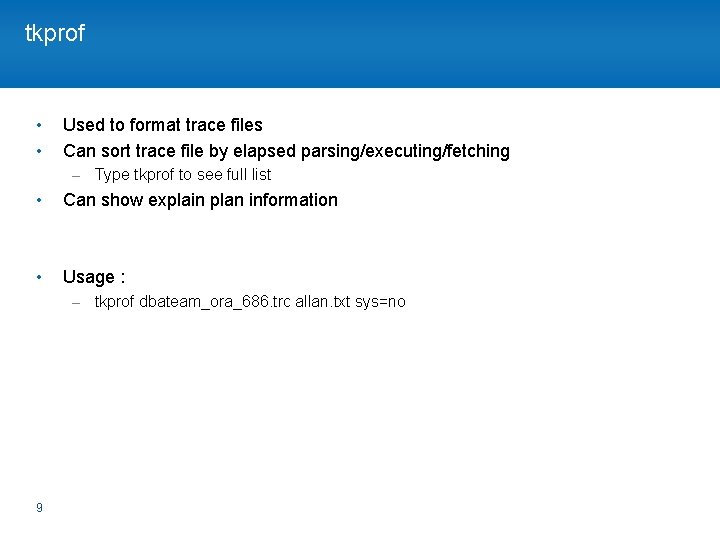
tkprof • • Used to format trace files Can sort trace file by elapsed parsing/executing/fetching – Type tkprof to see full list • Can show explain plan information • Usage : – tkprof dbateam_ora_686. trc allan. txt sys=no 9

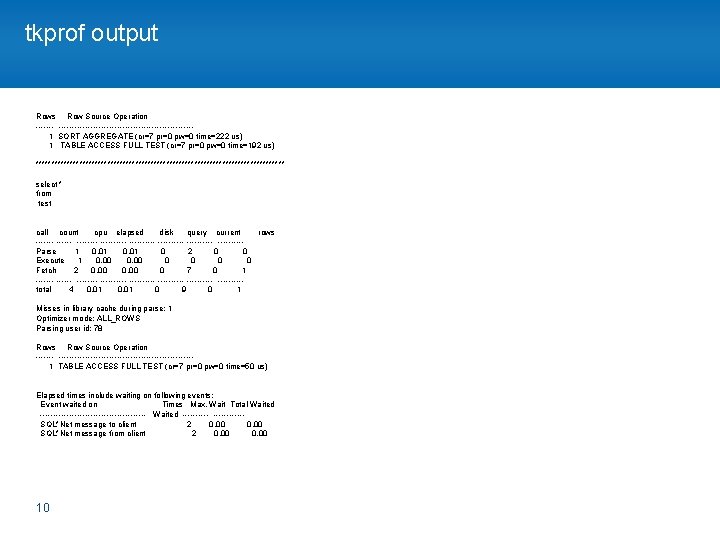
tkprof output Rows Row Source Operation -----------------------------1 SORT AGGREGATE (cr=7 pr=0 pw=0 time=222 us) 1 TABLE ACCESS FULL TEST (cr=7 pr=0 pw=0 time=192 us) **************************************** select * from test call count cpu elapsed disk query current rows -------- ---------- -----Parse 1 0. 01 0 2 0 0 Execute 1 0. 00 0 0 Fetch 2 0. 00 0 7 0 1 -------- ---------- -----total 4 0. 01 0 9 0 1 Misses in library cache during parse: 1 Optimizer mode: ALL_ROWS Parsing user id: 78 Rows Row Source Operation -----------------------------1 TABLE ACCESS FULL TEST (cr=7 pr=0 pw=0 time=50 us) Elapsed times include waiting on following events: Event waited on Times Max. Wait Total Waited -------------------- Waited -----------SQL*Net message to client 2 0. 00 SQL*Net message from client 2 0. 00 10

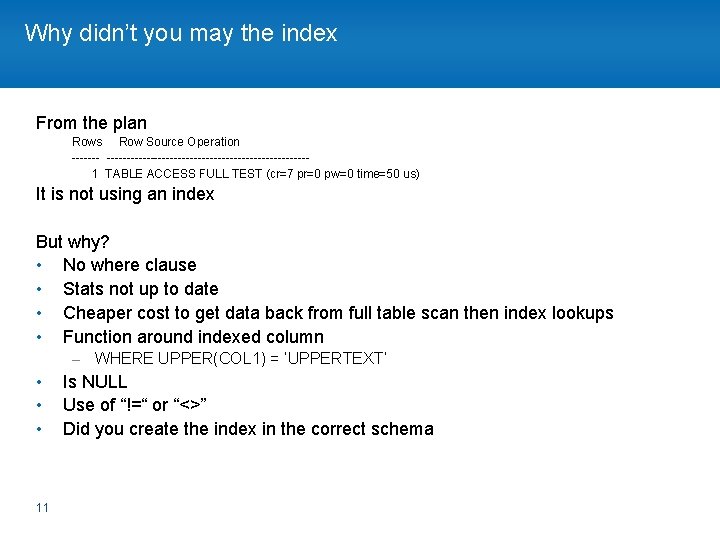
Why didn’t you may the index From the plan Rows Row Source Operation -----------------------------1 TABLE ACCESS FULL TEST (cr=7 pr=0 pw=0 time=50 us) It is not using an index But why? • No where clause • Stats not up to date • Cheaper cost to get data back from full table scan then index lookups • Function around indexed column – WHERE UPPER(COL 1) = ‘UPPERTEXT’ • • • 11 Is NULL Use of “!=“ or “<>” Did you create the index in the correct schema

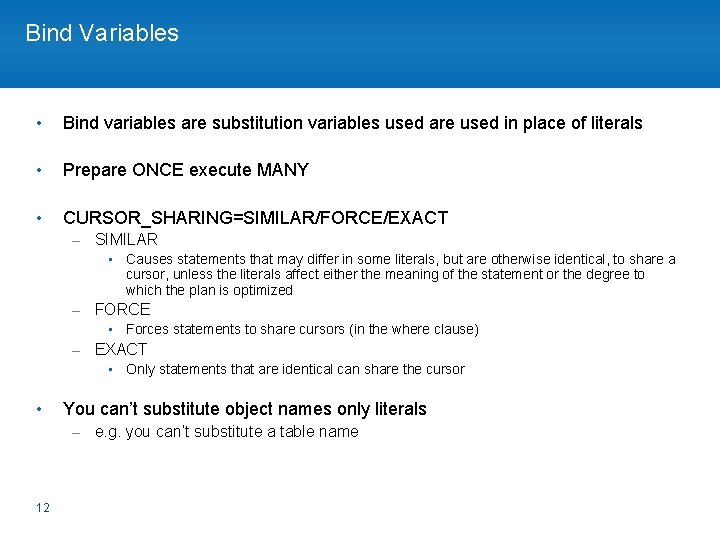
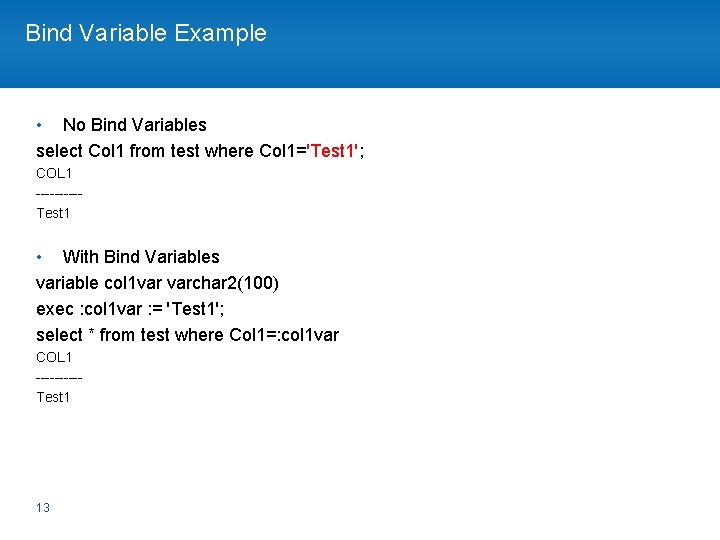
Bind Variables • Bind variables are substitution variables used are used in place of literals • Prepare ONCE execute MANY • CURSOR_SHARING=SIMILAR/FORCE/EXACT – SIMILAR • Causes statements that may differ in some literals, but are otherwise identical, to share a cursor, unless the literals affect either the meaning of the statement or the degree to which the plan is optimized – FORCE • Forces statements to share cursors (in the where clause) – EXACT • Only statements that are identical can share the cursor • You can’t substitute object names only literals – e. g. you can’t substitute a table name 12

Bind Variable Example • No Bind Variables select Col 1 from test where Col 1='Test 1'; COL 1 -----Test 1 • With Bind Variables variable col 1 var varchar 2(100) exec : col 1 var : = 'Test 1'; select * from test where Col 1=: col 1 var COL 1 -----Test 1 13

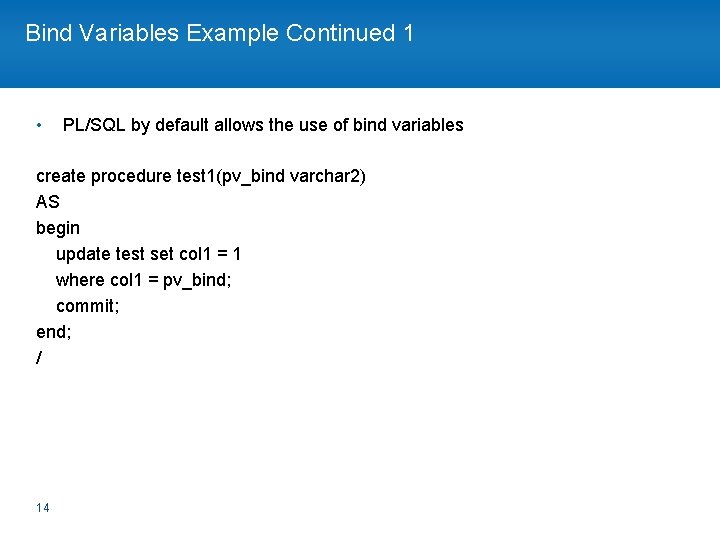
Bind Variables Example Continued 1 • PL/SQL by default allows the use of bind variables create procedure test 1(pv_bind varchar 2) AS begin update test set col 1 = 1 where col 1 = pv_bind; commit; end; / 14

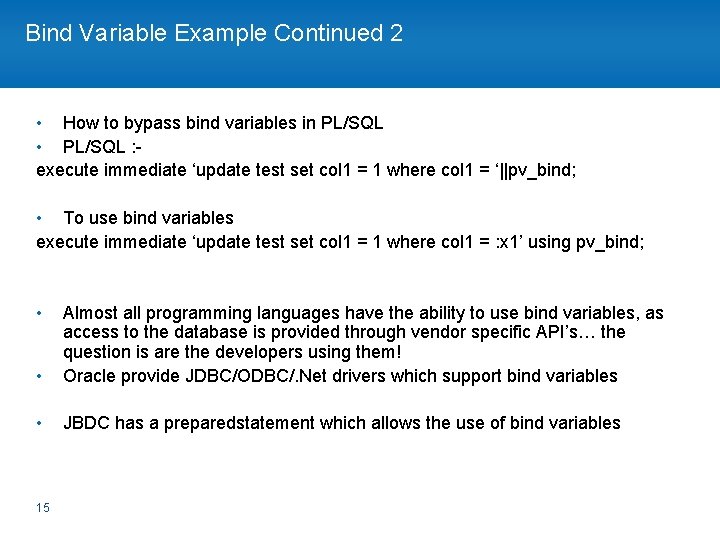
Bind Variable Example Continued 2 • How to bypass bind variables in PL/SQL • PL/SQL : execute immediate ‘update test set col 1 = 1 where col 1 = ‘||pv_bind; • To use bind variables execute immediate ‘update test set col 1 = 1 where col 1 = : x 1’ using pv_bind; • • Almost all programming languages have the ability to use bind variables, as access to the database is provided through vendor specific API’s… the question is are the developers using them! Oracle provide JDBC/ODBC/. Net drivers which support bind variables • JBDC has a preparedstatement which allows the use of bind variables 15

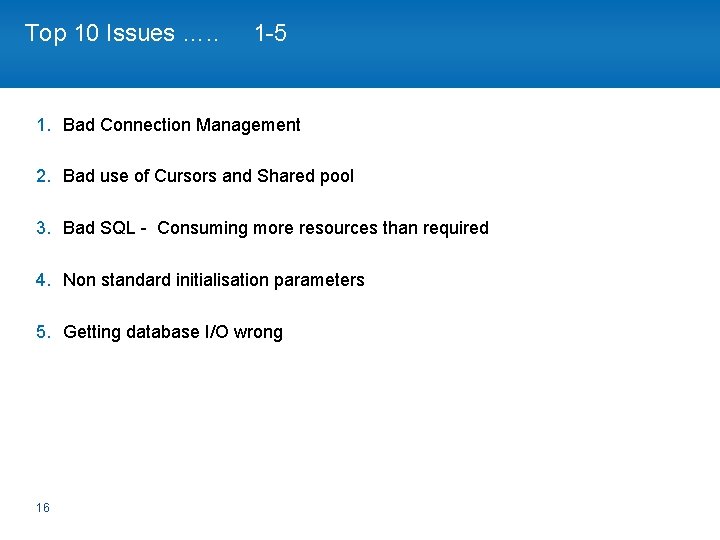
Top 10 Issues …. . 1 -5 1. Bad Connection Management 2. Bad use of Cursors and Shared pool 3. Bad SQL - Consuming more resources than required 4. Non standard initialisation parameters 5. Getting database I/O wrong 16

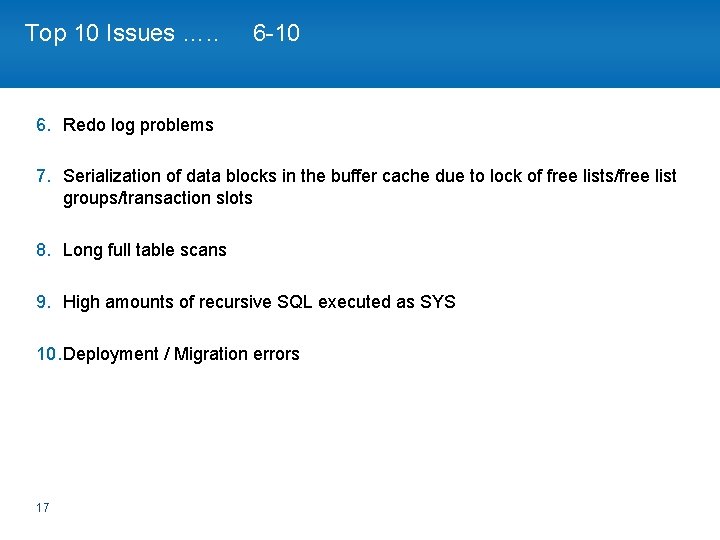
Top 10 Issues …. . 6 -10 6. Redo log problems 7. Serialization of data blocks in the buffer cache due to lock of free lists/free list groups/transaction slots 8. Long full table scans 9. High amounts of recursive SQL executed as SYS 10. Deployment / Migration errors 17

Questions Any Questions? 18