n Data Analysis for Evaluation n Eric Graig
- Slides: 33
n Data Analysis for Evaluation n Eric Graig, Ph. D.
Purpose of this Training n To increase your skills in analysis and interpretation of the information you collect n To increase your ability to report your findings to a variety of audiences n To learn how to make evaluation results actionable Innovation Network, Inc. Slide 2
Three Steps to Data Analysis n Analyze Results n Communicate Findings n Use Findings for Program Improvement Innovation Network, Inc. Slide 3
Keep it Simple n Aim for a systematic effort n Keep your audience in mind n Pay attention to the usability of your evaluation report Innovation Network, Inc. Slide 4
Two Kinds of Data n Quantitative n Qualitative Innovation Network, Inc. Slide 5
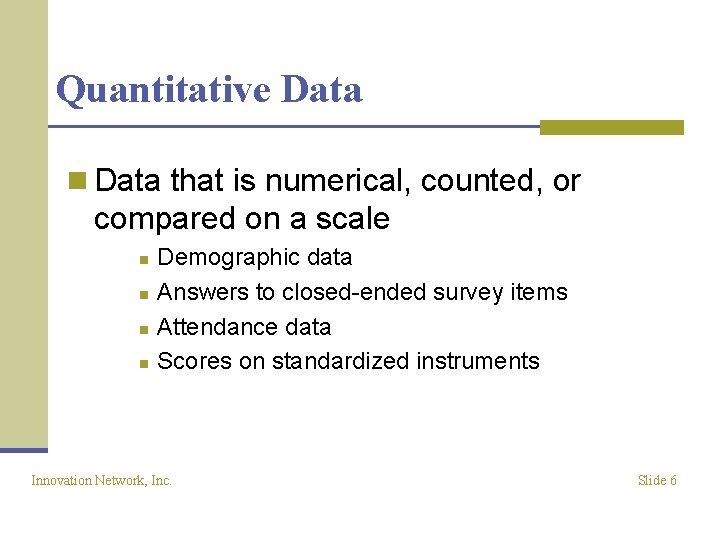
Quantitative Data n Data that is numerical, counted, or compared on a scale n n Demographic data Answers to closed-ended survey items Attendance data Scores on standardized instruments Innovation Network, Inc. Slide 6
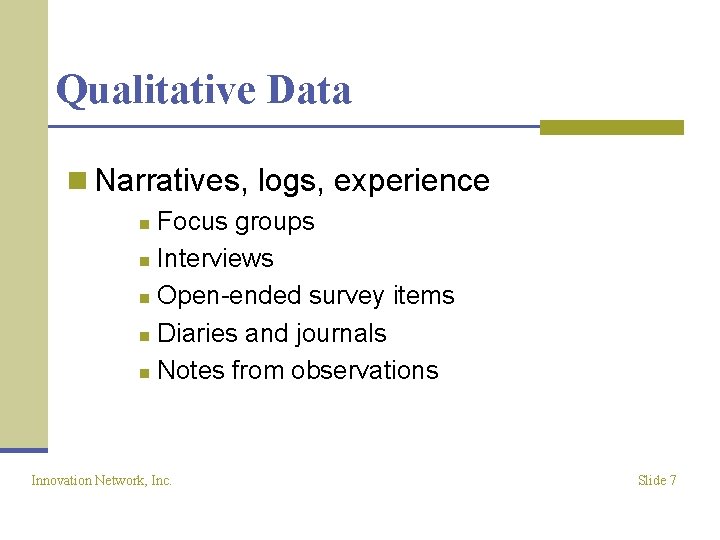
Qualitative Data n Narratives, logs, experience Focus groups n Interviews n Open-ended survey items n Diaries and journals n Notes from observations n Innovation Network, Inc. Slide 7
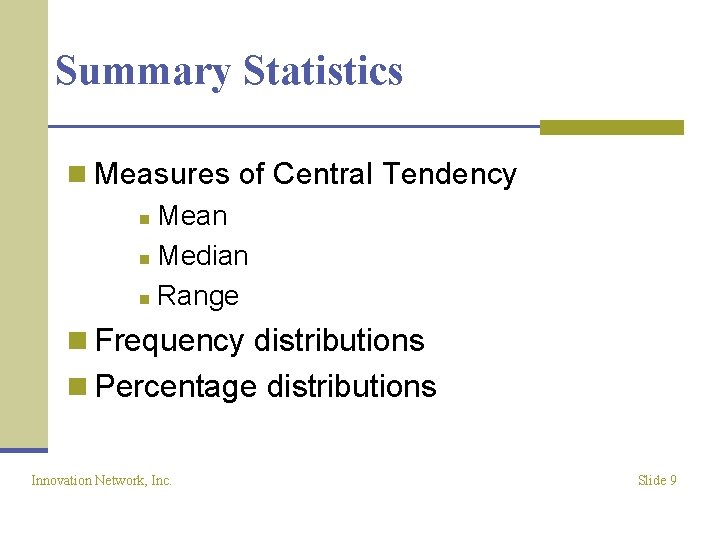
Summary Statistics n Measures of Central Tendency n Mean n Median n Range n Frequency distributions n Percentage distributions Innovation Network, Inc. Slide 9
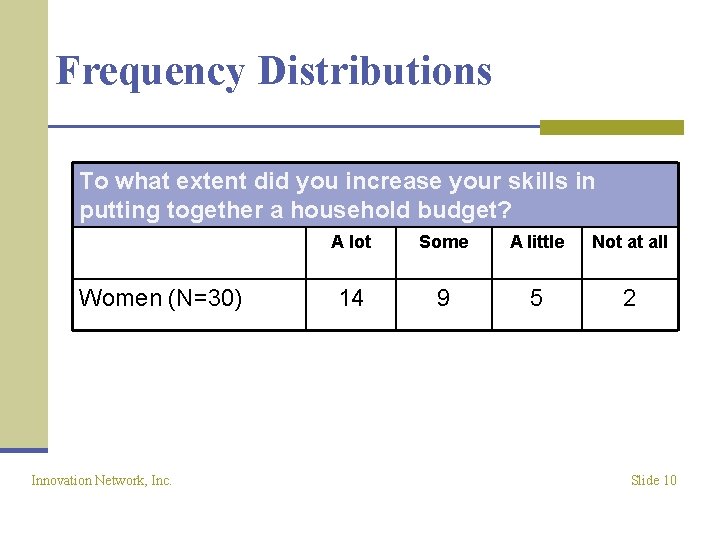
Frequency Distributions To what extent did you increase your skills in putting together a household budget? Women (N=30) Innovation Network, Inc. A lot Some A little Not at all 14 9 5 2 Slide 10
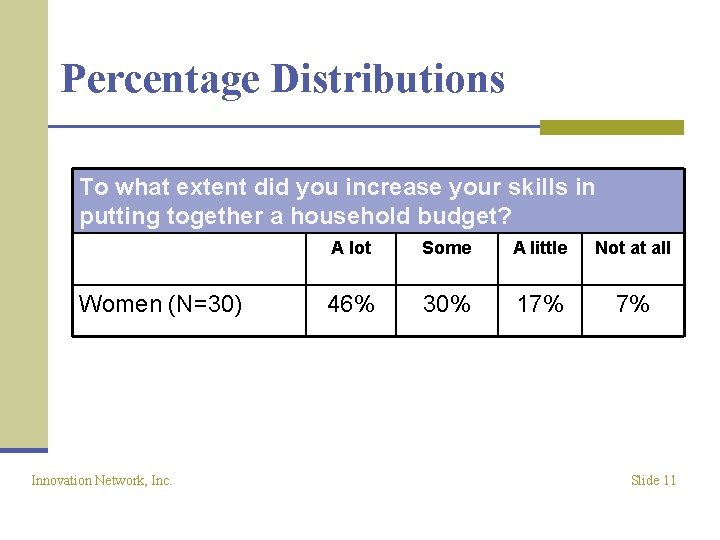
Percentage Distributions To what extent did you increase your skills in putting together a household budget? Women (N=30) Innovation Network, Inc. A lot Some A little Not at all 46% 30% 17% 7% Slide 11
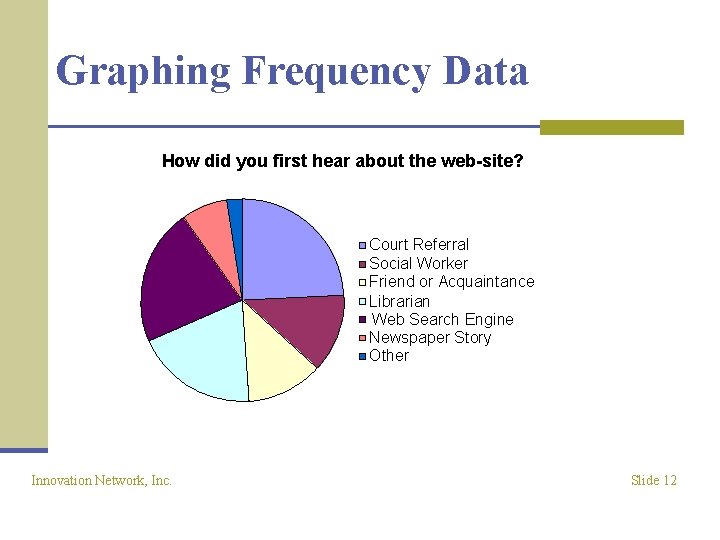
Graphing Frequency Data How did you first hear about the web-site? Court Referral Social Worker Friend or Acquaintance Librarian Web Search Engine Newspaper Story Other Innovation Network, Inc. Slide 12
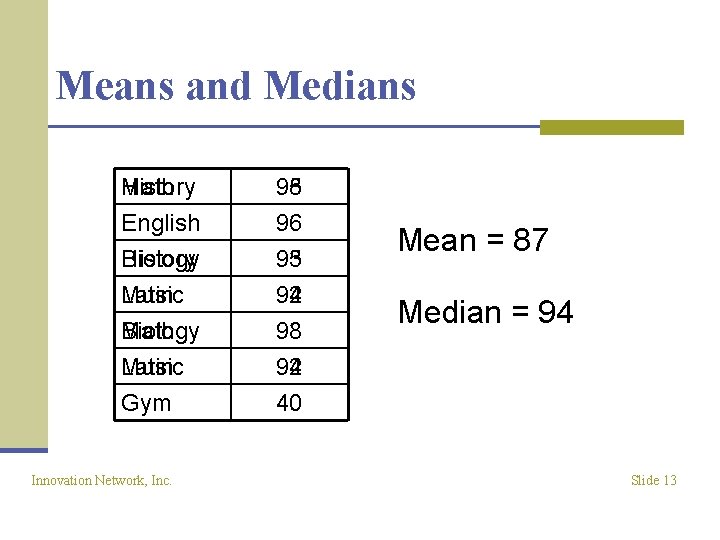
Means and Medians Math History English History Biology Music Latin 98 95 96 95 93 94 92 Biology Math Latin Music Gym 93 98 92 94 40 Innovation Network, Inc. Mean = 87 Median = 94 Slide 13
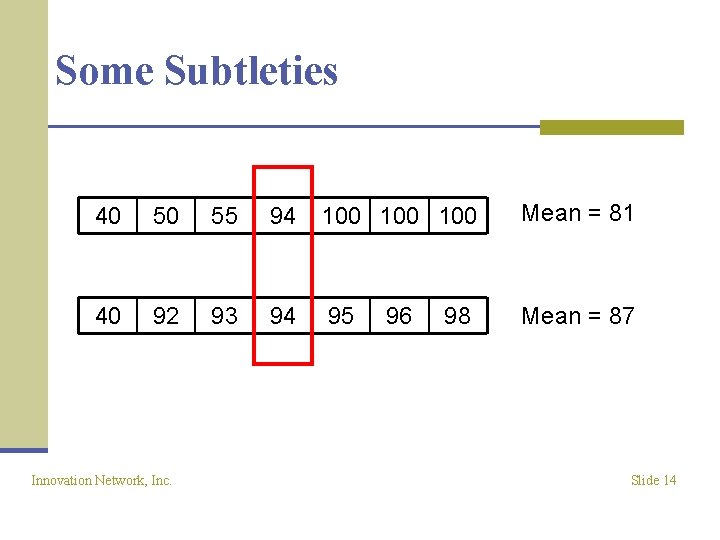
Some Subtleties 40 50 55 94 100 100 Mean = 81 40 92 93 94 95 Mean = 87 Innovation Network, Inc. 96 98 Slide 14
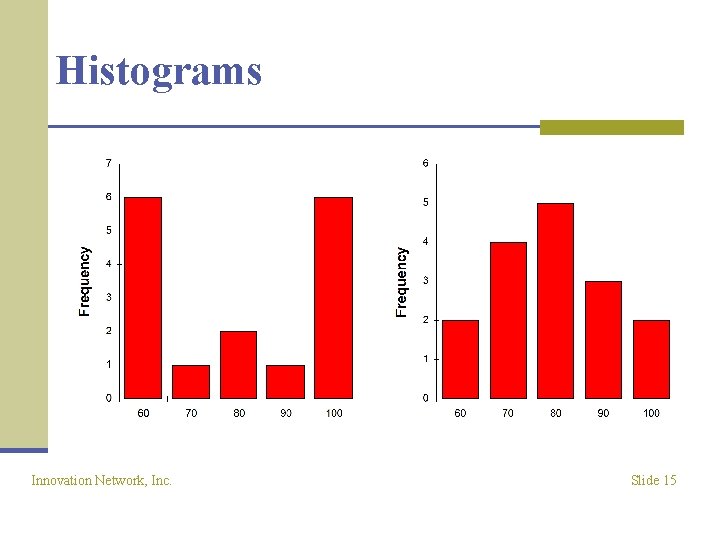
Histograms Innovation Network, Inc. Slide 15
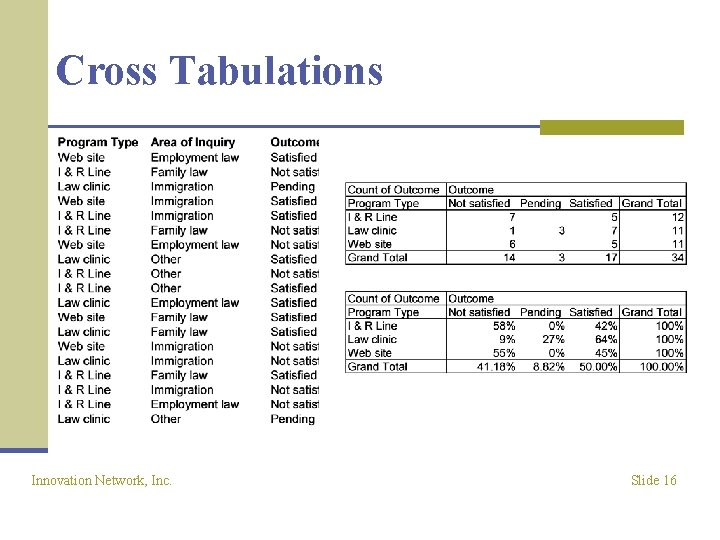
Cross Tabulations Innovation Network, Inc. Slide 16
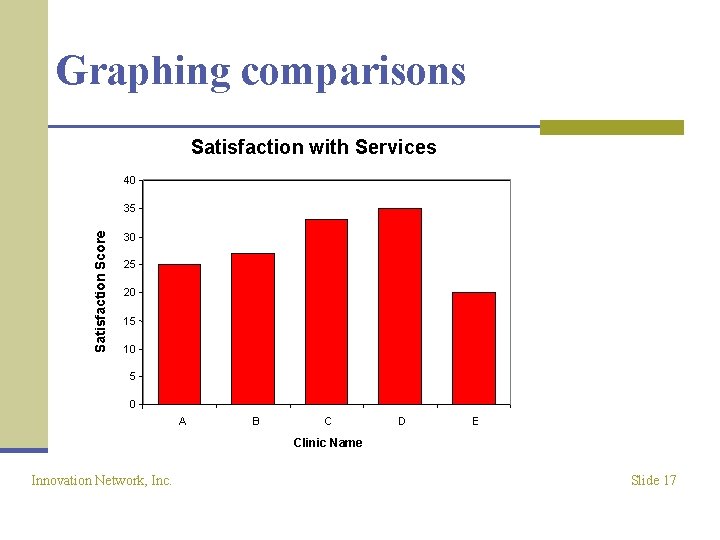
Graphing comparisons Satisfaction with Services 40 Satisfaction Score 35 30 25 20 15 10 5 0 A B C D E Clinic Name Innovation Network, Inc. Slide 17
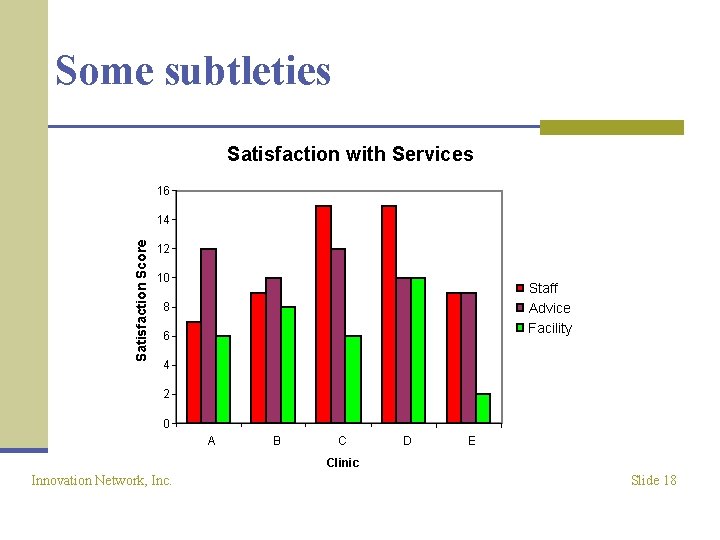
Some subtleties Satisfaction with Services 16 Satisfaction Score 14 12 10 Staff Advice Facility 8 6 4 2 0 A B C D E Clinic Innovation Network, Inc. Slide 18
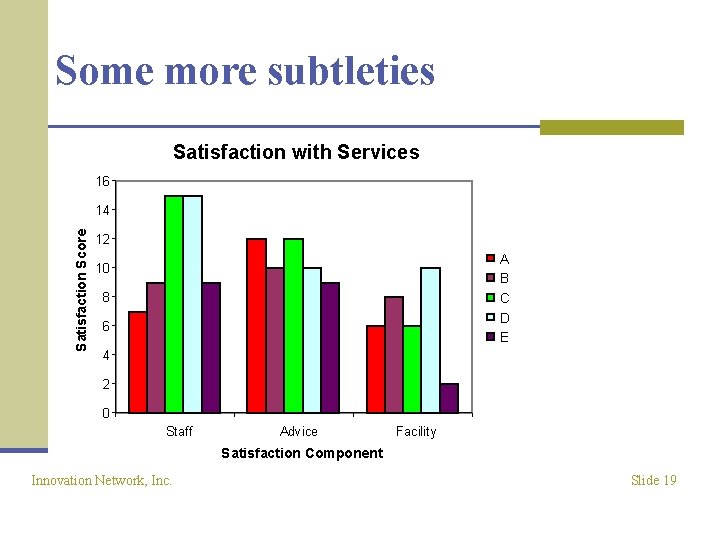
Some more subtleties Satisfaction with Services 16 Satisfaction Score 14 12 A B C D E 10 8 6 4 2 0 Staff Advice Facility Satisfaction Component Innovation Network, Inc. Slide 19
A Note on Quantitative Data Entry n Several approaches Paper and pencil tally n Word processing table n Spreadsheet n Custom database n Innovation Network, Inc. Slide 20
Qualitative Data n Textual data Interview transcripts n Case notes/ clinical notes n Open-ended survey questions n n Photographs n Video recordings Innovation Network, Inc. Slide 21
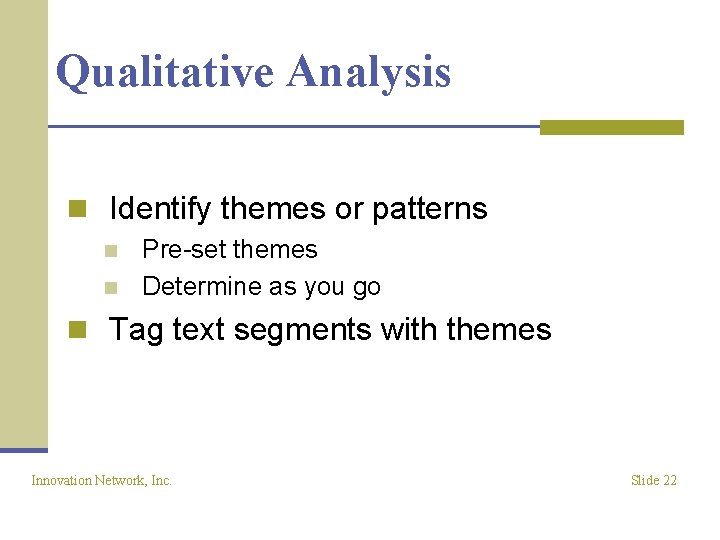
Qualitative Analysis n Identify themes or patterns n n Pre-set themes Determine as you go n Tag text segments with themes Innovation Network, Inc. Slide 22
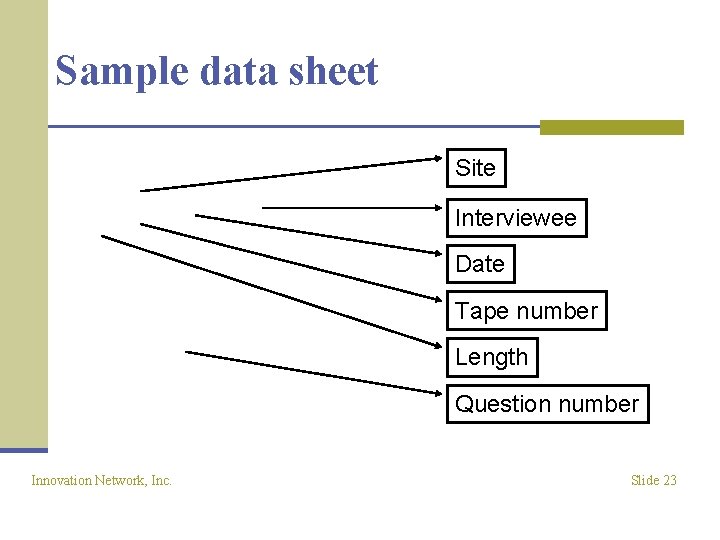
Sample data sheet Site Interviewee Date Tape number Length Question number Innovation Network, Inc. Slide 23
Exercise n Break into small groups n Using the sheet provided search for snippets of text that relate to the codes provided n Identify any other themes that may be important that are not provided on the sheet Innovation Network, Inc. Slide 24
Communicating Findings “Information that is not effectively shared with others will not be effectively used. ” Source: Building a Successful Evaluation Center for Substance Abuse Prevention Innovation Network, Inc. Slide 25
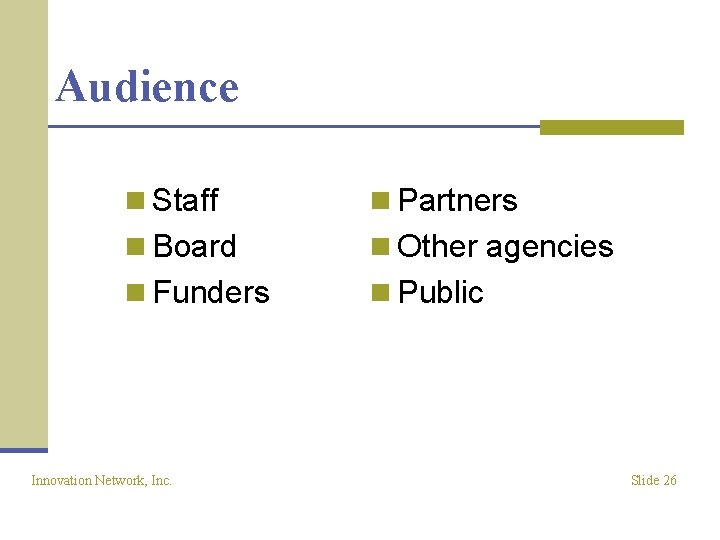
Audience n Staff n Partners n Board n Other agencies n Funders n Public Innovation Network, Inc. Slide 26
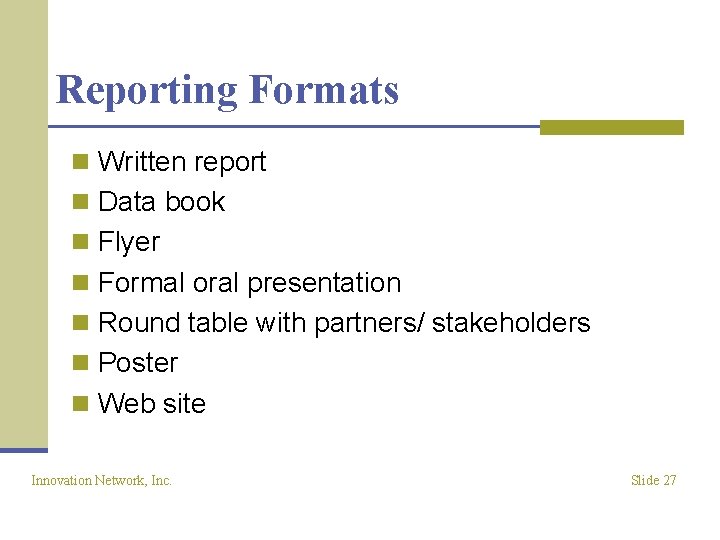
Reporting Formats n Written report n Data book n Flyer n Formal oral presentation n Round table with partners/ stakeholders n Poster n Web site Innovation Network, Inc. Slide 27
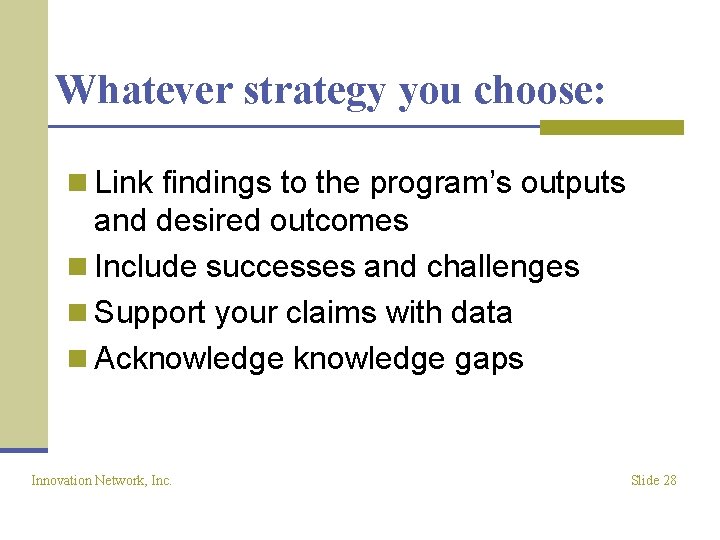
Whatever strategy you choose: n Link findings to the program’s outputs and desired outcomes n Include successes and challenges n Support your claims with data n Acknowledge gaps Innovation Network, Inc. Slide 28
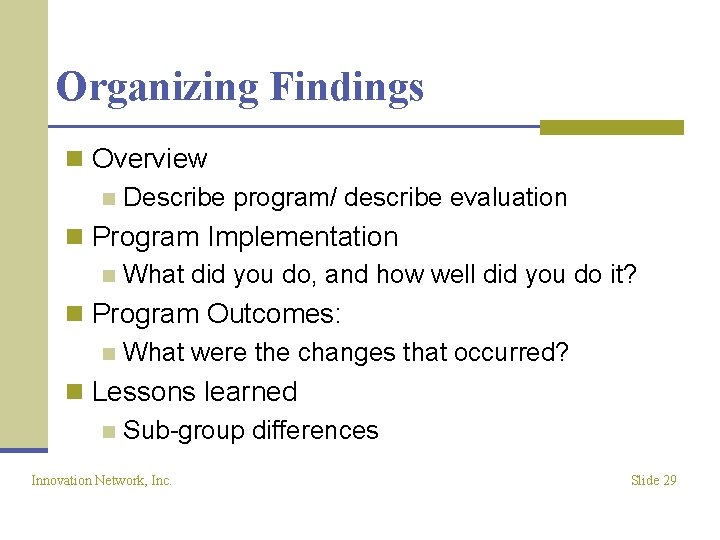
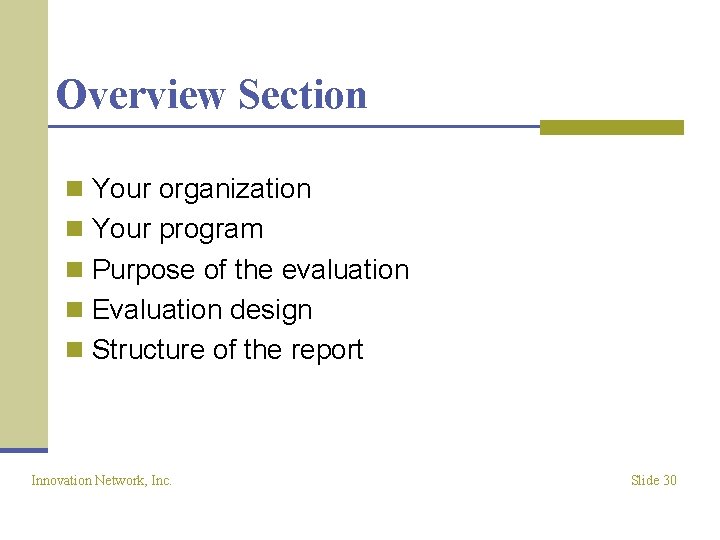
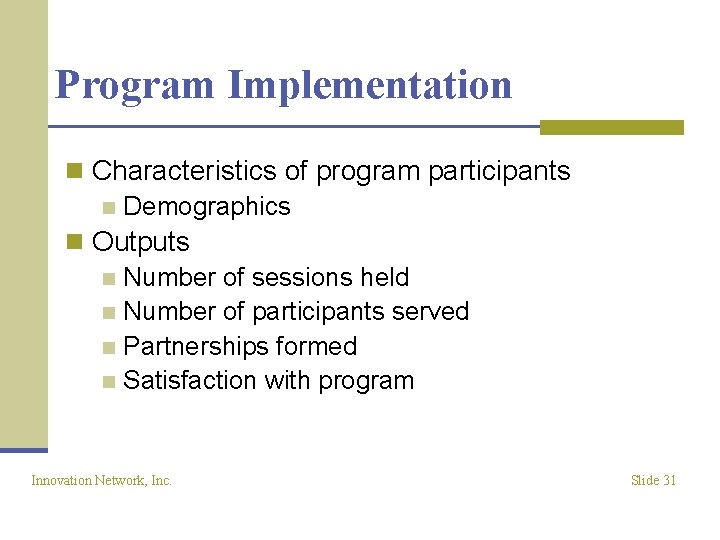
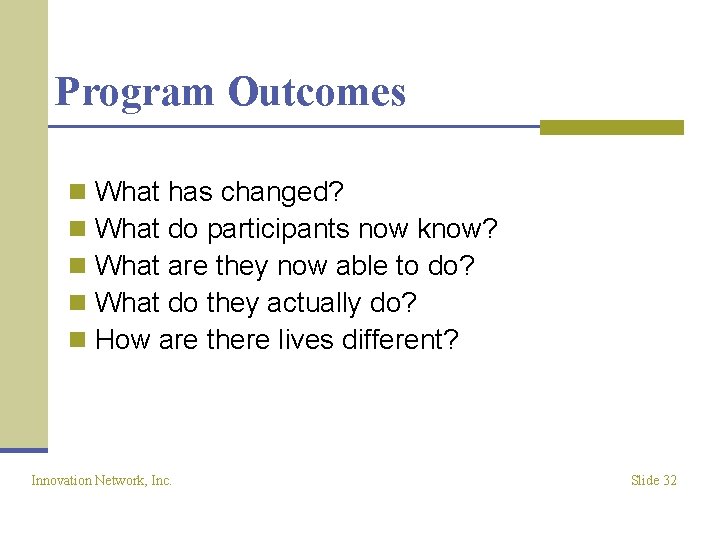
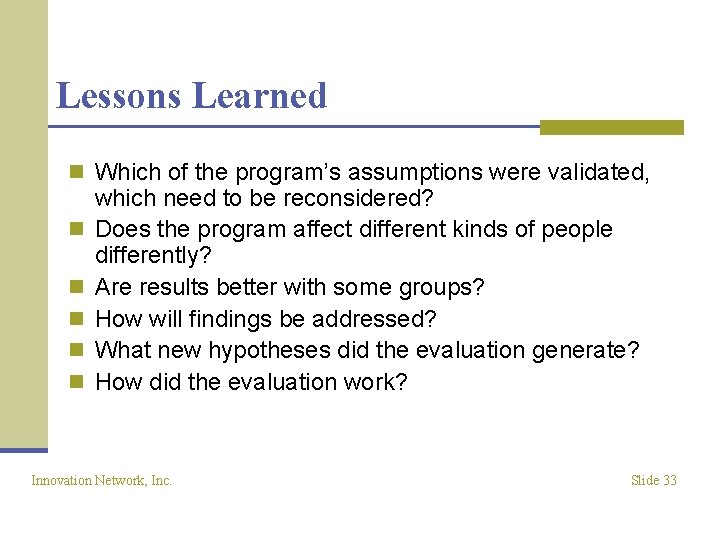
Organizing Findings n Overview n Describe program/ describe evaluation n Program Implementation n What did you do, and how well did you do it? n Program Outcomes: n What were the changes that occurred? n Lessons learned n Sub-group differences Innovation Network, Inc. Slide 29
Overview Section n Your organization n Your program n Purpose of the evaluation n Evaluation design n Structure of the report Innovation Network, Inc. Slide 30
Program Implementation n Characteristics of program participants n Demographics n Outputs n Number of sessions held n Number of participants served n Partnerships formed n Satisfaction with program Innovation Network, Inc. Slide 31
Program Outcomes n n n What has changed? What do participants now know? What are they now able to do? What do they actually do? How are there lives different? Innovation Network, Inc. Slide 32
Lessons Learned n Which of the program’s assumptions were validated, n n n which need to be reconsidered? Does the program affect different kinds of people differently? Are results better with some groups? How will findings be addressed? What new hypotheses did the evaluation generate? How did the evaluation work? Innovation Network, Inc. Slide 33
Additional Resources n One-on-one technical assistance n Synchronous course n Asynchronous material n Inno. Net website www. innonet. org Innovation Network, Inc. Slide 34