Multivariate Ranking Prioritization and Selection Using Partial Order


![Preliminaries • Data Matrix : Multivariate Data Set • Indicator Data Matrix: [xij]: n](https://slidetodoc.com/presentation_image_h2/3b6d040a4d1f57a68a55a7b6f5b7c689/image-7.jpg "Preliminaries • Data Matrix : Multivariate Data Set • Indicator Data Matrix: [xij]: n")


=(O(x)-")


- Slides: 42
Multivariate Ranking, Prioritization, and Selection Using Partial Order for Comparative Knowledge Discovery in Multi-Indicator Information Fusion Systems with Multi. Disciplinary Applications: Past, Present, and Future • 2015 Florida Chapter Meeting of ASA • Inaugural Keynote Speaker • G P Patil
1. 2. 2
3
Logo for Statistics, Environment, Health, Ecology, and Society 4
NSF Digital Government surveillance geoinformatics project, federal agency partnership and national international applications for digital governance. Federal Agency Partnership Homeland Disaster Security Management Public Health Ecosystem Other Case Health Studies Survellance Geoinformaticsof Statistical Processing: Hotspot Detection, Prioritization, etc. Hotspot Detection, Prioritization and Early Warning NSF Digital Government Project #0307010 CDC DOD EPA NASA NIH NOAA USFS USGS UNEP Arbitrary Data Model, Data Format, Data Access Application Specific De Facto Data/Information Standard or De Facto Data Model, Data Format, Data Access PI: G. P. Patil gpp@stat. psu. edu National and International Applications Data Sharing, Interoperable Middleware • Biosurveillance • Carbon Agency Databases Thematic Databases Other Databases Cellular Surface Management • Coastal Management • Community Infrastructure • Crop Surveillance • Disaster Management • Disease Surveillance • Ecosystem Health • Environmental Justice • Environmental Management • Environmental Policy • Human Environment Index • Homeland Security • Invasive Species • Poverty Policy • Public Health and Environment • Robotic Networks • Sensor Networks • Social Networks • Syndromic Surveillance • Tsunami Inundation • Urban Crime • Water Management Websites: http: //www. stat. psu. edu/~gpp/ http: //www. stat. psu. edu/hotspots/ http: //www. stat. psu. edu/%7 Egpp/DGOnline. News 2006. mht 5
Prioritization Innovation Partial Order Set Ranking We present a prioritization innovation. It lies in the ability for ranking and prioritization of objects and indicators based on intrinsic multiple indicator structural characteristics without having to integrate indicators into an index, using partial order sets and related novel concepts, methods, and tools. This leads us to early warning systems, and also to the selection of investigational entities, and investigational indicators. 6
Preliminaries • Data Matrix : Multivariate Data Set • Indicator Data Matrix: [xij]: n rows/objects: a 1…an: m columns/indicators: I 1…Im. Objects may be entities, such as, individuals, units, pixels, areas, regions, patients, genes, drugs, documents, clients, products, tools with relevant characteristics as potential indicators for some single or multiple outcomes, endpoints, concepts, domains. • m-dimensional data set consisting of n data points: no measurement column available on response variable y. • To begin with, latent( abstract) concept for the objects with indicative indicator values/ measurements with common orientation.
• As a simple example, consider size of an individual as the abstract concept. Consider height, weight, volume of the individual as indicators of size with assumed common orientation of positive monotonicity/ positive correlations. Generally speaking, larger the size, larger the indicator; larger the indicator, larger the size. • The three indicators/ indicator measurements may have threedimensional elliptical distributon with pairwise positive correlations.
• The multivariate data set is usually a nonlinear partially ordered set. Not all pairs of objects are comparable. For a two indicator set up: • Figures: • Ranking usually amounts to linearizing the poset by ranking the objects with appropriate scalar rank-scores consistent with the comparability in the data matrix. Rank-scores need to inherit the comparabilities in the data set. Incomparable pairs are expected to become comparable in either direction.
• On which line is the linearized set to lie? Without loss of generality, on which axis passing thru the origin? In which manner of separations between successive objects? Projections on a ray thru the origin have been popular. The ray is determined by w= ( w 1, …, wm ), where wj>0, with summation of wj being unity, a differential weight vector, measuring relative importance of indicators for the abstract concept. Projection is a fixed scalar multiple of what is popularly called weighted composite index with weight vector w.
• Choice of w involves subjective trade off/ compensation among indicators. It becomes a sensitive issue between stakeholders. Reconciliation in view of data matrix evidence becomes a practical challenge and scientific/ statistical opportunity. • Can we think of a data based w intrinsic to the data matrix? And relative to such a w, and its corresponding ray, can we think of alternative ways of computing appropriate rank-scores, which do not involve indicator trade offs? And if we can think of several methods of rank-scores and resultant rankings, is it possible to measure their individual performance to help find a best method among them for the given data set? Interestingly, all of these questions are frontier questions that we should wish to address. And fortunately, we now have some initial answers that we wish to share on the challenging issues of multivariate ranking over the past several decades.
• Intrinsic Differential Weight Vector w. I for the Data Matrix based Indicator Set, Measuring Relative Importance of Indcators. • Method 1: L 0 -distance: Pairwise Object Comparisons, and Indicator Agreements among Object Comparison Disagreements. • Method 2: L 1 -distance: Pairwise Indicator Ranking Comparisons. • Method 3: L 2 -distance: Pairwise Indicator Ranking Comparisons.
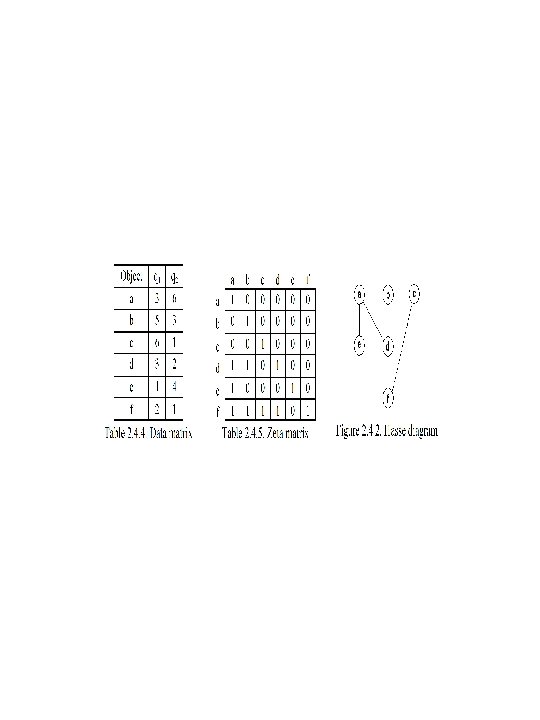
• Method 1: Consider Multivariate Zeta Matrix: nxn. Object x Object Comparability Matrix. Cell Entry: m-variate bit, binary digit: 111…, 000…, 101100… 01, where 1 if ai > aj, and 0, otherwise. • Comparability cell has all 1’s, or, all 0’s in its bit, indicating collective agreement among indicators. • Incomparability cell has some 1’s and some 0’s in its bit, indicating collective disagreement among indicators. • For each incomparability cell, count for each indicator the number of agreements with the collectivity of indicators. Add up for each indicator over all of the incomparability cells. Normalize/ unitize to give the intrinsic w. I we are looking for. • Incidentally, and importantly, this intrinsic w. I also provides a powerful basis for comparison and selection of indicators. • Method 2 and Method 3: Will come back, if time permits.
• Conceptualizing and Computing Performance Measure of a Comparability Invariant Partial Order Ranking Method: • Consider Multivariate Zeta Matrix as before: But, this time, Cell entry: ( m+1 ) -variate bit with the first m variates as before, and the ( m+1 )-th variate corresponding to the Ranking. • For each incomparability cell, count for each indicator the agreement with the Ranking. Add up for each indicator over all the incomparability cells. • Normalize/ unitize to give the w. R induced by the Ranking R. • Define its performance measure PMR by corr/ gen. corr ( w. I, w. R).
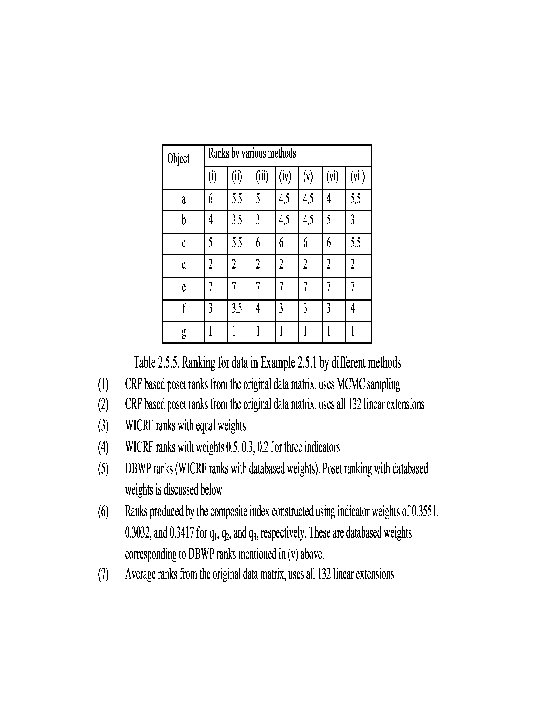
• Some Comparability Invariant/ Partial Order based Ranking Methods: • Method 1: Weighted Composite Index for Rank-score: WCI. • Method 2: Comparability Weighted Net Superiority Index for Rankscore: CWNSI. • Method 3: MCMC based Weighted indicator Average Rank for Rankscore: WIARI. • Method 4: MCMC based Weighted indicator Cumulative Rank Frequency Distribution for Stochastic Rank-score: WICRFDI.
Method 1: Weighted Composite Index for Rankscore • Existence of intrinsic differential weight vector w and the correspondingly weighted composite index • w. x = |w| |x| cos(w, x) = |w| x projection of x on w. • w. d = 0, w. d > 0, w. d < 0 where d = x 1 – x 2 16
An illustration with two indicator space
Method 2: Comparability Weighted Net Superiority Index for Rank-score • Rank-score ( x )=(O(x)- F(x))(O(x)+ F(x) )/ (n-1) = Net Superiority x Comparability • Figure:
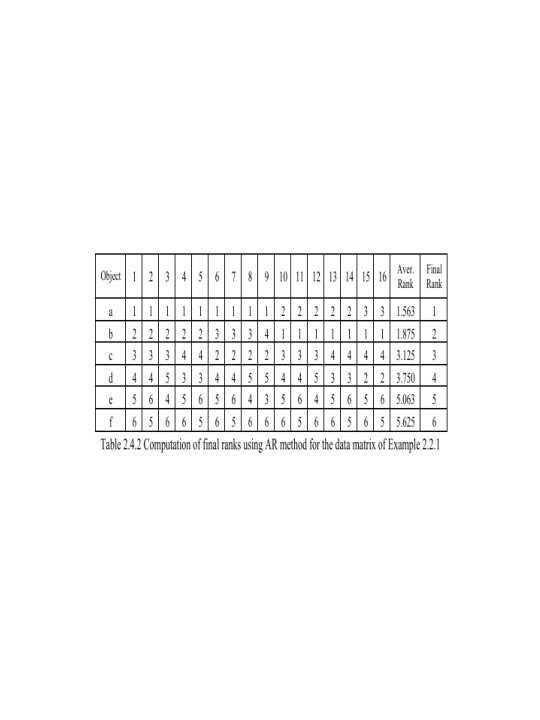
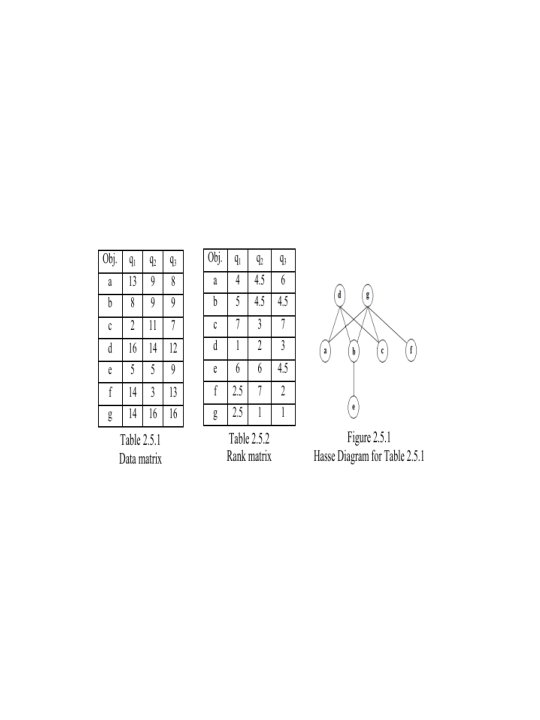
Method 3: MCMC based Weighted Indicator Average Rank for Rank-score
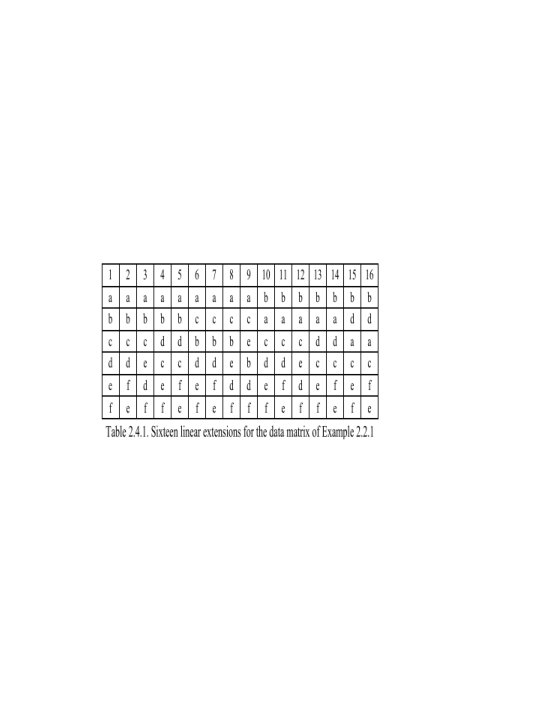
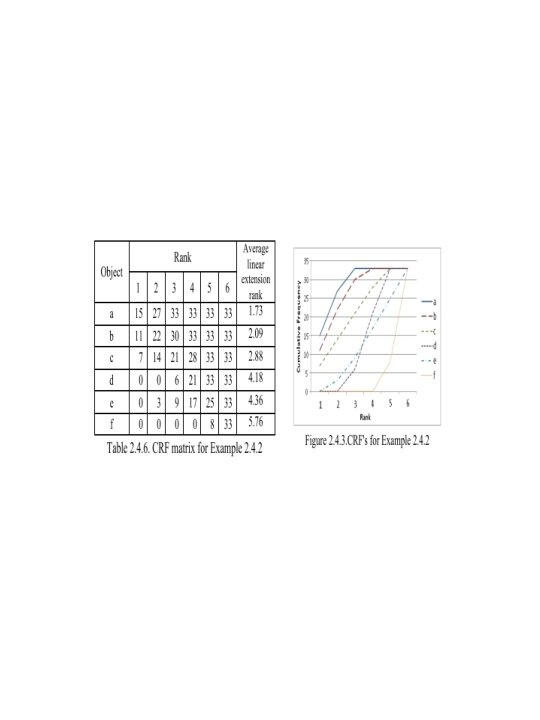
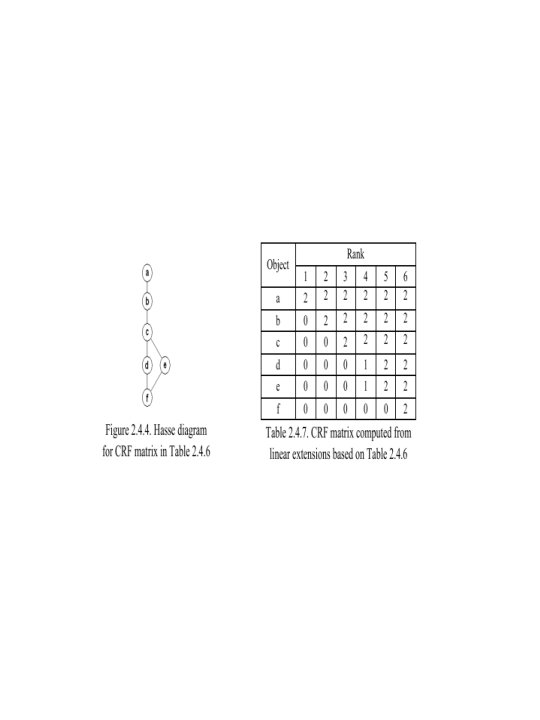
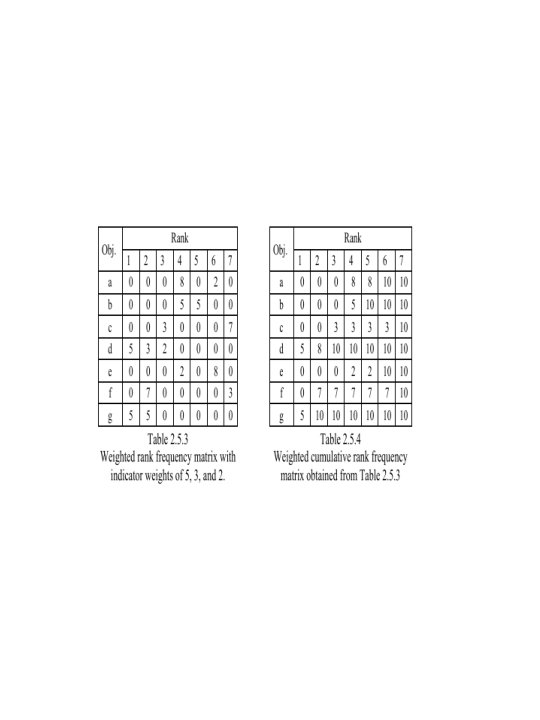
Method 4: MCMC based Weighted Indicator Cumulative Rank Frequency Distribution for Stochastic Rank-score
Multivariate Non. Parametrics with Partial Order: Multivariate Ranking With Multivariate Data Set as Data Matrix: [xij], n x m, Columns as variables, and not known necessarily as indicators with common orientation.
Consider 2 m transforms of the Data Matrix with columns retained or reversed. Transform ID given by m-dimensional bit, 0011011001… 01, 0 to mean retain, and 1 to mean reverse. Multivariate Median: For each transform, compute CWNSI to provide a triplet of its median object and an object immediately above and below in rank.
Consider the object frequency distribution over the 3 x 2 m objects thus centrally discovered. Declare the modal object of this frequency distribution to be the multivariate median estimate we are looking for. It is possible to have several maximal modes, in which case, their centroid may be declared as the estimate.
Alternatively, allocate minimum rank to each object from within m its 2 CWNSI rank values from m the 2 transforms. Call this minimum rank its data depth. Maximum data depth wi then yield the multivariate median estimate. It is possible to have several objects with maximum data depth. The centroid will play the role. We conjecture approximate affine
Multivariate Order Statistics relative to the Multivariate Median Construct n x m data matrix of co-ordinates-wise/ columns-wise separation of each object from the estimated multivariate median. Consider the 2 m transforms, yielding 2 m rank values for each object.
Choose now the maximum rank, and all it the outlyingness measure o he object, giving the rank-score for the rank for it as a multivariate order statistic. Appropriately weighted linear combinations of these multivariate order statistics wil help improve and sharpen the multivariate median. Iterative moving windows on grids will
Some Applications: Genome Wide Association Studies: Knut Wittkowski Eli Lilly Debashis Ghosh Human Environment Inter. Face Ashbindu Singh Myers and Patil Bruggemann and Patil Several Applications and References Four Current Monographs
2011. Ranking and Prioritization for Multi-indicator Systems Introduction to Partial Order Applications. Springer, New York. p 328. Bruggemann, R. , Carlson, L. and J. Wittman Eds 2014. Multiindicator Systems and Modeling in Partial Order. Springer, New York. p 437. Chiang, A. Y. , G. Li, Y. Ding, and M. D. Wang. 2008. A multivariate ranking procedure to assess treatment effects. Technical Report, Eli Lilly and Company , Indianapolis, IN Diaconis, P. and R. L. Graham. 1977. Spearman’s footrule as a measure of disarray. JRSS B 39 262 -268. Donoho, D. L. and Gasko, M. (1992). Breakdown properties of location estimates based on halfspace depth and projected outlyingness. Annals of Statistics 20 1803– 1827. Liu, R. Y. , R. Serfling, and D. L. Souvaine. Eds. 2006. Data Depth: Robust Multivariate Analysis, Computational Geometry and Applications (Dimacs Series in Discrete Mathematics and Theoretical Computer Science)
Collective Criteria and Sequenced Sets. Springer, New York. p 297. Myers, W. L. and G. P. Patil. 2013. Statistical Geoinformatics for Human Environment Interface. CRC/ Chapman & Hall, New York. p 305. Patil, G. P. 2012. Keynote Lecture on Partial Orders and Composite Indicators for Multivariate Ranking in Multivariate Nonparametric Statistics at the International Workshop on Partial Order Theory and Modeling held in Berlin, Germany. Patil, G. P. and C. Taillie. 2004. Multiple indicators, partially ordered sets, and linear extensions: Multi-criterion ranking and prioritization. Environmental and Ecological Statistics 11: 199228. Patil, G. P. 2011. Inaugural Keynote Address, UNEP Panel Workshop on Sustainability Indicators, New Delhi, India. Patil, G. P. 2012. Plenary Lecture, UNEP Panel Workshop on Green Economy Indicators, Beijing, China. Patil, G. P. 2012. Invited Lecture on comparative knowledge discovery with partial order and composite indicators ln multi-indicator