MATLAB 2009 5 Matlab 4 Matlab Current Directory

MATLAB 语言简介 2009年 5月

Matlab 的安装 4
 作空间 (Workspace) 历史指令窗 (Command History) 命令窗口 (Command Window) 5")
Matlab的启动 当前目录 (Current Directory) 作空间 (Workspace) 历史指令窗 (Command History) 命令窗口 (Command Window) 5

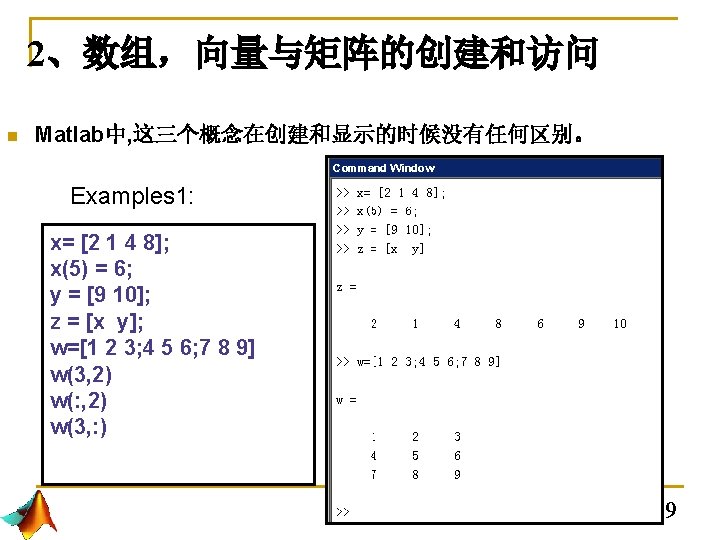
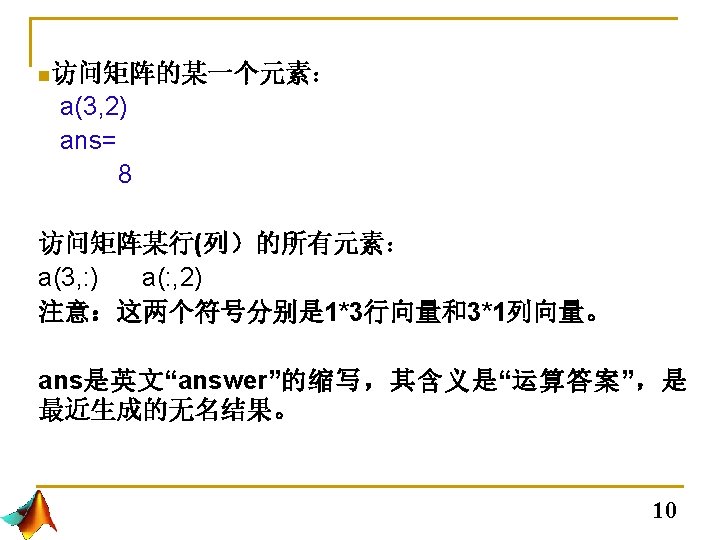
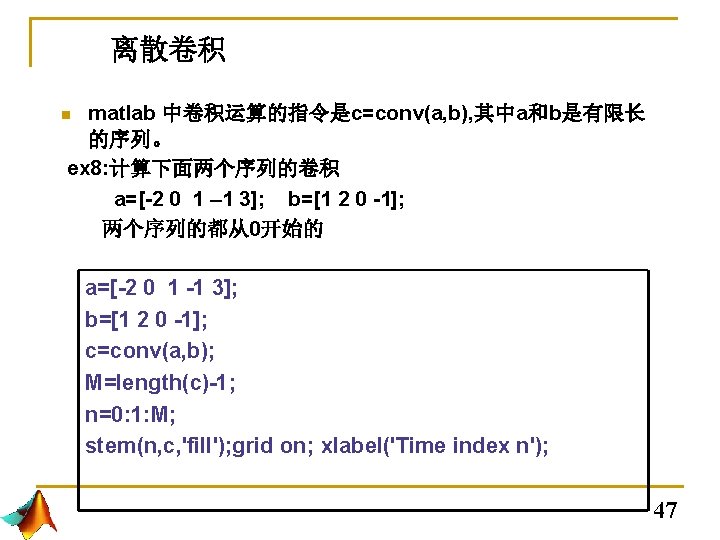
8
; y=cos(n); plot(n, x, ‘:")
n Example clear; %清除 作空间中所保存的变量 n=0: 0. 1: 2*pi; x=sin(n); y=cos(n); plot(n, x, ‘: b’, n, y, ‘ro’); grid on; legend(‘sine wave’, ‘cos wave’) %图例说明 28
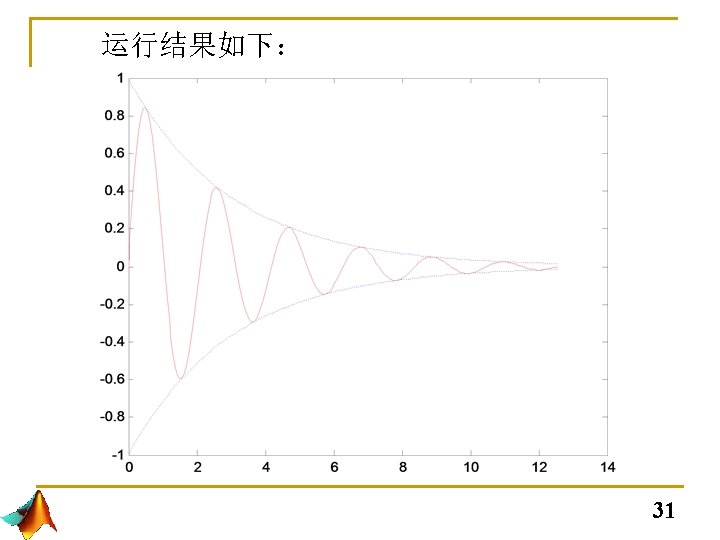
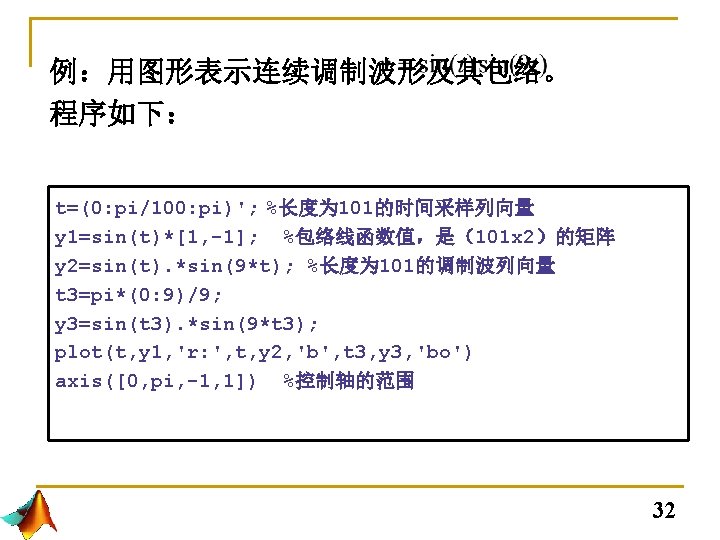
; subplot(2, 1, 1); % 创建子图,一个图形窗口中有2× 1幅子图 plot(t, y);")
Example: t=1: 0. 5: 50; y=sin(t); subplot(2, 1, 1); % 创建子图,一个图形窗口中有2× 1幅子图 plot(t, y); title('sine wave') subplot(2, 1, 2); plot(t, abs(y), 'r'); title('abs sine wave') 29

33

37
 t=-6: 0. 01: 6; plot(t, sign(t)); axis([-6, 6, -1. 2,")
n ex 3. 产生符号信号sgn(t) t=-6: 0. 01: 6; plot(t, sign(t)); axis([-6, 6, -1. 2, 1. 2]); 39
=0. 5+0. 5 sgn(t) t=-6: 0. 01: 8; plot(t, 0. 5+0.")
n ex 4. 产生单位阶跃信号u(t)=0. 5+0. 5 sgn(t) t=-6: 0. 01: 8; plot(t, 0. 5+0. 5*sign(t)); axis([-6, 8, -0. 12, 1. 2]); 40
:用sinc(x)命令 N=1000; t=-20: 20/N: 20; x=sinc(t/pi); plot(t, x); grid on axis([-20, -0.")
ex 5 取样函数Sa(t):用sinc(x)命令 N=1000; t=-20: 20/N: 20; x=sinc(t/pi); plot(t, x); grid on axis([-20, -0. 3, 1. 2]); 41

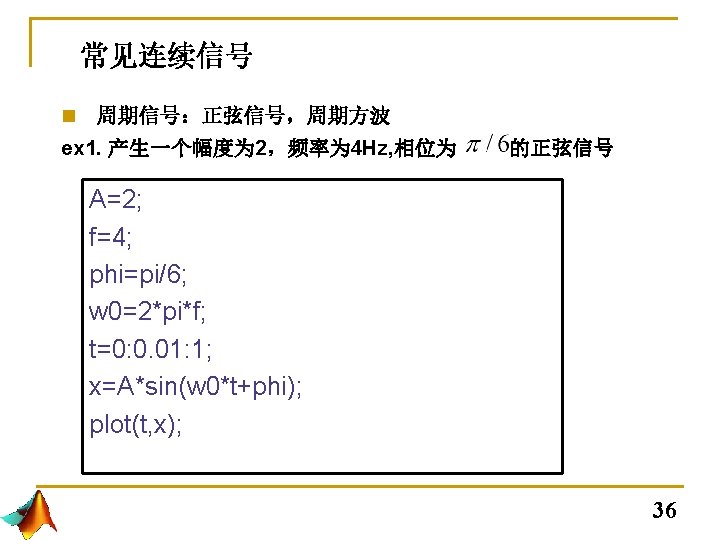
4. 2离散信号 n 周期序列 ex 6 产生一个幅度为 2,频率为 4 Hz, 相位为 的正弦信号 A=2; phi=pi/6; omega=2*pi/12; n=-10: 10; x=A*sin(omega*n+phi); stem(n, x, 'fill'); grid on; 43

44
![ex 7 产生单位脉冲序列 和单位阶跃序列u[n-3] n=-2: 30; x=[zeros(1, 5), 1, zeros(1, 27)]; y=[zeros(1, 5), ones(1,](http://slidetodoc.com/presentation_image_h2/906f64be9a2da15b2444569bc6afe3ad/image-46.jpg "ex 7 产生单位脉冲序列 和单位阶跃序列u[n-3] n=-2: 30; x=[zeros(1, 5), 1, zeros(1, 27)]; y=[zeros(1, 5), ones(1,")
ex 7 产生单位脉冲序列 和单位阶跃序列u[n-3] n=-2: 30; x=[zeros(1, 5), 1, zeros(1, 27)]; y=[zeros(1, 5), ones(1, 28)]; subplot(2, 1, 1); stem(n, x , 'fill'); grid on; subplot(2, 1, 2) stem(n, y, 'fill'); grid on; 46

48
- Slides: 48