List the causes and clinical implications of various


 and prolonged")


 • Hypercalcemia • Hyperkalemia")


- Slides: 54
• List the causes and clinical implications of various electrolyte abnormalities • Describe ECG changes in potassium and calcium
Hypokalemia • Serum level below 3. 5– 5. 0 m. Eq/L • Caused by vomiting, diarrhea, diuretics, gastric suctioning , Hypomagnesemia • Muscle weakness, polyuria • Digitalis can take advantage and cause Torsades de pointes
Hypokalemia • ECG Changes – ST segment depression – T waves flatten or join U waves – U waves get larger than Ts – QT interval appears to lengthen – PR interval increases
Hypokalemia
Hypokalemia: Flat T with K~3 ST depression with prominent T (actually U) and prolonged QT when K<2. 5 -3
Hyperkalemia • Most common cause is renal failure • Sinus node can quit at 7. 5 m. Eq/L • VF or asystole at 10– 12 m. Eq/L
Hyperkalemia: T wave in hyperkalemia is typically tall and narrow, but does not have to be tall (may be just narrow and peaked pulling ST segment).
Hyperkalemia Tall T waves with a narrow base QRS widens
• Sin e waves in severe cases
Calcium • Hypercalcemia: Short QT interval • Hypocalcemia: Prolonged QT interval
Hypocalcemia: Long QT that is due to a long ST segment, which is different from long QT due to congenital long QT syndrome, drugs, or hypokalemia. T wave is not wide, there is no T wave abnormality.
Hypercalcemia: short QTc <390 ms. No significant ST or T wave abnormality
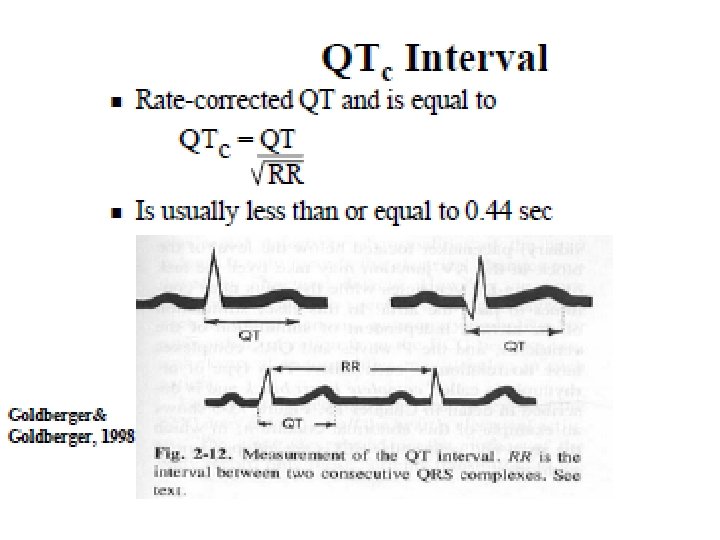
The QT Interval • Measured from the start of the QRS complex to the end of the T wave • Measures the total ventricular activity: “refractory time” • QTc is corrected for rate
139 The QT/QTc Table
• • Prolonged QT Etiologies • Familial long QT Syndrome • Congestive Heart Failure • Myocardial Infarction • Hypocalcemia • Hypomagnesemia • Type I Antiarrhythmic drugs • Myocarditis
• • Shortened QT Etiologies • Digoxin (Digitalis) • Hypercalcemia • Hyperkalemia
• Hypomagnesemia is not associated with characteristic or specific ECG findings • It is associated with a non-specific prolongation of QT and/or QRS intervals, and is often associated with hypokalemia and hypocalcemia. Therefore, changes related to the latter 2 abnormalities may be seen.
Pathologic Q Waves I 28
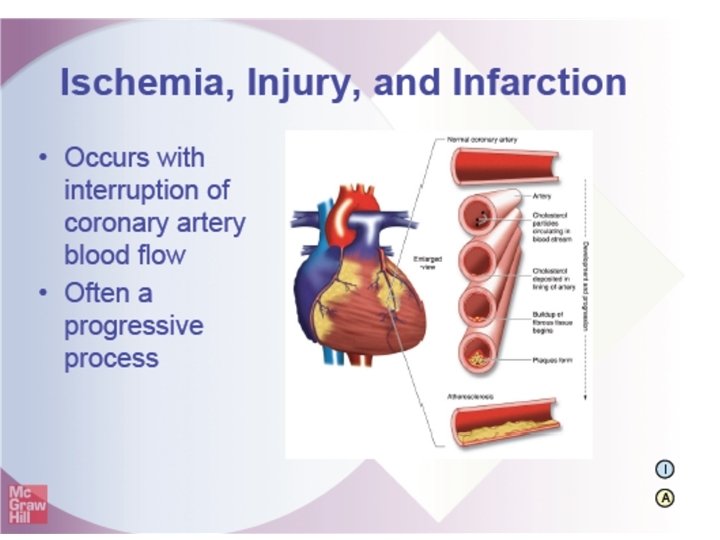
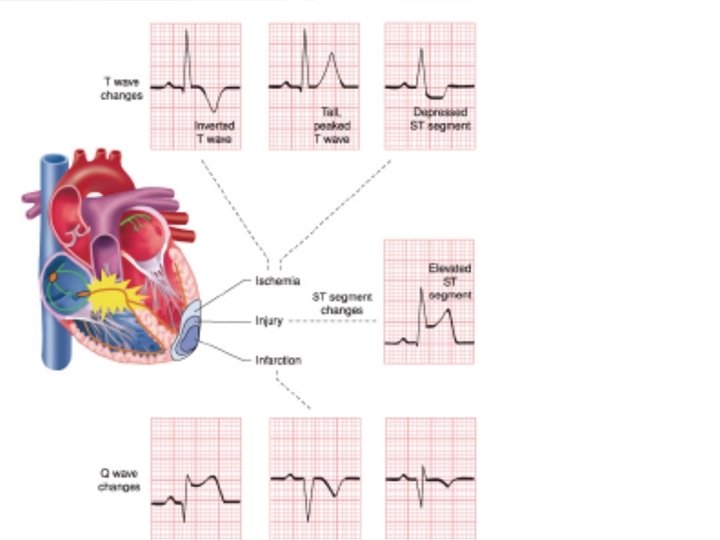
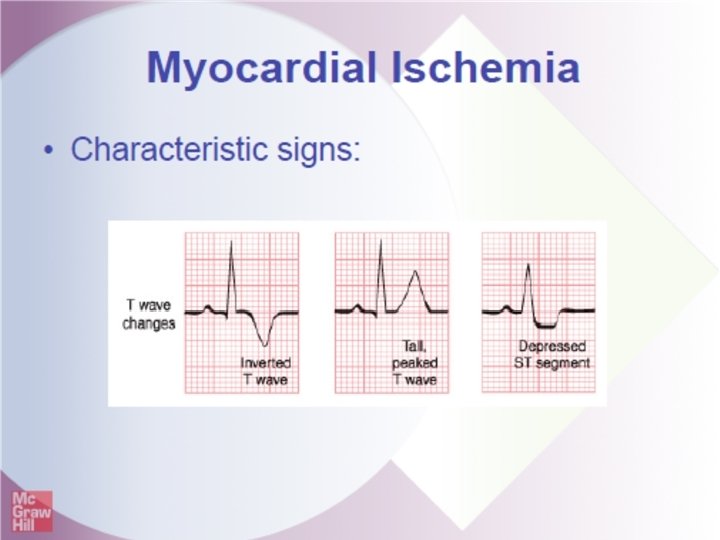
Progression of Myocardial Infarction • During MI the ECG often evolves through three stages: – Ischemia – Injury – Infarction 29
Identification of MI • Reciprocal changes seen on 12 lead ECG may assist with distinguishing between MI and conditions that mimic it 30
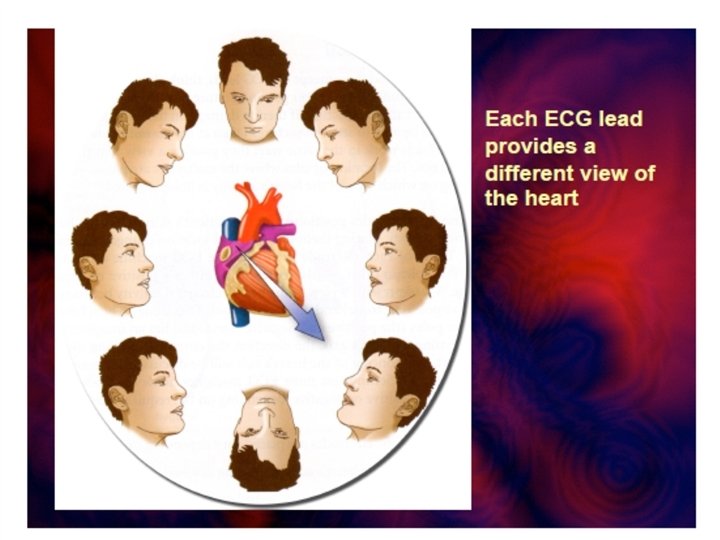
View of Inferior Heart Wall • Leads II, III, a. VF - Looks at inferior heart wall -Looks from the left leg up
View of Lateral Heart Wall • Leads I and a. VL – Looks at lateral heart wall – Looks from the left arm toward heart *Sometimes known as High Lateral*
View of Lateral Heart Wall • Leads V 5 & V 6 – Looks at lateral heart wall – Looks from the left lateral chest toward heart
View of Anterior Heart Wall • Leads V 3, V 4 – Looks at anterior heart wall – Looks from the left anterior chest
View of Septal Heart Wall • Leads V 1, V 2 - Looks at septal heart wall - Looks along sternal borders
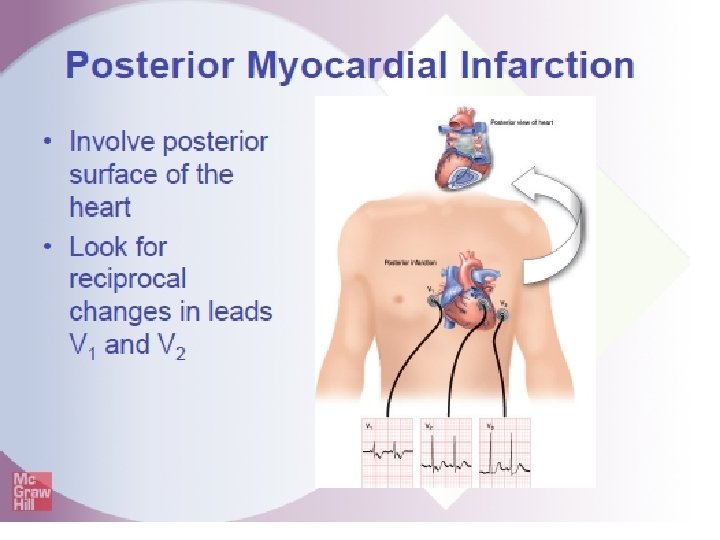
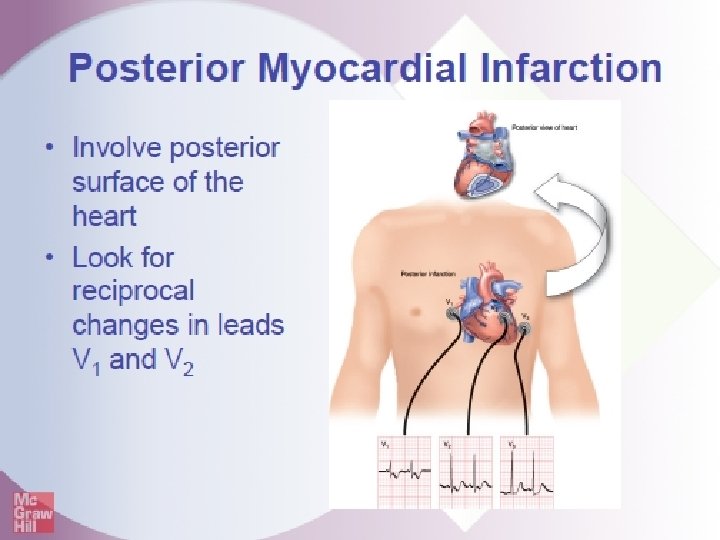
Posterior Ischemia, Injury, Infarction • Can be identified through leads V 7, V 8 and V 9 38
Right Ventricular Ischemia, Injury, Infarction • Can be identified using leads V 3 R, V 4 R, V 5 R, V 6 R 39
Right Ventricular MI
Anterior MI
Reciprocal ST segment depression Acute ST segment elevation
Pericarditis
Pericarditis • Signs and Symptoms – Chest pain, dyspnea, tachycardia, fever, weakness, chills – Chest pain sharp, radiating to back, neck, jaw – Made worse by lying flat, twisting – Made better by leaning forward
Pericarditis • Often pleuritic pain, worse on inhalation • Pain can last for hours or days • Pericardial friction rub – Heard over left lower sternal border
Pericarditis ECG Criteria • ST segment elevation • Concave in all leads • T wave elevation • PR depression
Pericarditis
Pericarditis: Diagnosis
Early Repolarization
ECG Criteria: APE • Deep S in Lead I • Abnormal Q in Lead III • Inverted T in Lead III
140 The Digitalis Effect • • 60% of those on “Dig” have it ST segment depression Scooped out appearance Best seen in inferior/lateral leads
Questions