Leveraging and Understanding Performance Data and Graphs Troy






- Slides: 58

Leveraging and Understanding Performance Data and Graphs Troy Lea troy@box 293. com Twitter: @Box 293 http: //exchange. nagios. org/directory/Owner/Box 293/1

About Me IT Consultant Nagios Developer Love tinkering with Nagios Why Nagios XI? It’s a virtual appliance - ready to go 2

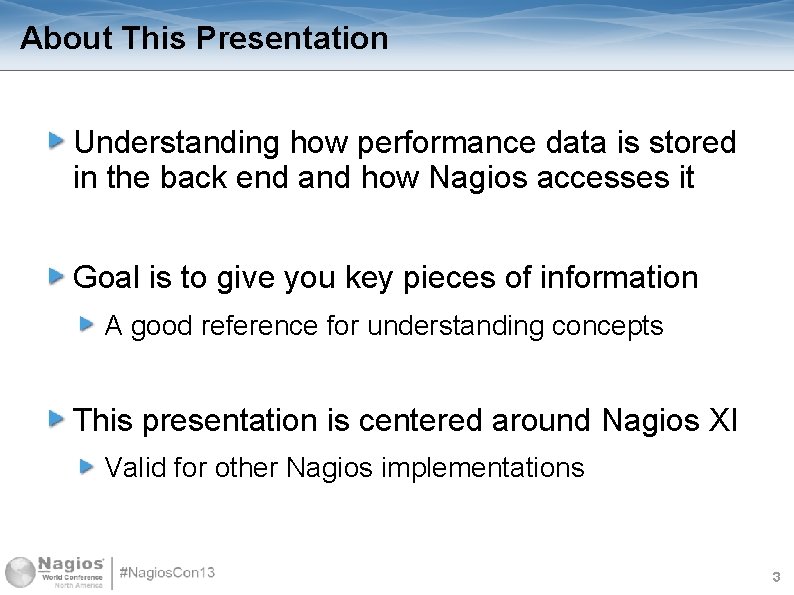
About This Presentation Understanding how performance data is stored in the back end and how Nagios accesses it Goal is to give you key pieces of information A good reference for understanding concepts This presentation is centered around Nagios XI Valid for other Nagios implementations 3

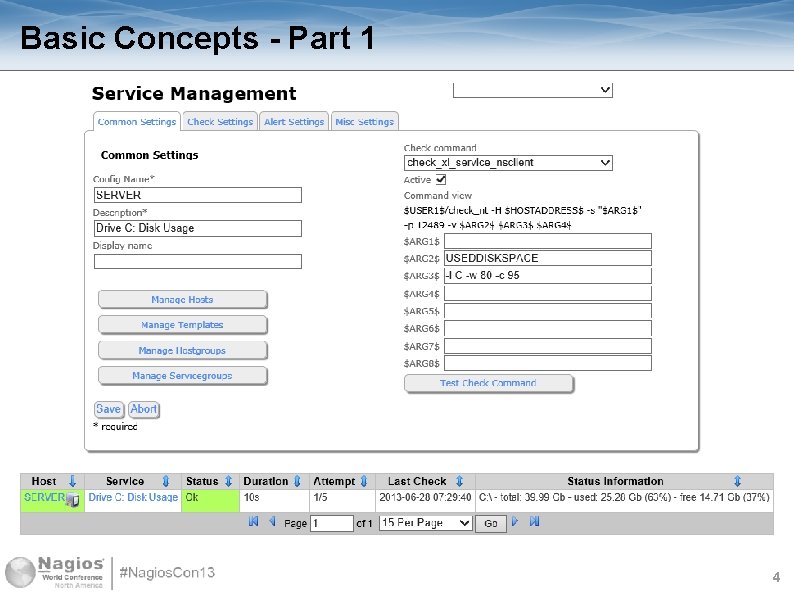
Basic Concepts - Part 1 4

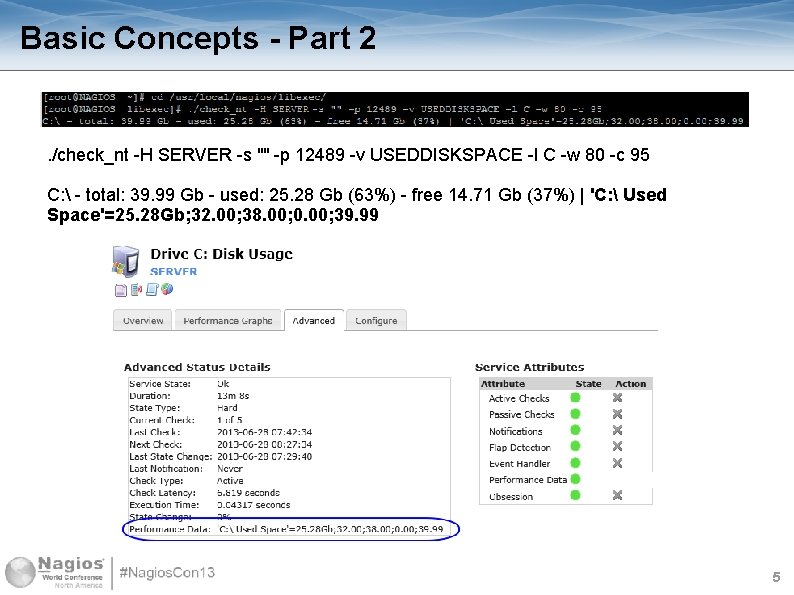
Basic Concepts - Part 2 . /check_nt -H SERVER -s "" -p 12489 -v USEDDISKSPACE -l C -w 80 -c 95 C: - total: 39. 99 Gb - used: 25. 28 Gb (63%) - free 14. 71 Gb (37%) | 'C: Used Space'=25. 28 Gb; 32. 00; 38. 00; 0. 00; 39. 99 5

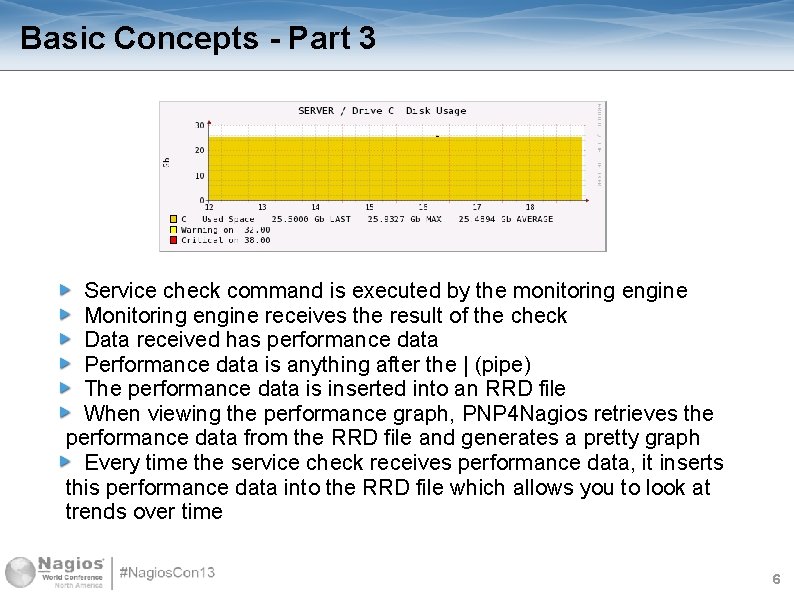
Basic Concepts - Part 3 Service check command is executed by the monitoring engine Monitoring engine receives the result of the check Data received has performance data Performance data is anything after the | (pipe) The performance data is inserted into an RRD file When viewing the performance graph, PNP 4 Nagios retrieves the performance data from the RRD file and generates a pretty graph Every time the service check receives performance data, it inserts this performance data into the RRD file which allows you to look at trends over time 6

Plugins The power of Nagios is in the plugins! Monitor what you want, how you want! Resources available that clearly define the guidelines around creating plugins Nagios Plug-in Developer Guidelines http: //nagiosplug. sourceforge. net/developerguidelines. html PNP Documentation http: //docs. pnp 4 nagios. org/pnp-0. 4/doc_complete 7

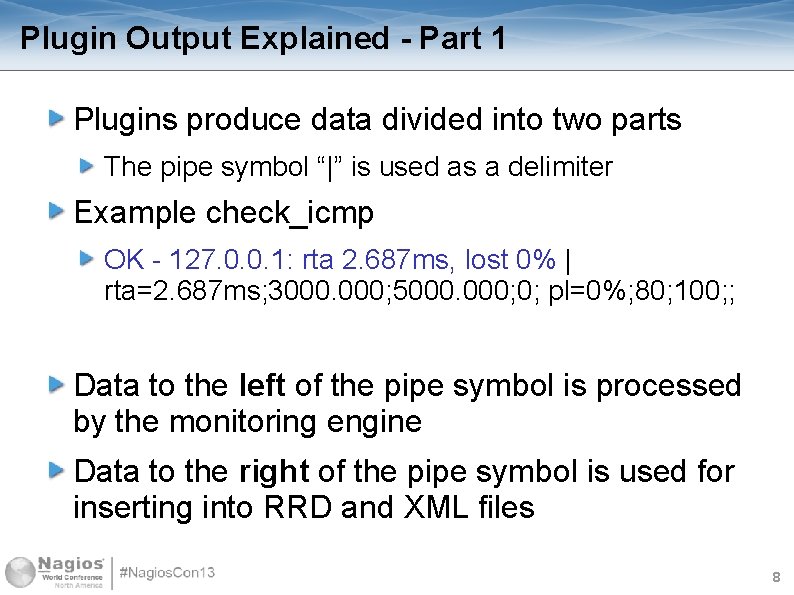
Plugin Output Explained - Part 1 Plugins produce data divided into two parts The pipe symbol “|” is used as a delimiter Example check_icmp OK - 127. 0. 0. 1: rta 2. 687 ms, lost 0% | rta=2. 687 ms; 3000. 000; 5000. 000; 0; pl=0%; 80; 100; ; Data to the left of the pipe symbol is processed by the monitoring engine Data to the right of the pipe symbol is used for inserting into RRD and XML files 8

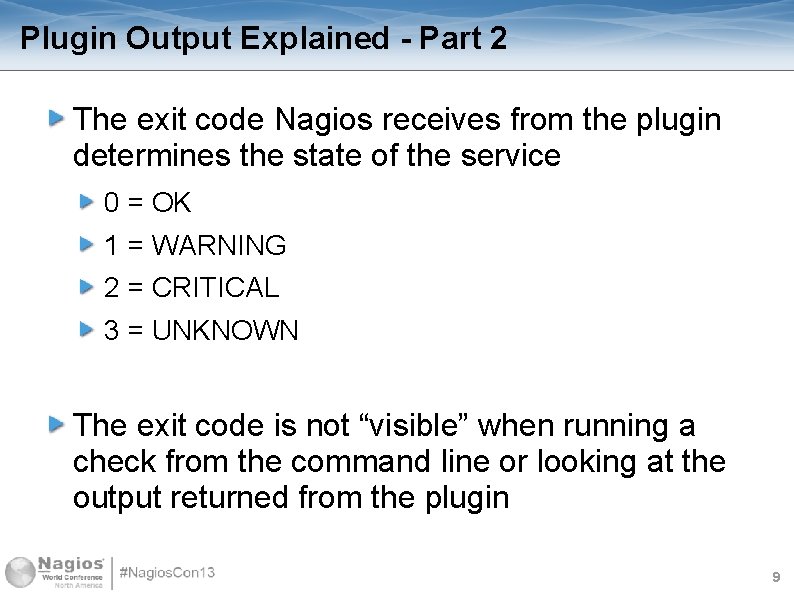
Plugin Output Explained - Part 2 The exit code Nagios receives from the plugin determines the state of the service 0 = OK 1 = WARNING 2 = CRITICAL 3 = UNKNOWN The exit code is not “visible” when running a check from the command line or looking at the output returned from the plugin 9

Plugin Output Explained - Part 3 No performance data = no pretty graphs You can create a plugin using whatever language and tools are available All that matters is the end result which is returned back to Nagios when the plugin has finished running 10

Plugin Output Explained - Part 4 Examples: Shell script Something you might want to check on the Nagios host itself perl script Remotely checking a device using SNMP OR using third party APIs like the VMware v. Sphere SDK to remotely access virtual environments Visual Basic script Using NSClient on a Windows host to perform a check (like RDP usage) 11

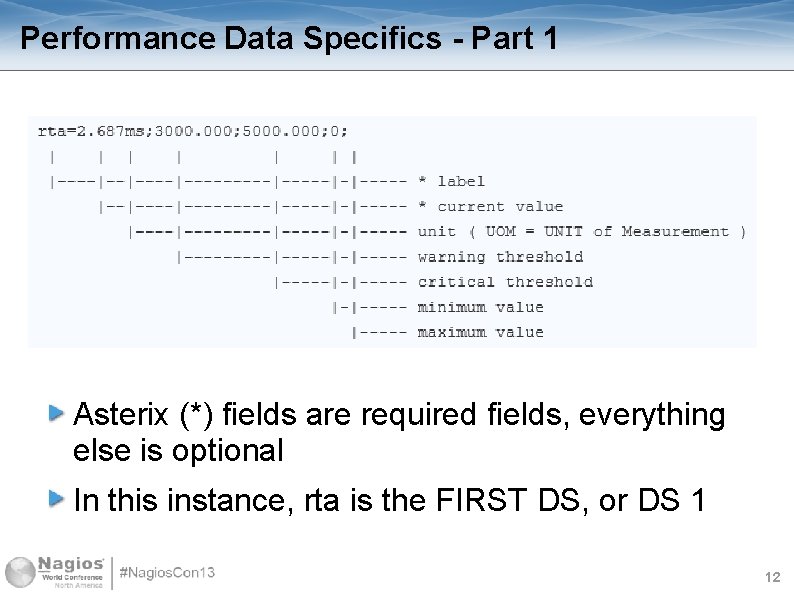
Performance Data Specifics - Part 1 Asterix (*) fields are required fields, everything else is optional In this instance, rta is the FIRST DS, or DS 1 12

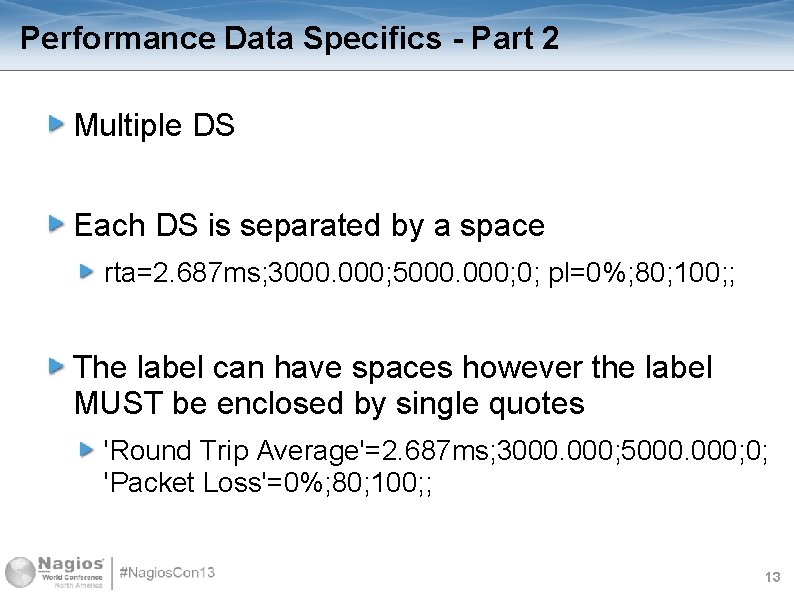
Performance Data Specifics - Part 2 Multiple DS Each DS is separated by a space rta=2. 687 ms; 3000. 000; 5000. 000; 0; pl=0%; 80; 100; ; The label can have spaces however the label MUST be enclosed by single quotes 'Round Trip Average'=2. 687 ms; 3000. 000; 5000. 000; 0; 'Packet Loss'=0%; 80; 100; ; 13

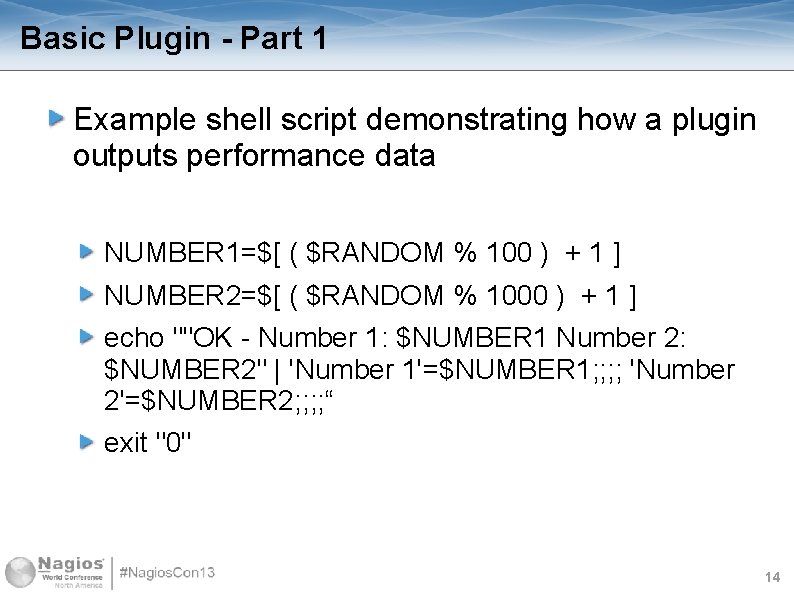
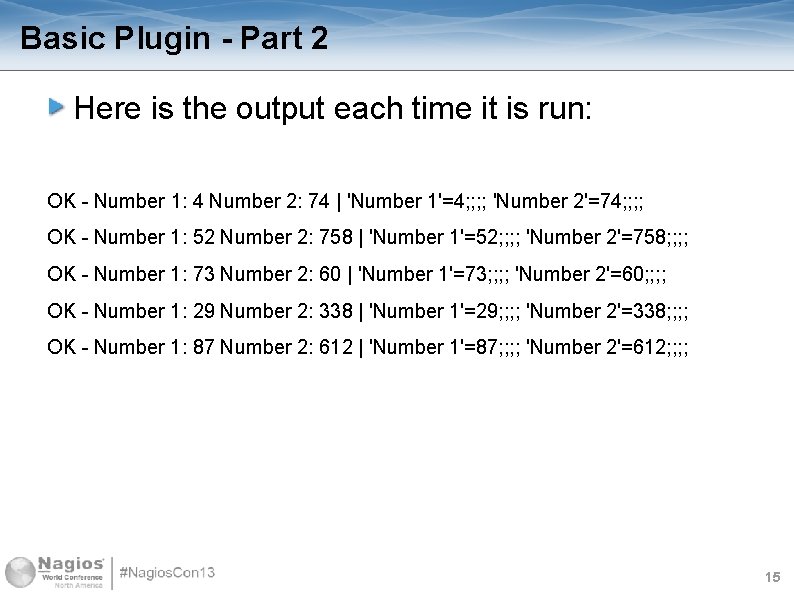
Basic Plugin - Part 1 Example shell script demonstrating how a plugin outputs performance data NUMBER 1=$[ ( $RANDOM % 100 ) + 1 ] NUMBER 2=$[ ( $RANDOM % 1000 ) + 1 ] echo ""OK - Number 1: $NUMBER 1 Number 2: $NUMBER 2" | 'Number 1'=$NUMBER 1; ; 'Number 2'=$NUMBER 2; ; “ exit "0" 14

Basic Plugin - Part 2 Here is the output each time it is run: OK - Number 1: 4 Number 2: 74 | 'Number 1'=4; ; 'Number 2'=74; ; OK - Number 1: 52 Number 2: 758 | 'Number 1'=52; ; 'Number 2'=758; ; OK - Number 1: 73 Number 2: 60 | 'Number 1'=73; ; 'Number 2'=60; ; OK - Number 1: 29 Number 2: 338 | 'Number 1'=29; ; 'Number 2'=338; ; OK - Number 1: 87 Number 2: 612 | 'Number 1'=87; ; 'Number 2'=612; ; 15

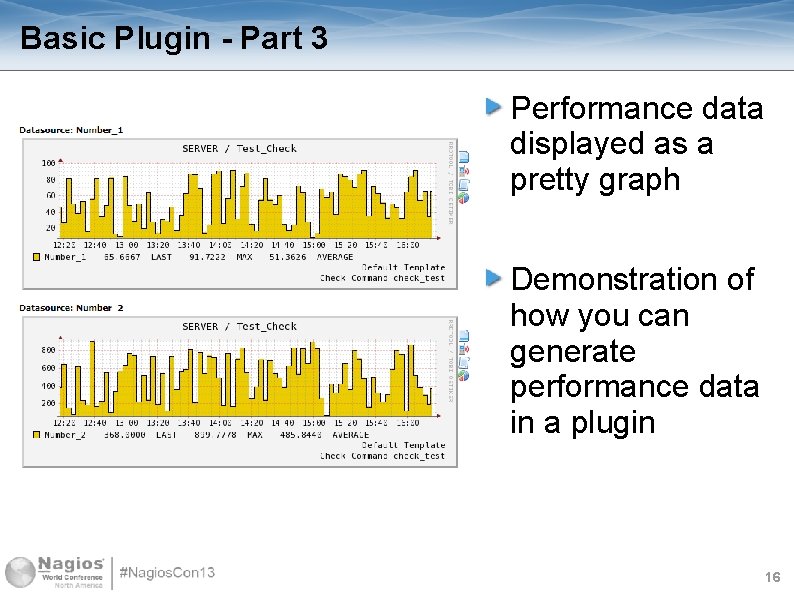
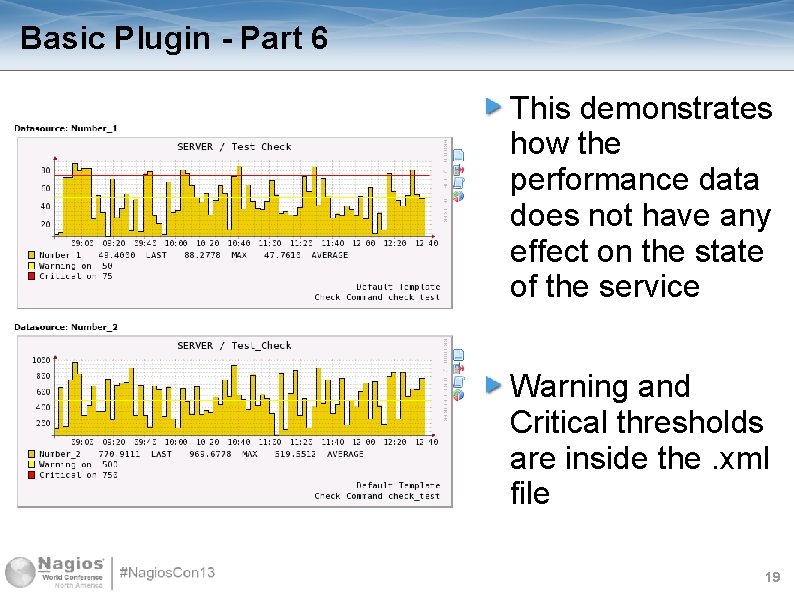
Basic Plugin - Part 3 Performance data displayed as a pretty graph Demonstration of how you can generate performance data in a plugin 16

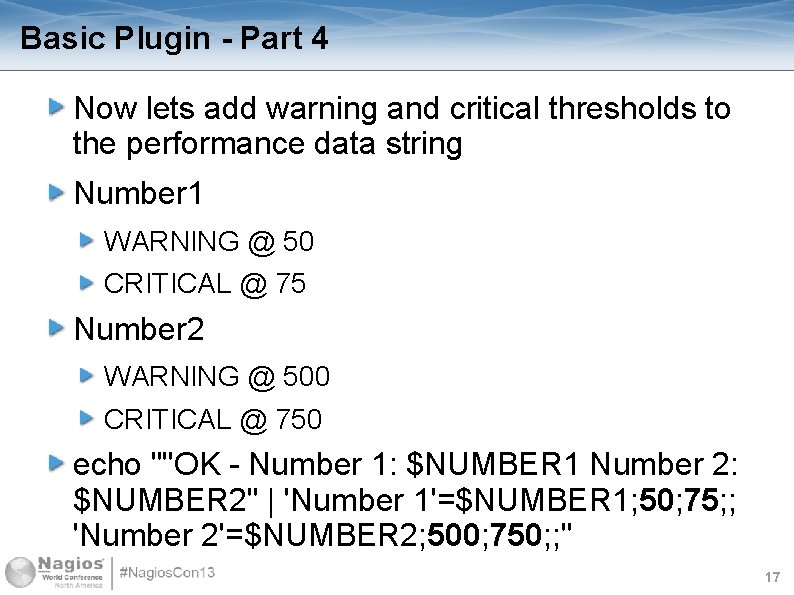
Basic Plugin - Part 4 Now lets add warning and critical thresholds to the performance data string Number 1 WARNING @ 50 CRITICAL @ 75 Number 2 WARNING @ 500 CRITICAL @ 750 echo ""OK - Number 1: $NUMBER 1 Number 2: $NUMBER 2" | 'Number 1'=$NUMBER 1; 50; 75; ; 'Number 2'=$NUMBER 2; 500; 750; ; " 17

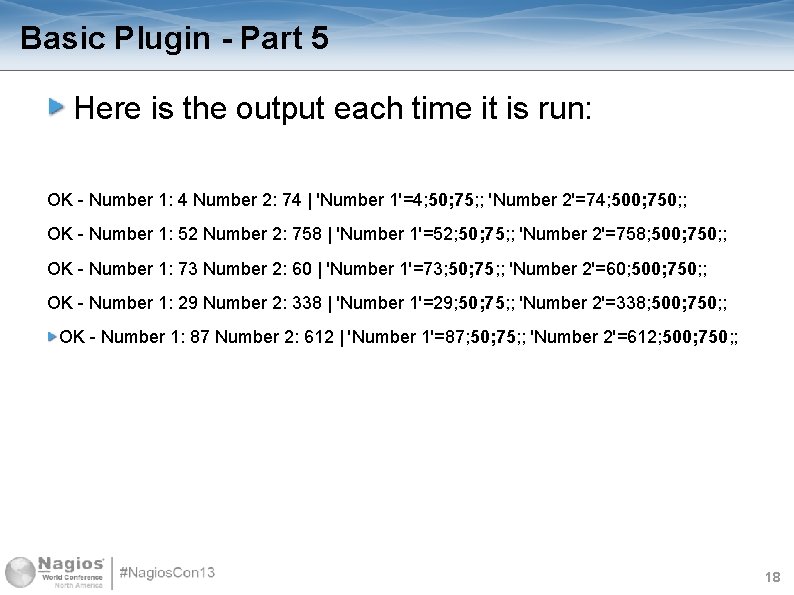
Basic Plugin - Part 5 Here is the output each time it is run: OK - Number 1: 4 Number 2: 74 | 'Number 1'=4; 50; 75; ; 'Number 2'=74; 500; 750; ; OK - Number 1: 52 Number 2: 758 | 'Number 1'=52; 50; 75; ; 'Number 2'=758; 500; 750; ; OK - Number 1: 73 Number 2: 60 | 'Number 1'=73; 50; 75; ; 'Number 2'=60; 500; 750; ; OK - Number 1: 29 Number 2: 338 | 'Number 1'=29; 50; 75; ; 'Number 2'=338; 500; 750; ; OK - Number 1: 87 Number 2: 612 | 'Number 1'=87; 50; 75; ; 'Number 2'=612; 500; 750; ; 18

Basic Plugin - Part 6 This demonstrates how the performance data does not have any effect on the state of the service Warning and Critical thresholds are inside the. xml file 19

. rrd and. xml files Used for recording the results from Nagios checks Useful for observing daily trends of your environment Invaluable for helping resolve performance issues RRD = Round Robin Database XML = Information about the Nagios check PNP 4 Nagios uses the RRD and XML files to generate pretty graphs 20

Location of. rrd and. xml files When a service check returns performance data, Nagios dumps this into: /usr/local/nagios/var/spool/perfdata A background process detects the spooled data and creates / updates the relevant. rrd and. xml The Performance Data files live in: /usr/local/nagios/share/perfdata/<host> 21

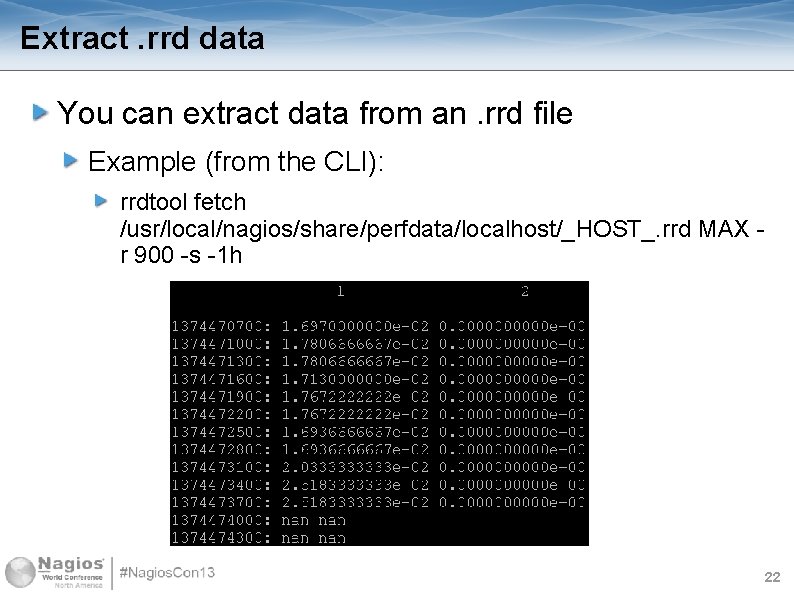
Extract. rrd data You can extract data from an. rrd file Example (from the CLI): rrdtool fetch /usr/local/nagios/share/perfdata/localhost/_HOST_. rrd MAX r 900 -s -1 h 22

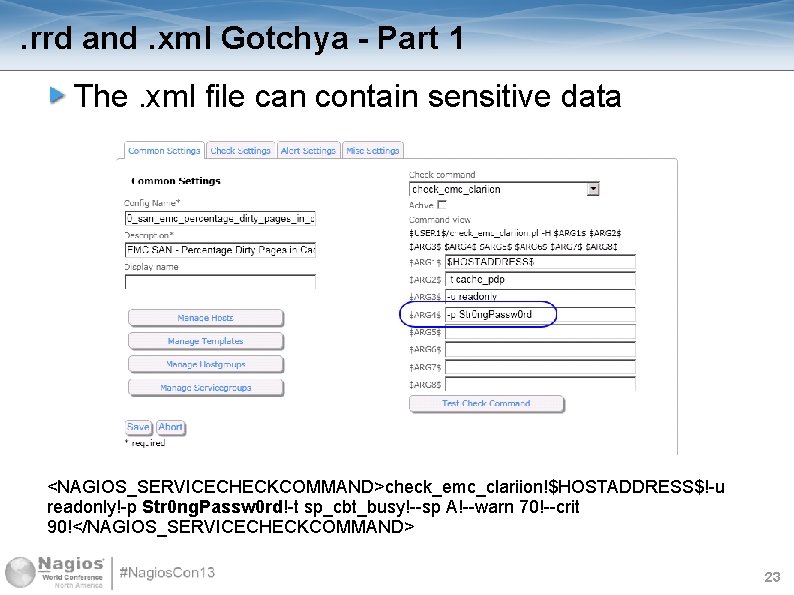
. rrd and. xml Gotchya - Part 1 The. xml file can contain sensitive data <NAGIOS_SERVICECHECKCOMMAND>check_emc_clariion!$HOSTADDRESS$!-u readonly!-p Str 0 ng. Passw 0 rd!-t sp_cbt_busy!--sp A!--warn 70!--crit 90!</NAGIOS_SERVICECHECKCOMMAND> 23

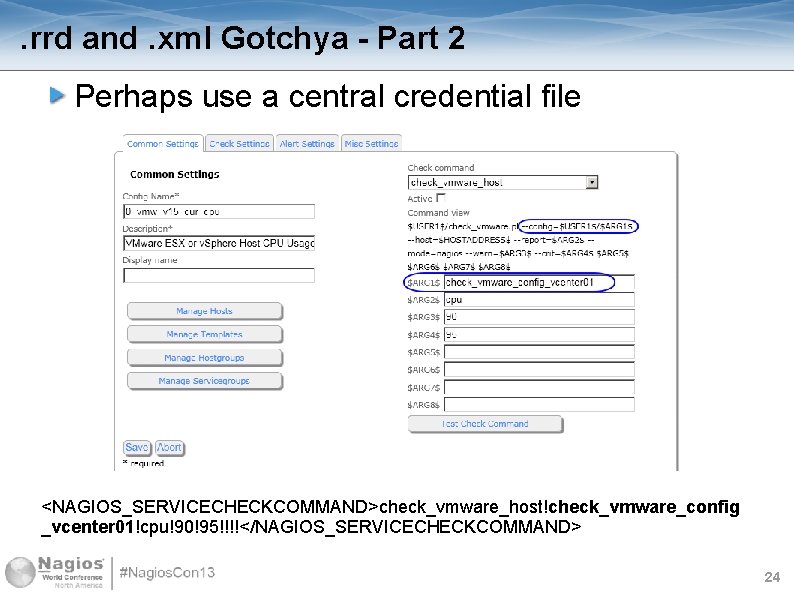
. rrd and. xml Gotchya - Part 2 Perhaps use a central credential file <NAGIOS_SERVICECHECKCOMMAND>check_vmware_host!check_vmware_config _vcenter 01!cpu!90!95!!!!</NAGIOS_SERVICECHECKCOMMAND> 24

. rrd and. xml Gotchya - Part 3 RRD Data is averaged out over time Looking at performance graphs for past day / week / month / year will show results with less spikey data This generally only occurs with data that has lots of peaks and troughs Constant data like disk space used will generally not average out that much It all depends on your environment! When reviewing RRD data you need to take into consideration these factors, it’s all relative! 25

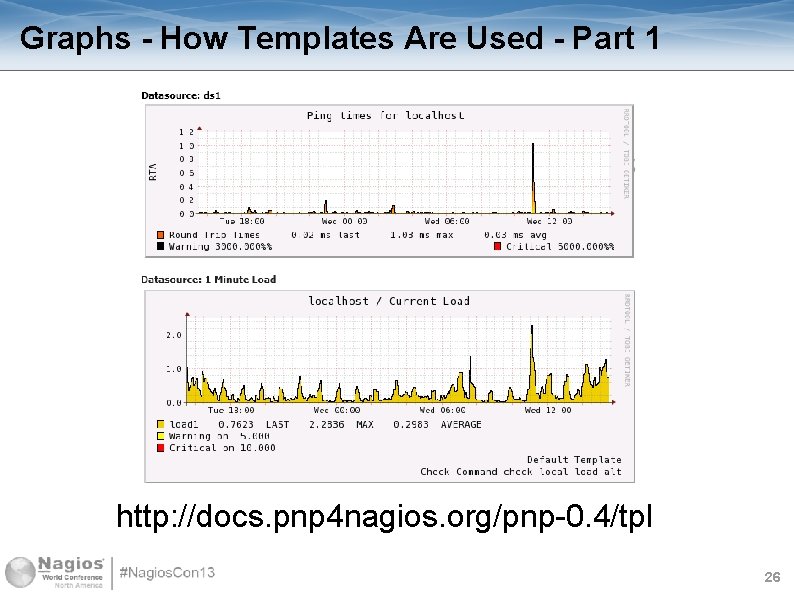
Graphs - How Templates Are Used - Part 1 http: //docs. pnp 4 nagios. org/pnp-0. 4/tpl 26

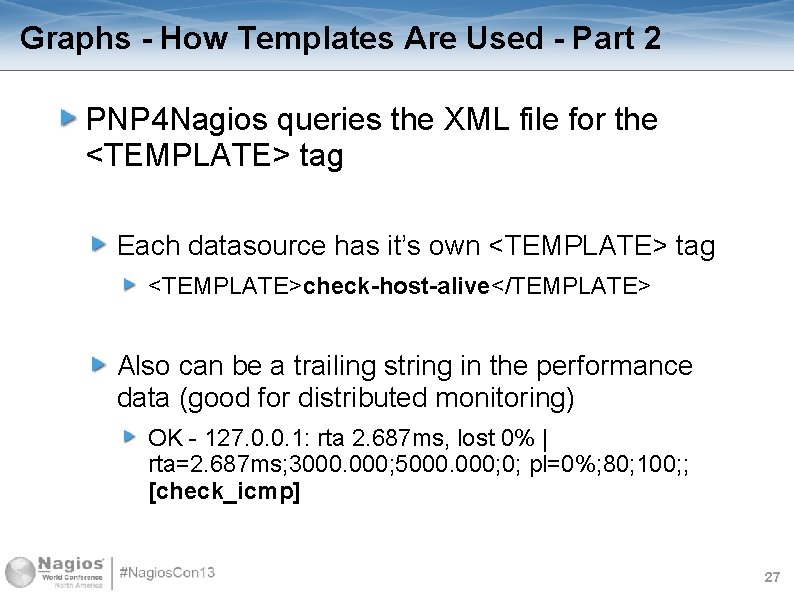
Graphs - How Templates Are Used - Part 2 PNP 4 Nagios queries the XML file for the <TEMPLATE> tag Each datasource has it’s own <TEMPLATE> tag <TEMPLATE>check-host-alive</TEMPLATE> Also can be a trailing string in the performance data (good for distributed monitoring) OK - 127. 0. 0. 1: rta 2. 687 ms, lost 0% | rta=2. 687 ms; 3000. 000; 5000. 000; 0; pl=0%; 80; 100; ; [check_icmp] 27

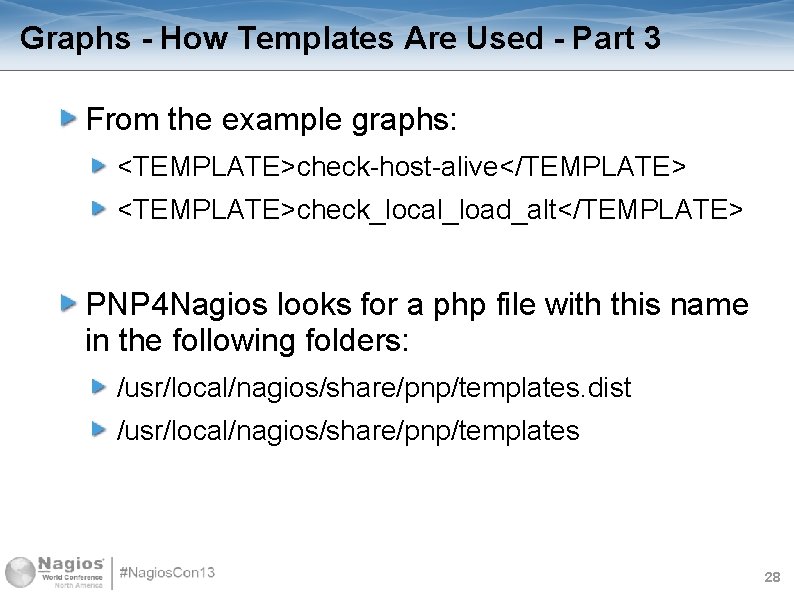
Graphs - How Templates Are Used - Part 3 From the example graphs: <TEMPLATE>check-host-alive</TEMPLATE> <TEMPLATE>check_local_load_alt</TEMPLATE> PNP 4 Nagios looks for a php file with this name in the following folders: /usr/local/nagios/share/pnp/templates. dist /usr/local/nagios/share/pnp/templates 28

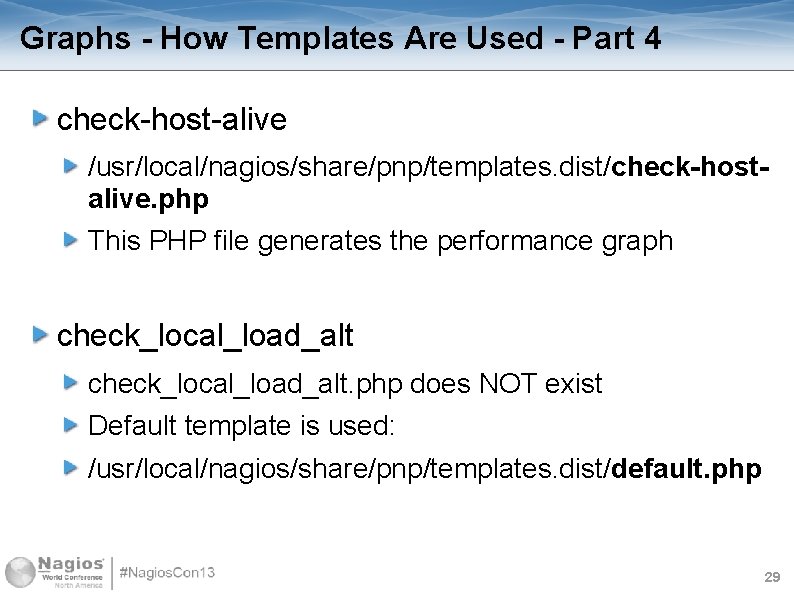
Graphs - How Templates Are Used - Part 4 check-host-alive /usr/local/nagios/share/pnp/templates. dist/check-hostalive. php This PHP file generates the performance graph check_local_load_alt. php does NOT exist Default template is used: /usr/local/nagios/share/pnp/templates. dist/default. php 29

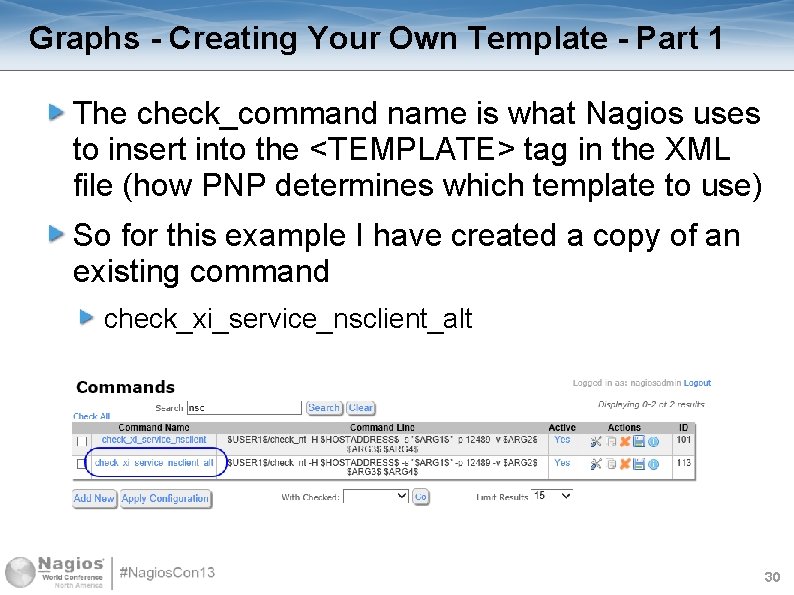
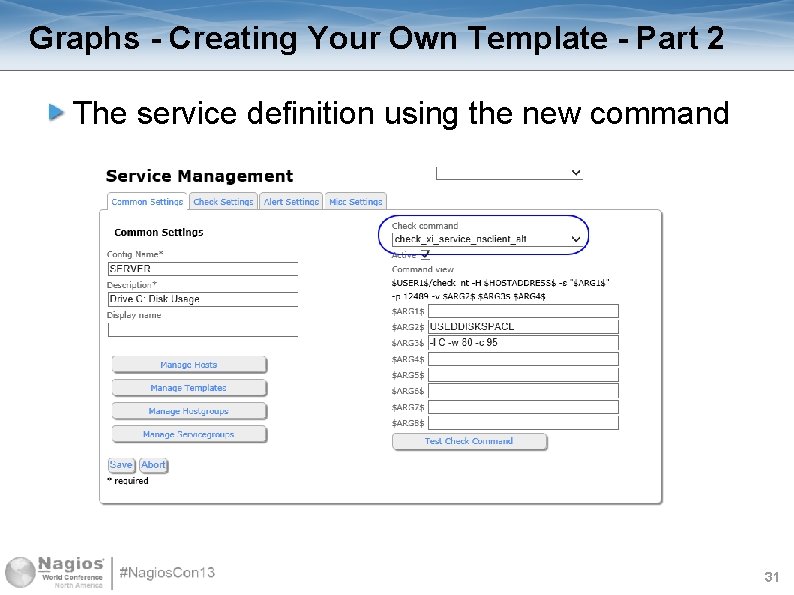
Graphs - Creating Your Own Template - Part 1 The check_command name is what Nagios uses to insert into the <TEMPLATE> tag in the XML file (how PNP determines which template to use) So for this example I have created a copy of an existing command check_xi_service_nsclient_alt 30

Graphs - Creating Your Own Template - Part 2 The service definition using the new command 31

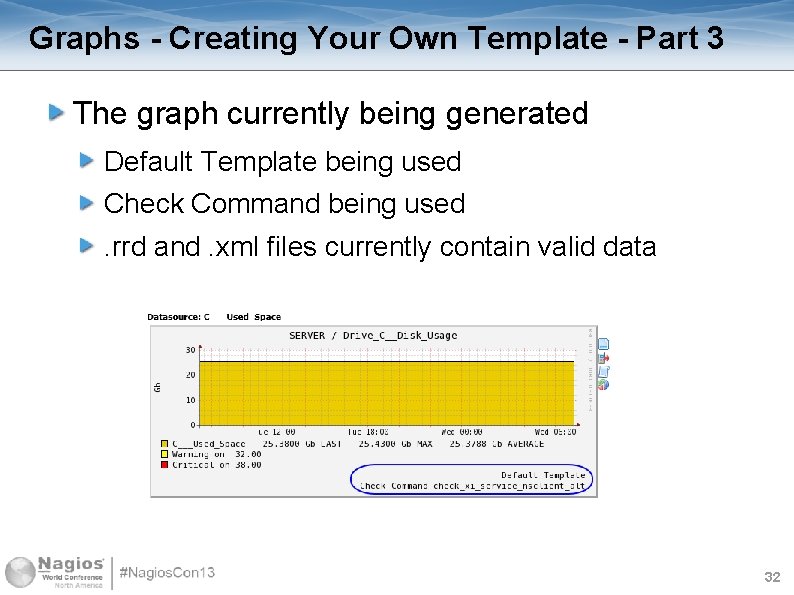
Graphs - Creating Your Own Template - Part 3 The graph currently being generated Default Template being used Check Command being used. rrd and. xml files currently contain valid data 32

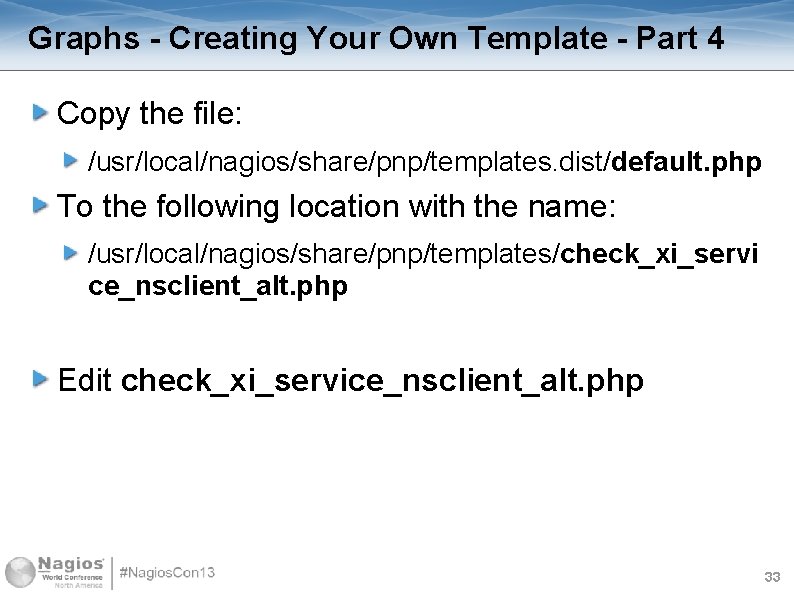
Graphs - Creating Your Own Template - Part 4 Copy the file: /usr/local/nagios/share/pnp/templates. dist/default. php To the following location with the name: /usr/local/nagios/share/pnp/templates/check_xi_servi ce_nsclient_alt. php Edit check_xi_service_nsclient_alt. php 33

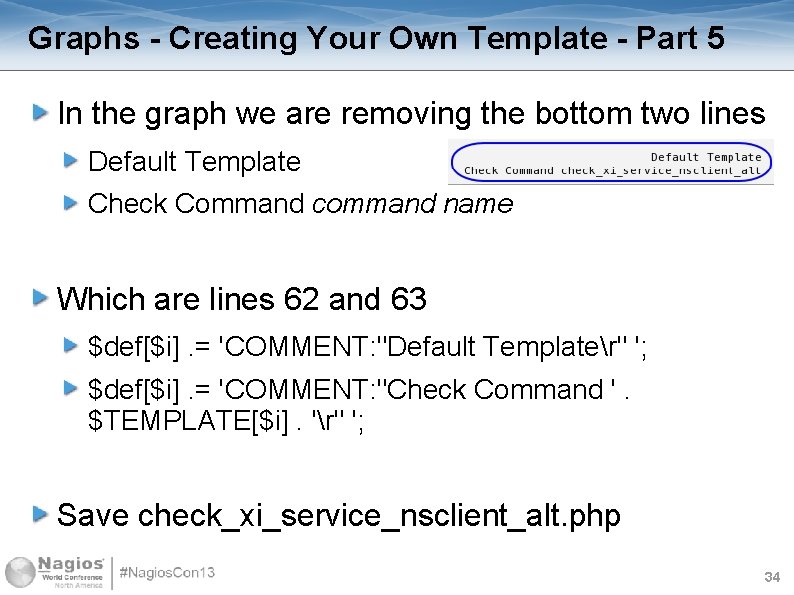
Graphs - Creating Your Own Template - Part 5 In the graph we are removing the bottom two lines Default Template Check Command command name Which are lines 62 and 63 $def[$i]. = 'COMMENT: "Default Templater" '; $def[$i]. = 'COMMENT: "Check Command '. $TEMPLATE[$i]. 'r" '; Save check_xi_service_nsclient_alt. php 34

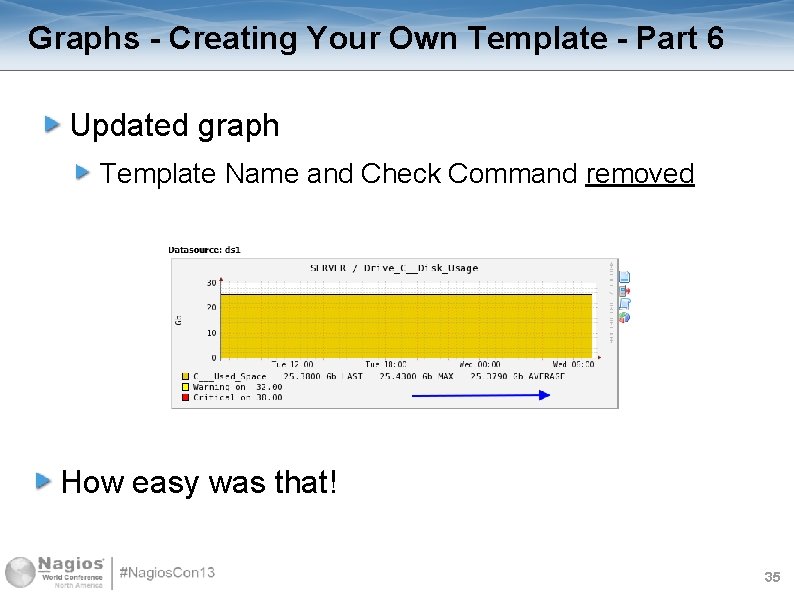
Graphs - Creating Your Own Template - Part 6 Updated graph Template Name and Check Command removed How easy was that! 35

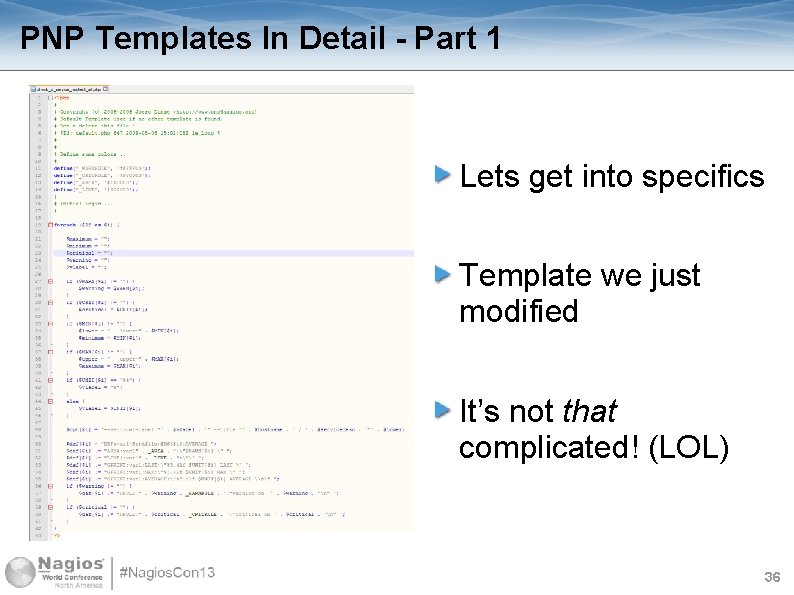
PNP Templates In Detail - Part 1 Lets get into specifics Template we just modified It’s not that complicated! (LOL) 36

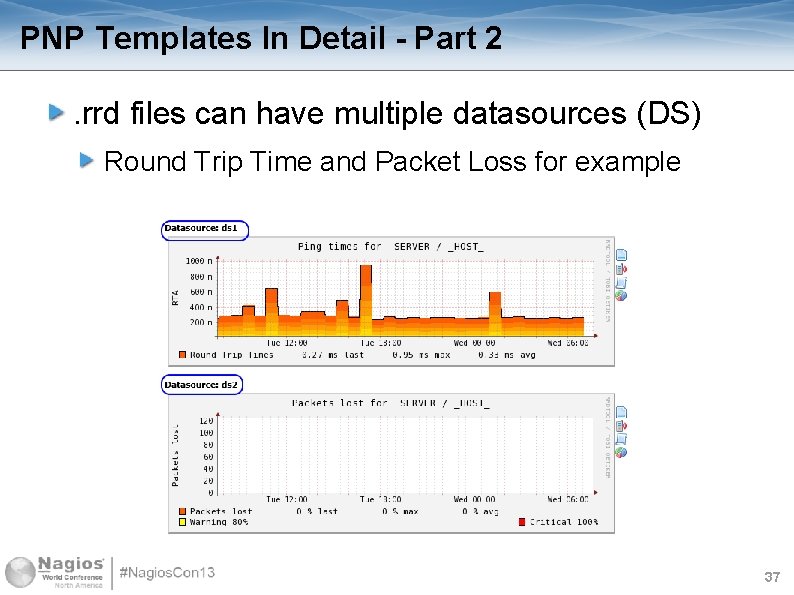
PNP Templates In Detail - Part 2. rrd files can have multiple datasources (DS) Round Trip Time and Packet Loss for example 37

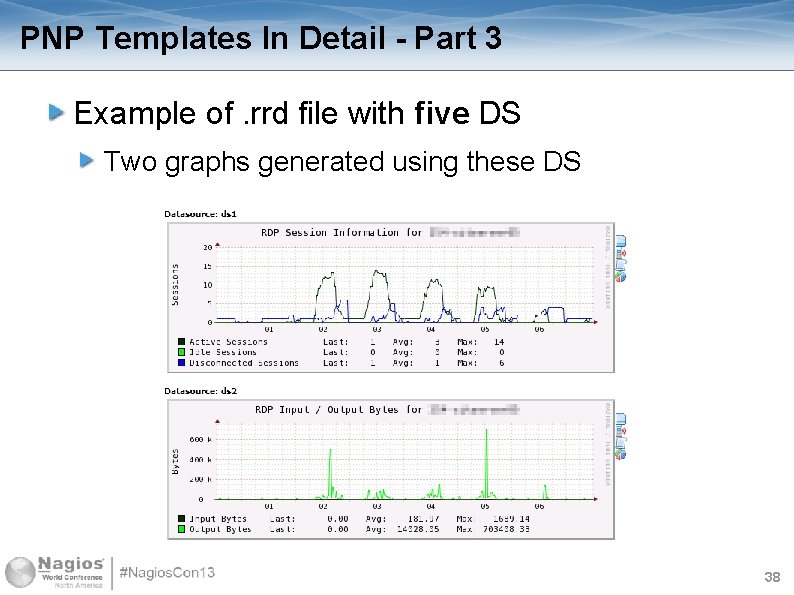
PNP Templates In Detail - Part 3 Example of. rrd file with five DS Two graphs generated using these DS 38

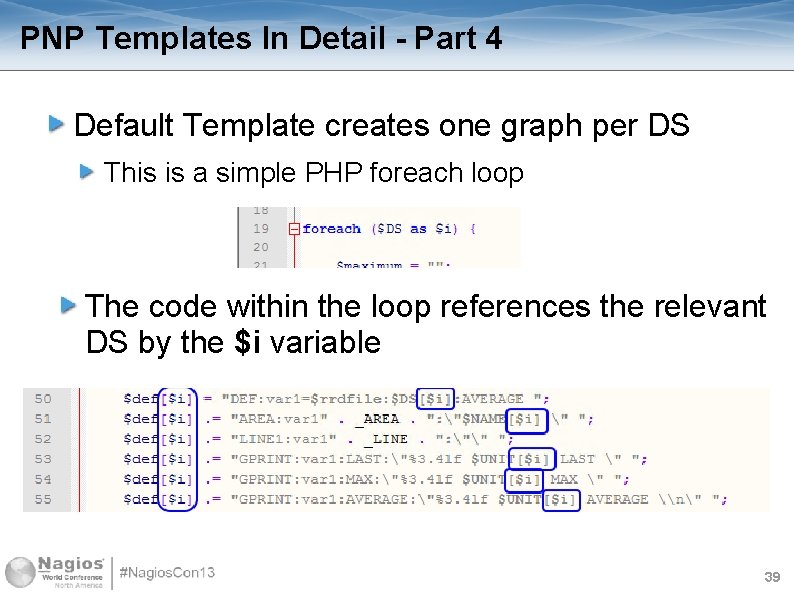
PNP Templates In Detail - Part 4 Default Template creates one graph per DS This is a simple PHP foreach loop The code within the loop references the relevant DS by the $i variable 39

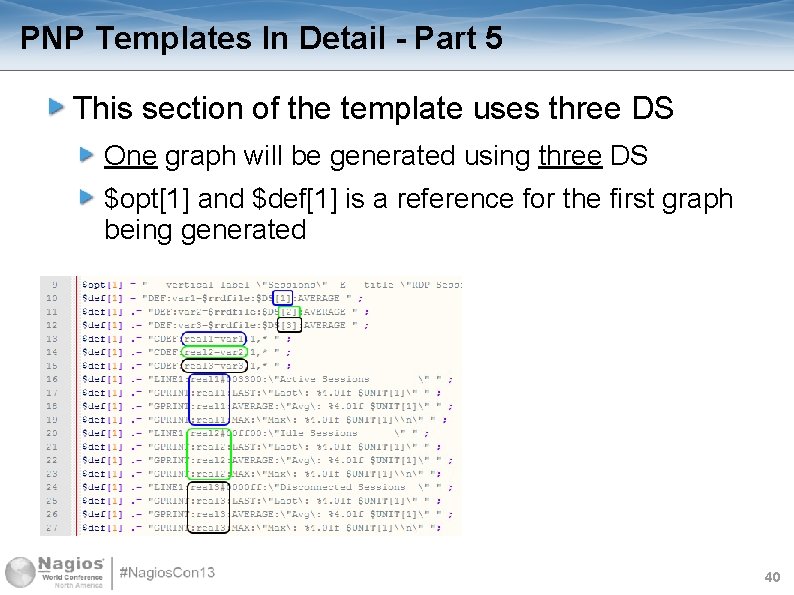
PNP Templates In Detail - Part 5 This section of the template uses three DS One graph will be generated using three DS $opt[1] and $def[1] is a reference for the first graph being generated 40

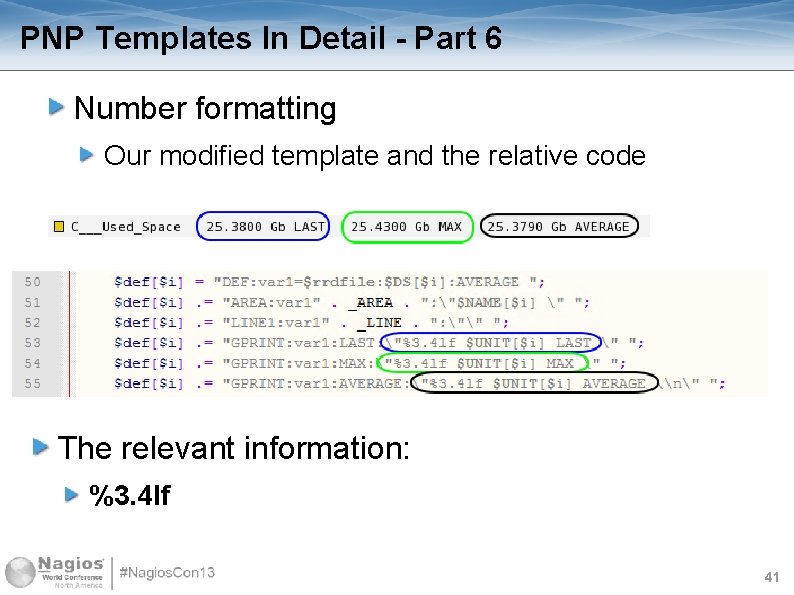
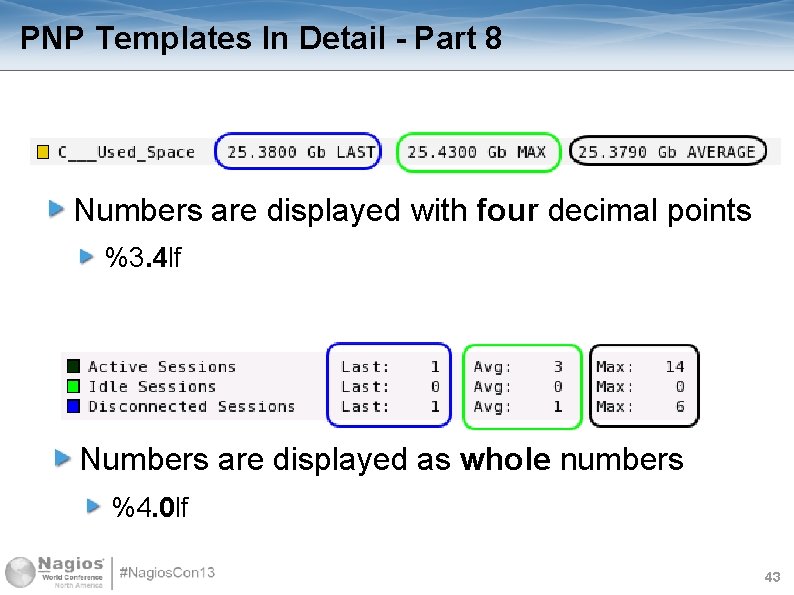
PNP Templates In Detail - Part 6 Number formatting Our modified template and the relative code The relevant information: %3. 4 lf 41

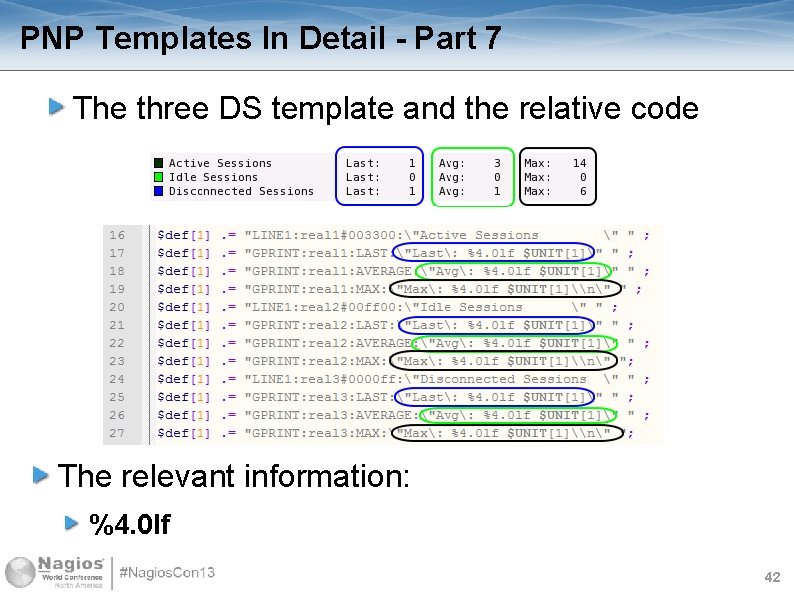
PNP Templates In Detail - Part 7 The three DS template and the relative code The relevant information: %4. 0 lf 42

PNP Templates In Detail - Part 8 Numbers are displayed with four decimal points %3. 4 lf Numbers are displayed as whole numbers %4. 0 lf 43

PNP Templates In Detail - Part 9 PNP documentation defines the number formatting using the printf standard defined here http: //en. wikipedia. org/wiki/Printf The number (1) and the letter "L" look alike %3. 4 lg contains a lower case "L" The syntax is %[parameter][flags][width][. precision][length]type 44

PNP Templates In Detail - Part 10 width When the number is generated on the graph, it will allocate a minimum specific width, this helps you align numbers in a column style precision Determines if the number displayed is a whole number, or a number with a specific number of digits following the decimal place 45

PNP Templates In Detail - Part 11 %3. 4 lf width = 3 precision =. 4 hence the displayed number is 25. 3800 %4. 0 lf width = 4 precision =. 0 hence the displayed number is 14 Because the precision is 0, NO decimal place is used 46

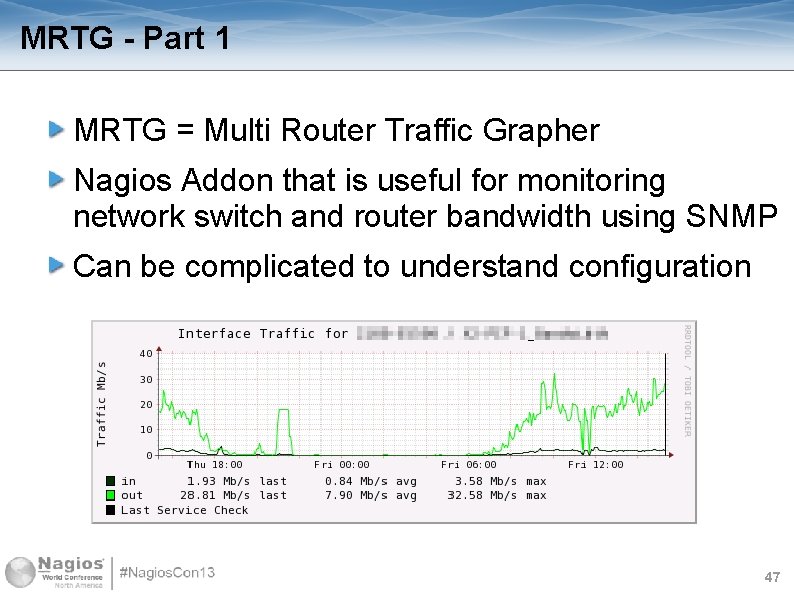
MRTG - Part 1 MRTG = Multi Router Traffic Grapher Nagios Addon that is useful for monitoring network switch and router bandwidth using SNMP Can be complicated to understand configuration 47

MRTG - Part 2 Nagios XI Wizard called “Network Switch / Router” automates the configuration of MRTG configuration file /etc/mrtg. cfg MRTG runs as a cron job every five minutes cron comes from the Greek word for time, χρόνος [chronos] Hence cron is a software utility on linux which is a time -based job scheduler In the windows world it's the Task Scheduler 48

MRTG - Part 3 When MRTG runs, it gathers data from the devices defined in the mrtg. cfg file It dumps this data into the folder /var/lib/mrtg For every port monitored, an. rrd file is created (no. xml file created at this point) Another background process will then take the data in /var/lib/mrtg and put it into the correct location /usr/local/nagios/share/perfdata/<host> 49

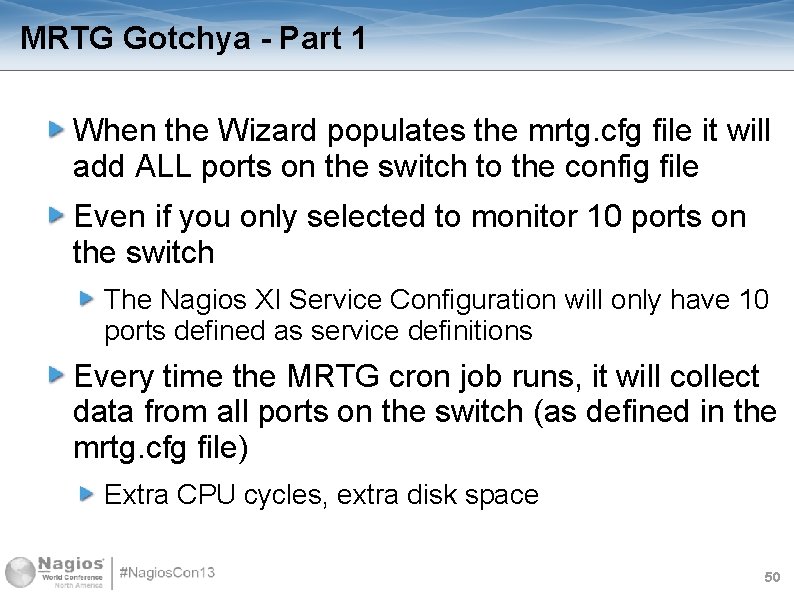
MRTG Gotchya - Part 1 When the Wizard populates the mrtg. cfg file it will add ALL ports on the switch to the config file Even if you only selected to monitor 10 ports on the switch The Nagios XI Service Configuration will only have 10 ports defined as service definitions Every time the MRTG cron job runs, it will collect data from all ports on the switch (as defined in the mrtg. cfg file) Extra CPU cycles, extra disk space 50

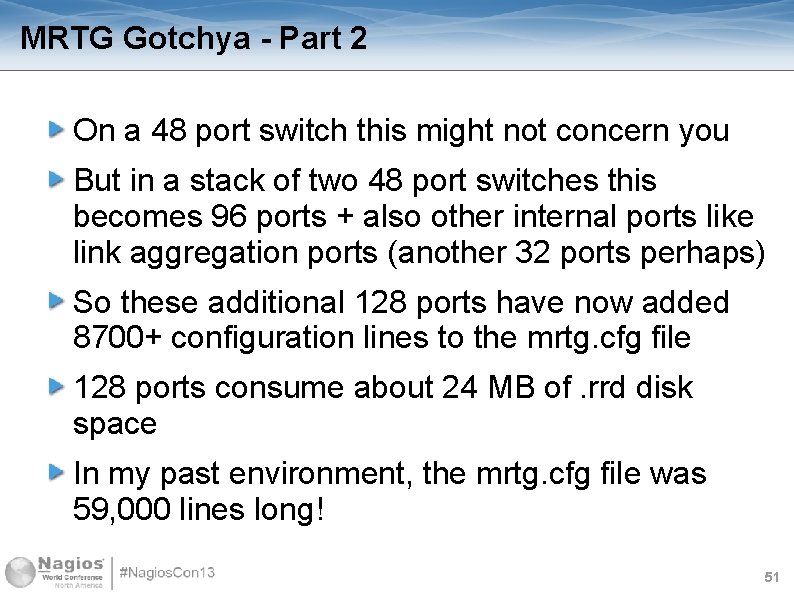
MRTG Gotchya - Part 2 On a 48 port switch this might not concern you But in a stack of two 48 port switches this becomes 96 ports + also other internal ports like link aggregation ports (another 32 ports perhaps) So these additional 128 ports have now added 8700+ configuration lines to the mrtg. cfg file 128 ports consume about 24 MB of. rrd disk space In my past environment, the mrtg. cfg file was 59, 000 lines long! 51

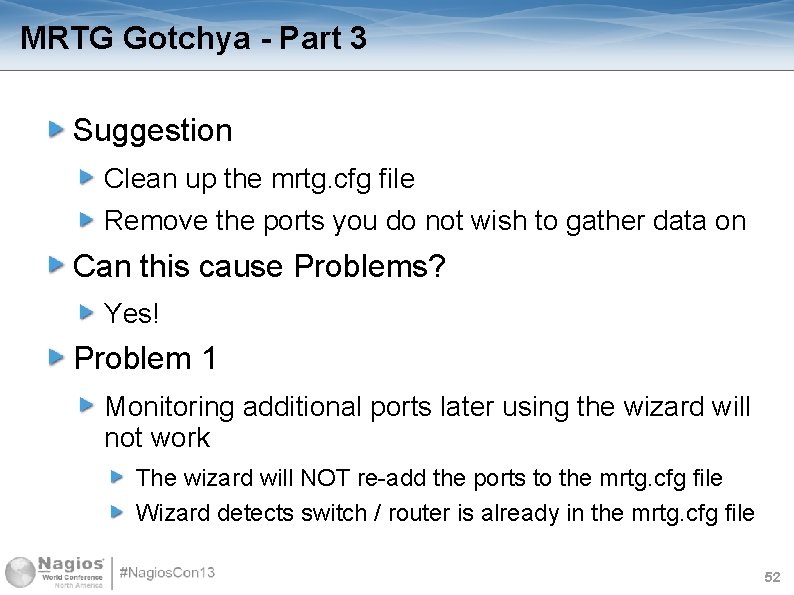
MRTG Gotchya - Part 3 Suggestion Clean up the mrtg. cfg file Remove the ports you do not wish to gather data on Can this cause Problems? Yes! Problem 1 Monitoring additional ports later using the wizard will not work The wizard will NOT re-add the ports to the mrtg. cfg file Wizard detects switch / router is already in the mrtg. cfg file 52

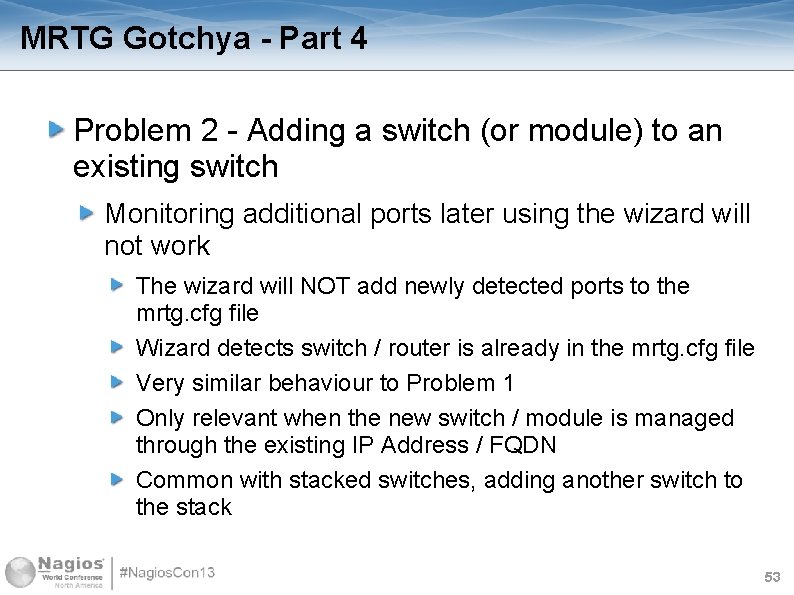
MRTG Gotchya - Part 4 Problem 2 - Adding a switch (or module) to an existing switch Monitoring additional ports later using the wizard will not work The wizard will NOT add newly detected ports to the mrtg. cfg file Wizard detects switch / router is already in the mrtg. cfg file Very similar behaviour to Problem 1 Only relevant when the new switch / module is managed through the existing IP Address / FQDN Common with stacked switches, adding another switch to the stack 53

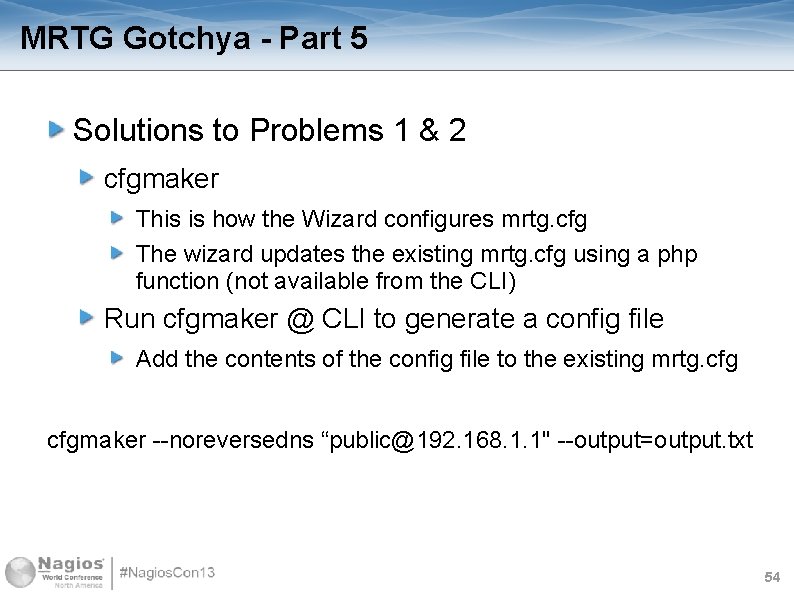
MRTG Gotchya - Part 5 Solutions to Problems 1 & 2 cfgmaker This is how the Wizard configures mrtg. cfg The wizard updates the existing mrtg. cfg using a php function (not available from the CLI) Run cfgmaker @ CLI to generate a config file Add the contents of the config file to the existing mrtg. cfgmaker --noreversedns “public@192. 168. 1. 1" --output=output. txt 54

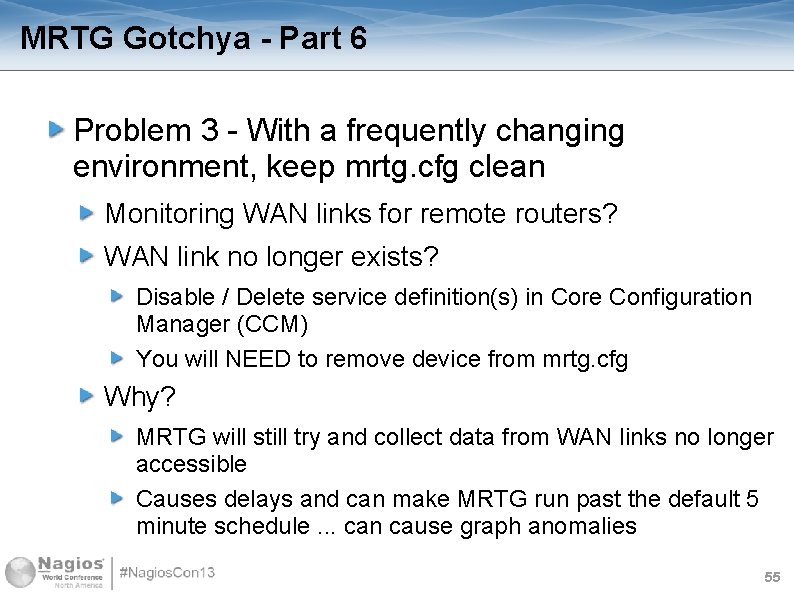
MRTG Gotchya - Part 6 Problem 3 - With a frequently changing environment, keep mrtg. cfg clean Monitoring WAN links for remote routers? WAN link no longer exists? Disable / Delete service definition(s) in Core Configuration Manager (CCM) You will NEED to remove device from mrtg. cfg Why? MRTG will still try and collect data from WAN links no longer accessible Causes delays and can make MRTG run past the default 5 minute schedule. . . can cause graph anomalies 55

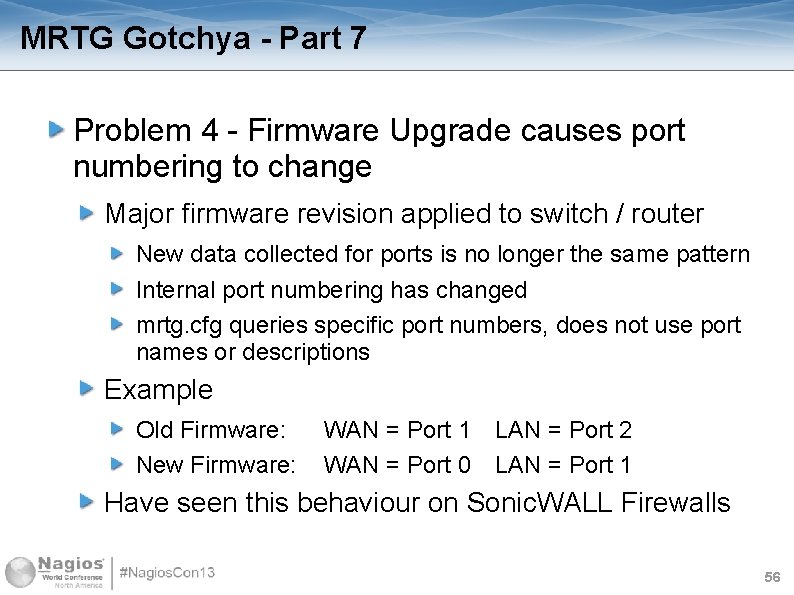
MRTG Gotchya - Part 7 Problem 4 - Firmware Upgrade causes port numbering to change Major firmware revision applied to switch / router New data collected for ports is no longer the same pattern Internal port numbering has changed mrtg. cfg queries specific port numbers, does not use port names or descriptions Example Old Firmware: New Firmware: WAN = Port 1 LAN = Port 2 WAN = Port 0 LAN = Port 1 Have seen this behaviour on Sonic. WALL Firewalls 56

Questions ? 57

Discount Offer But wait, there's more. . . When visiting the Nagios XI use my affiliate link http: //www. nagios. com/#ref=3 o. HG 00 58