CREATING GRAPHS Types of Graphs Line Graphs Compare


- Slides: 21
CREATING GRAPHS
Types of Graphs ■ Line Graphs – Compare two variables – Show trends and relationships in data – Allow the viewer to make predictions ■ Bar Graphs – Visually represent a set of data ■ Pie Charts – Show part-whole relationships – Used mostly in statistics
Line Graph
Bar Graph
Pie Chart
Independent Variable ■ The factor that is varied in an experiment and specifically controlled by the experimenter ■ Located on the x-axis
Dependent Variable ■ The factor that is measured in an experiment and will change as a result of the independent variable ■ Located on the y-axis
On Paper 1. Using your data, identify the independent and dependent variables 2. Draw your graph, labeling the x- and y-axis 3. Title your graph 4. Choose your intervals based on your data 5. Plot your data
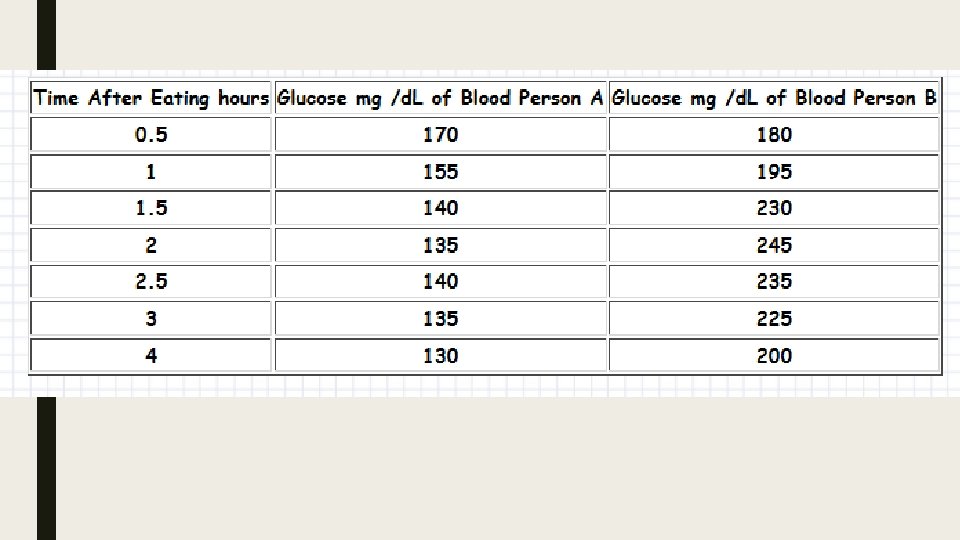
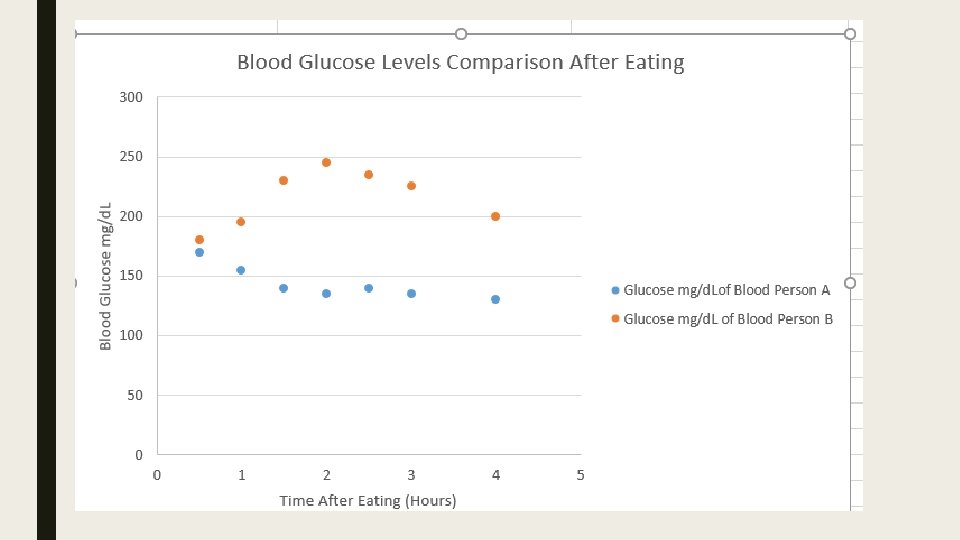
Practice-As a Class ■ Diabetes is a disease affecting the insulin producing glands of the pancreas. ■ If there is not enough insulin being produced by these cells, the amount of glucose in the blood will remain high. ■ A blood glucose level above 140 for an extended period of time is not considered normal. ■ This disease, if not brought under control, can lead to severe complications and even death.
Questions 1. What is the dependent variable? 2. What is the independent variable? 3. What would you title the graph? 4. Which individual(s) has diabetes?
Practice-In Your Notes
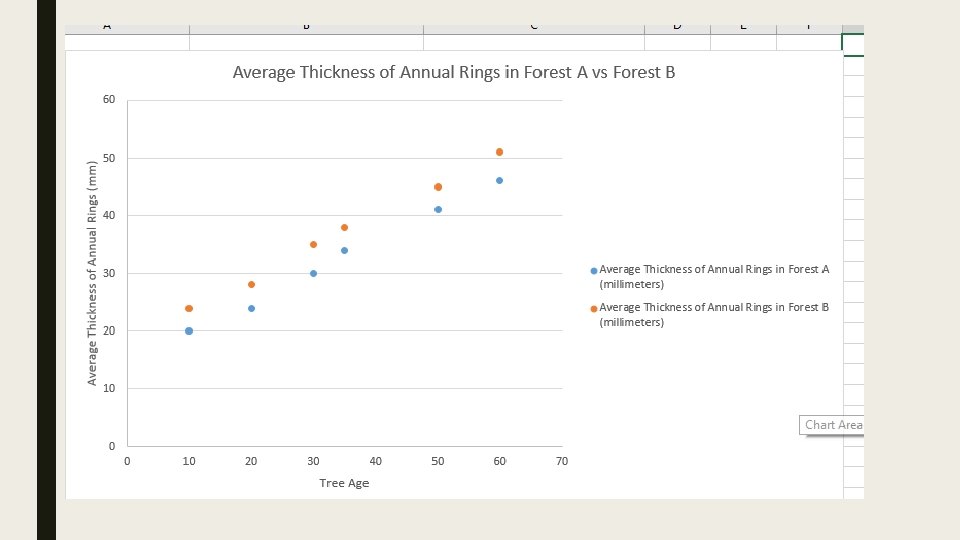
Questions-Type in document 1. What is the dependent variable? 2. What is the independent variable? 3. What was the average thickness of annual rings for 40 year old trees in Forest A? 4. Based on the data shown, what can be concluded about the comparative health of Forest A & B? 5. What type of relationship (constant, direct, or indirect) exists between the age of trees and the average thickness of the tree’s rings? Explain.
On Google Sheets/Excel 1. Go to your Google Drive 2. Click “new” 3. Click “Google Sheet” in the drop down menu 4. Name your file 5. Enter your data (x-axis in the first column and y-axis in the next column) 6. Select your data 7. Click “Insert” 8. Choose the appropriate chart type based on the data 9. Make sure your graph has a title, legend, and axis labels 1. If not, right hand mouse click the graph to make the necessary changes
Graphing Practice Assignment ■ In google classroom, locate the In-class graphing practice assignment ■ Click on the assignment ■ Create a google sheet and title: In-Class Graphing Practice ■ Type in the data table (on the next slide) ■ Create the appropriate graph ■ You need to have a graph title, labeled axis, and a legend ■ You will submit this to google classroom after we are finished
Practice-As a class 1. Open Google Sheets 2. Using the data, identify the independent and dependent variables 3. Input your data (independent in first column, dependent in second column) 4. Select the correct type of graph 5. Make sure the graph has a title, axis are labeled, and there is a legend
Practice-As a class 1 15 18 21
Practice Problems ■ On the handout located on classroom, finish practice problems #2 -3, 5 and the google sheets graphing problems ■ Due on classroom by Thursday at the end of class ■ Finish Early? Vocab!