Session 3 Understanding Data and Ways to Systematically


- Slides: 31
Session 3: Understanding Data and Ways to Systematically Collect Data SHS Mass Training of Teachers, Practical Research 2
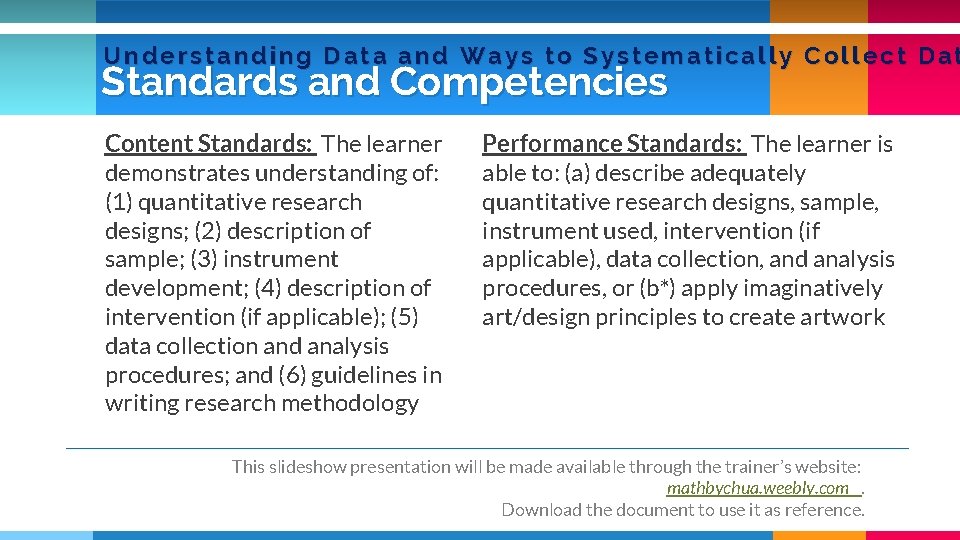
Understanding Data and Ways to Systematically Collect Dat Standards and Competencies Content Standards: The learner demonstrates understanding of: (1) quantitative research designs; (2) description of sample; (3) instrument development; (4) description of intervention (if applicable); (5) data collection and analysis procedures; and (6) guidelines in writing research methodology Performance Standards: The learner is able to: (a) describe adequately quantitative research designs, sample, instrument used, intervention (if applicable), data collection, and analysis procedures, or (b*) apply imaginatively art/design principles to create artwork This slideshow presentation will be made available through the trainer’s website: mathbychua. weebly. com. Download the document to use it as reference.
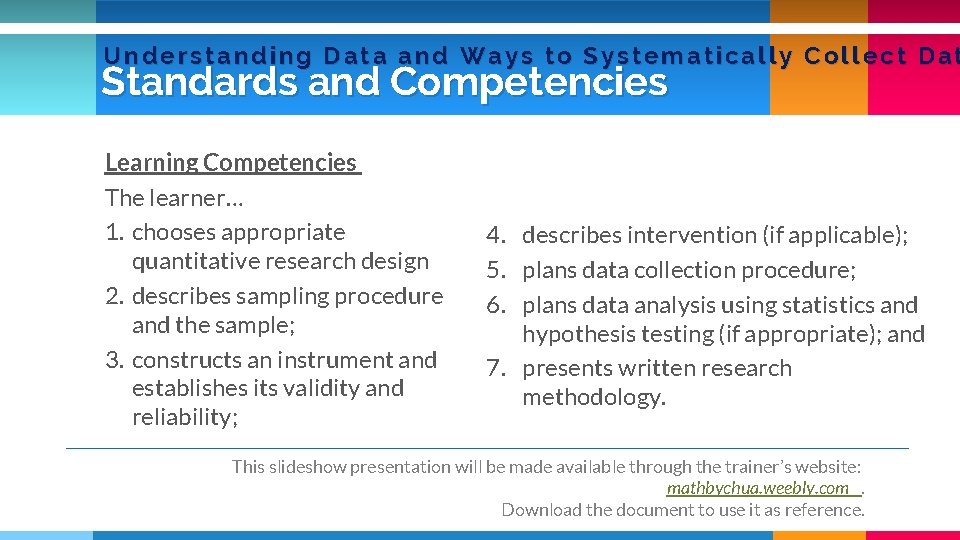
Understanding Data and Ways to Systematically Collect Dat Standards and Competencies Learning Competencies The learner… 1. chooses appropriate quantitative research design 2. describes sampling procedure and the sample; 3. constructs an instrument and establishes its validity and reliability; 4. describes intervention (if applicable); 5. plans data collection procedure; 6. plans data analysis using statistics and hypothesis testing (if appropriate); and 7. presents written research methodology. This slideshow presentation will be made available through the trainer’s website: mathbychua. weebly. com. Download the document to use it as reference.
Chapter Content Chapter III METHODOLOGY Research Design The Sample The Instruments Intervention Data Collection Procedure
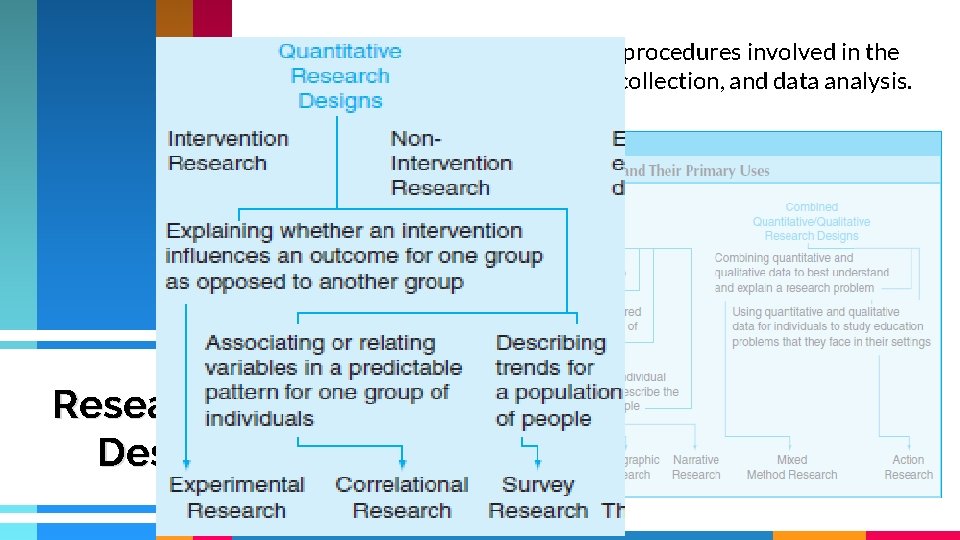
Research designs are the specific procedures involved in the research process: sampling, data collection, and data analysis. Research Design
The first step leading to the process of collecting quantitative data is to identify the people and places you plan to study. This involves determining which group of people will you study, who, specifically, these people are, and how many of them you will need to involve. The Sample Identifying the representative group that will take part in the study is an important aspect of the research that you need to specify.
ü description of the subjects, number, and grade level (for students), naming school and its location, unless with confidentiality conditions. Otherwise, only location, type, and size of school are stated; ü number of classes, class size, and number of teachers are indicated; ü how students and teachers are selected (sampling procedure) is described. ü After data collection, put actual sample: sample size, distribution of subjects by sex and average age. The Sample ü If applicable, describe relevant characteristics of teachers like sex, teaching experience, educational attainment, and related training.
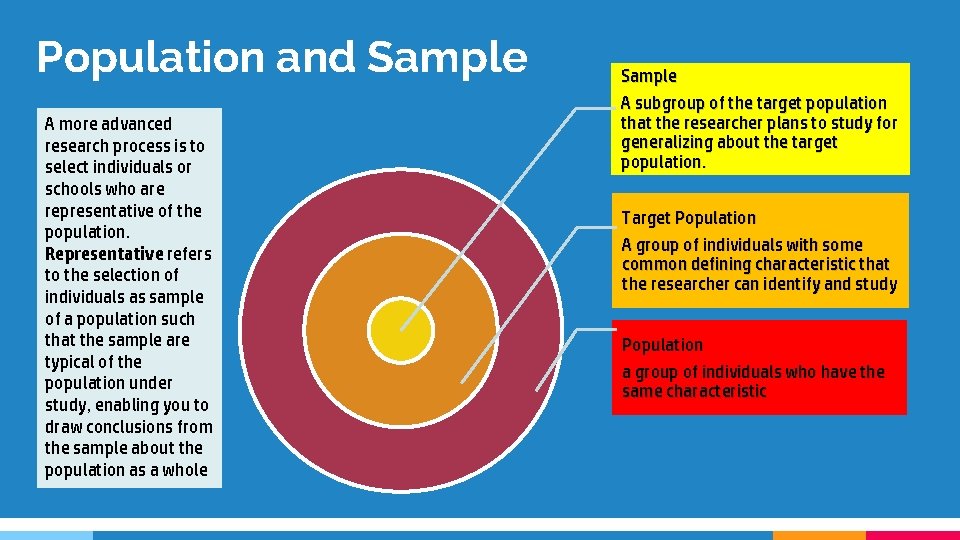
Population and Sample A more advanced research process is to select individuals or schools who are representative of the population. Representative refers to the selection of individuals as sample of a population such that the sample are typical of the population under study, enabling you to draw conclusions from the sample about the population as a whole Sample A subgroup of the target population that the researcher plans to study for generalizing about the target population. Target Population A group of individuals with some common defining characteristic that the researcher can identify and study Population a group of individuals who have the same characteristic
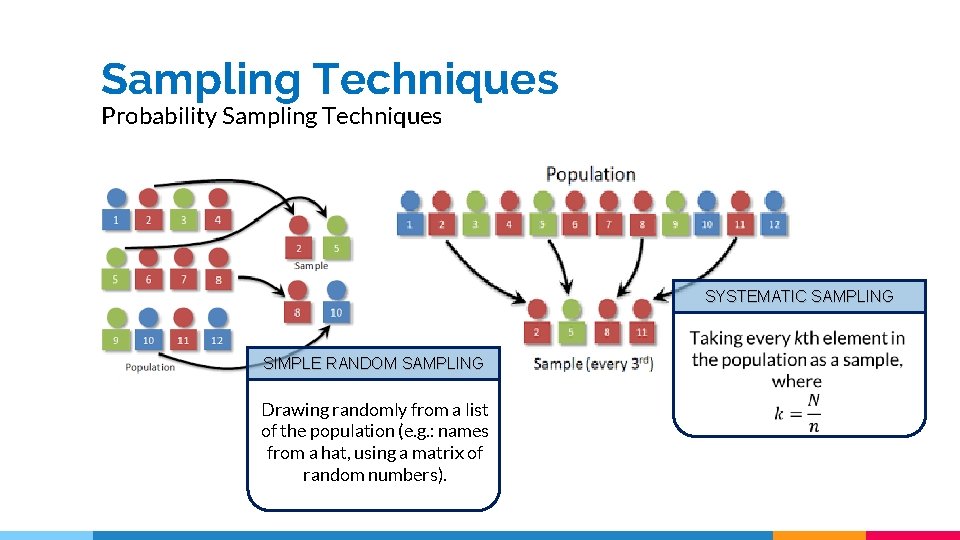
Sampling Techniques Probability Sampling Techniques SYSTEMATIC SAMPLING SIMPLE RANDOM SAMPLING Drawing randomly from a list of the population (e. g. : names from a hat, using a matrix of random numbers).
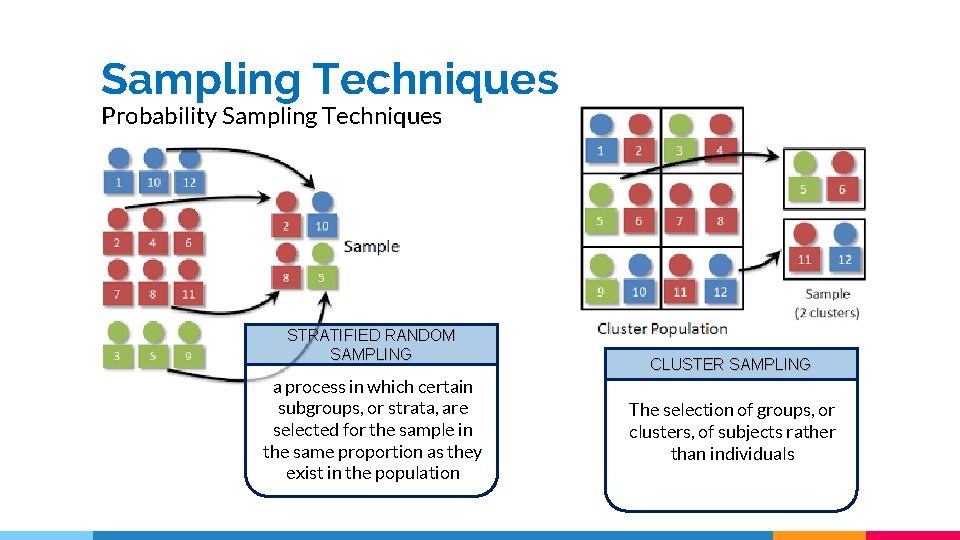
Sampling Techniques Probability Sampling Techniques STRATIFIED RANDOM SAMPLING a process in which certain subgroups, or strata, are selected for the sample in the same proportion as they exist in the population CLUSTER SAMPLING The selection of groups, or clusters, of subjects rather than individuals
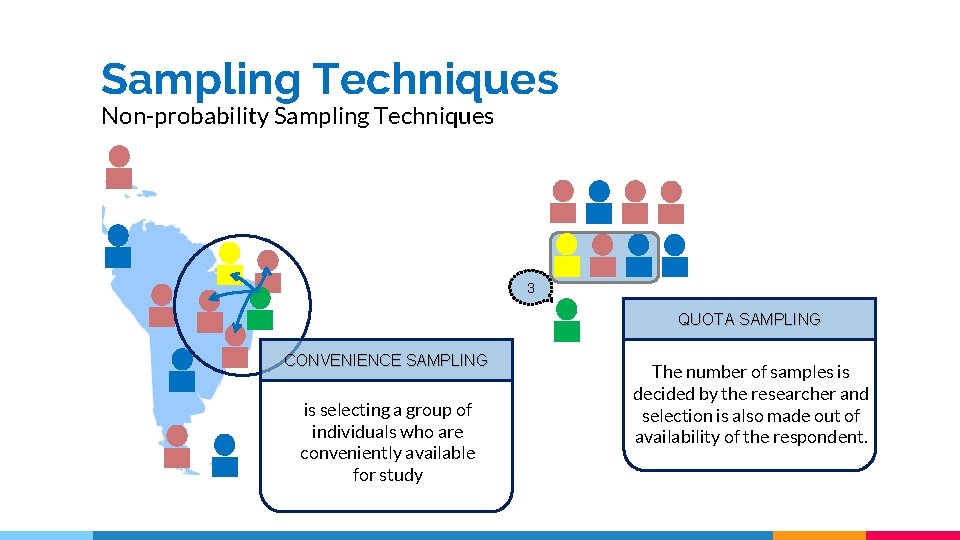
Sampling Techniques Non-probability Sampling Techniques 3 QUOTA SAMPLING CONVENIENCE SAMPLING is selecting a group of individuals who are conveniently available for study The number of samples is decided by the researcher and selection is also made out of availability of the respondent.
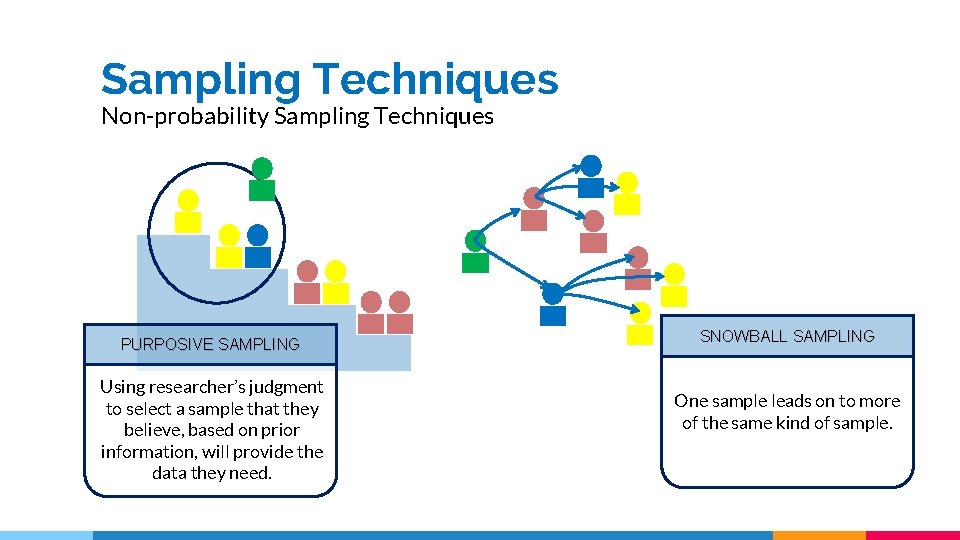
Sampling Techniques Non-probability Sampling Techniques PURPOSIVE SAMPLING Using researcher’s judgment to select a sample that they believe, based on prior information, will provide the data they need. SNOWBALL SAMPLING One sample leads on to more of the same kind of sample.
Think of this A teacher wants to conduct an action research in order to determine the effectiveness of home-based family counseling on the attendance of students. Of her 56 students, she has selected 20 whose residences are within a kilometer’s radius from the school. What sampling technique did the teacher use? Do you agree on the strategy she has employed?
ü This refers to the questionnaire or data gathering tool to be constructed, validated and administered. ü If the instrument is prepared by the researcher, it should be tested for validity and reliability. However, if the instrument is standardized, the student should indicate its description as to its items, scoring and qualification. The Instrument ü The researcher must explain its parts, and how the instrument will be validated. The instrument to be used should be appended (except for standardized).
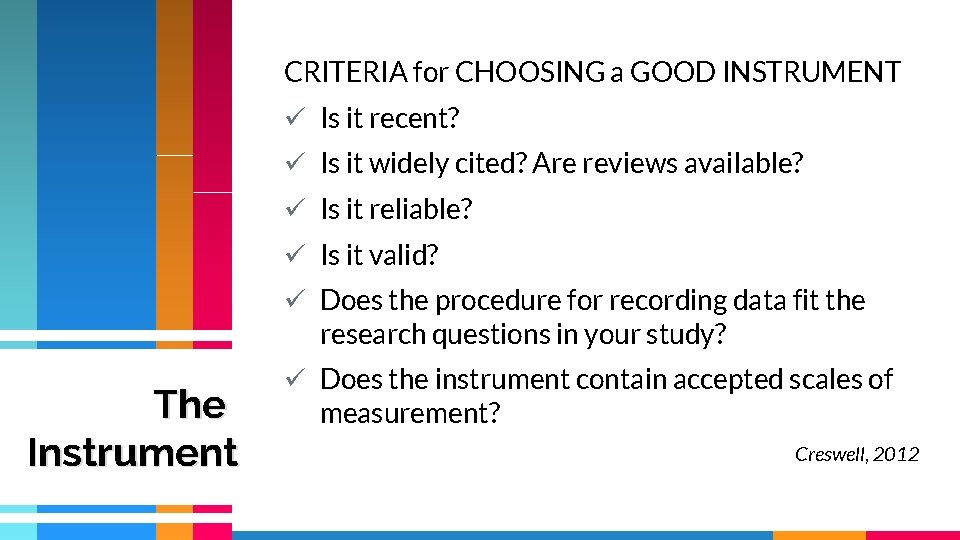
CRITERIA for CHOOSING a GOOD INSTRUMENT ü Is it recent? ü Is it widely cited? Are reviews available? ü Is it reliable? ü Is it valid? ü Does the procedure for recording data fit the research questions in your study? The Instrument ü Does the instrument contain accepted scales of measurement? Creswell, 2012
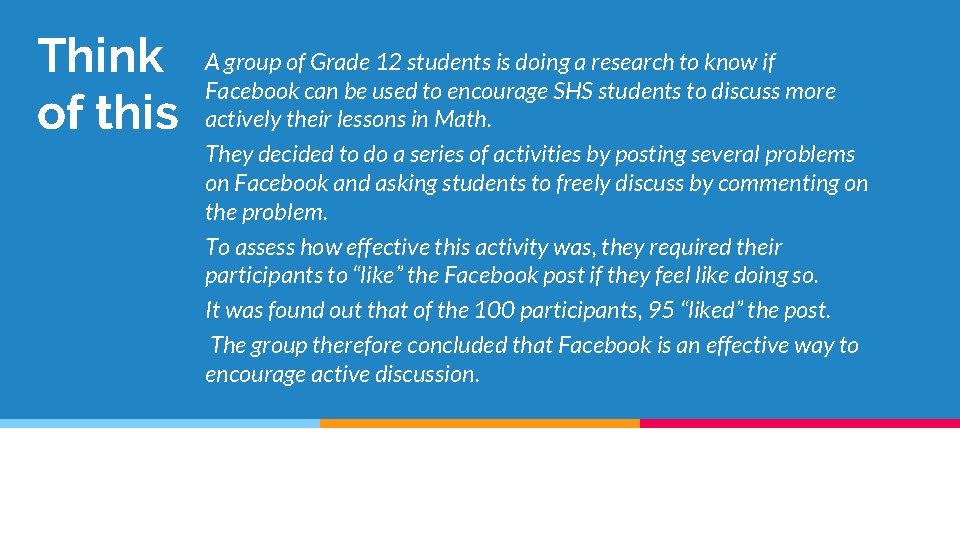
Think of this A group of Grade 12 students is doing a research to know if Facebook can be used to encourage SHS students to discuss more actively their lessons in Math. They decided to do a series of activities by posting several problems on Facebook and asking students to freely discuss by commenting on the problem. To assess how effective this activity was, they required their participants to “like” the Facebook post if they feel like doing so. It was found out that of the 100 participants, 95 “liked” the post. The group therefore concluded that Facebook is an effective way to encourage active discussion.
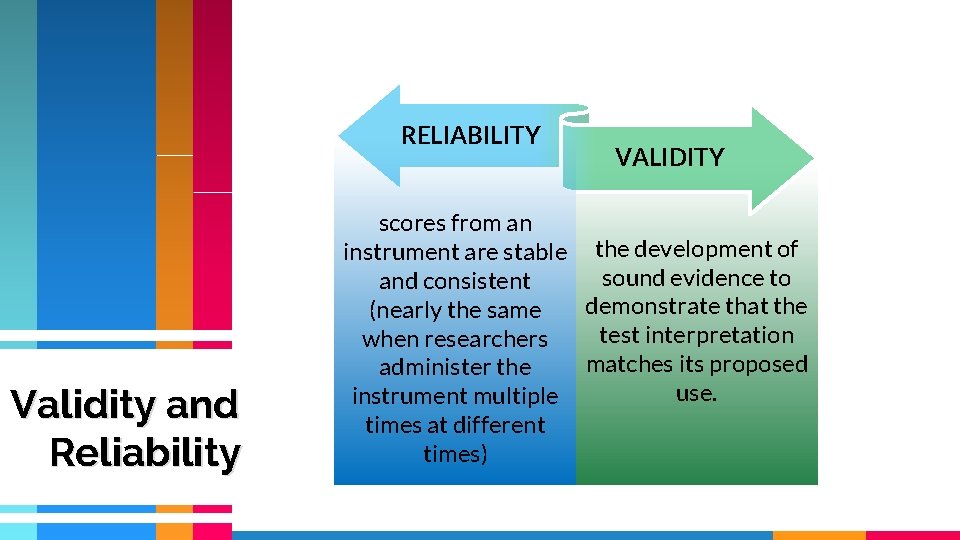
RELIABILITY Validity and Reliability VALIDITY scores from an instrument are stable the development of sound evidence to and consistent demonstrate that the (nearly the same test interpretation when researchers matches its proposed administer the use. instrument multiple times at different times)
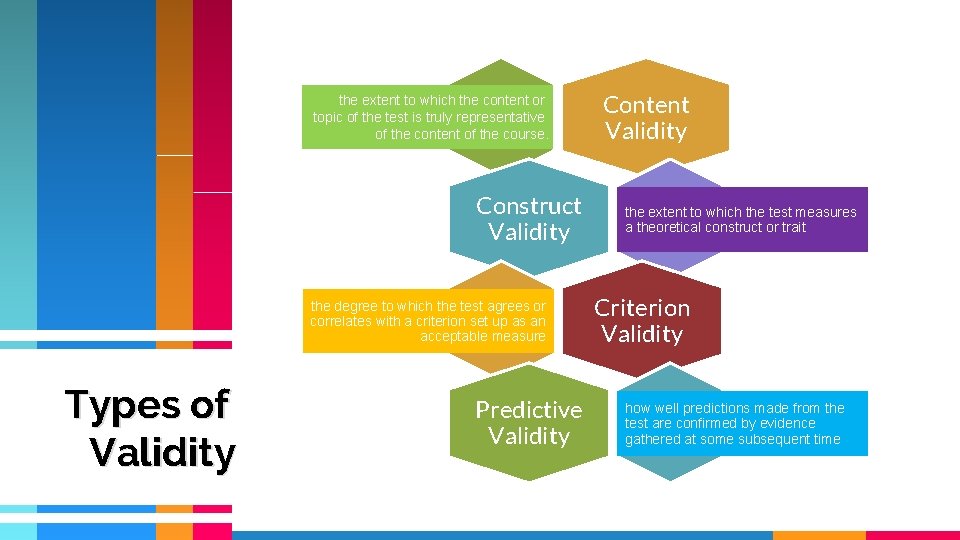
the extent to which the content or topic of the test is truly representative of the content of the course. Construct Validity the degree to which the test agrees or correlates with a criterion set up as an acceptable measure Types of Validity Predictive Validity Content Validity the extent to which the test measures a theoretical construct or trait Criterion Validity how well predictions made from the test are confirmed by evidence gathered at some subsequent time
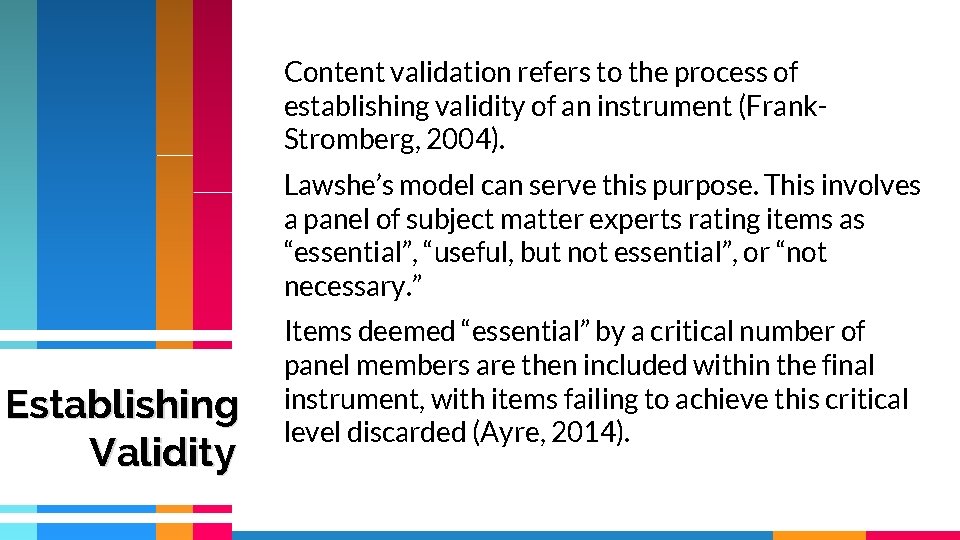
Content validation refers to the process of establishing validity of an instrument (Frank. Stromberg, 2004). Lawshe’s model can serve this purpose. This involves a panel of subject matter experts rating items as “essential”, “useful, but not essential”, or “not necessary. ” Establishing Validity Items deemed “essential” by a critical number of panel members are then included within the final instrument, with items failing to achieve this critical level discarded (Ayre, 2014).
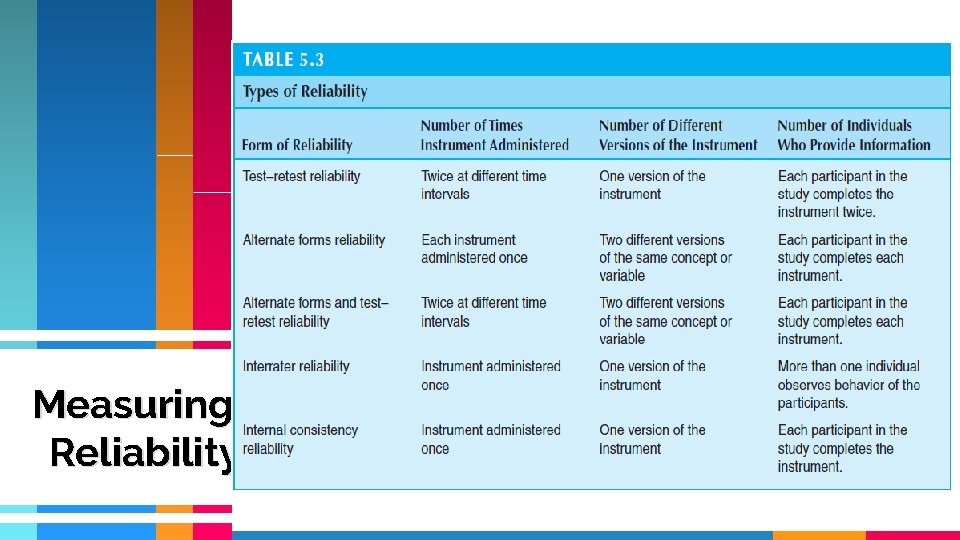
Measuring Reliability
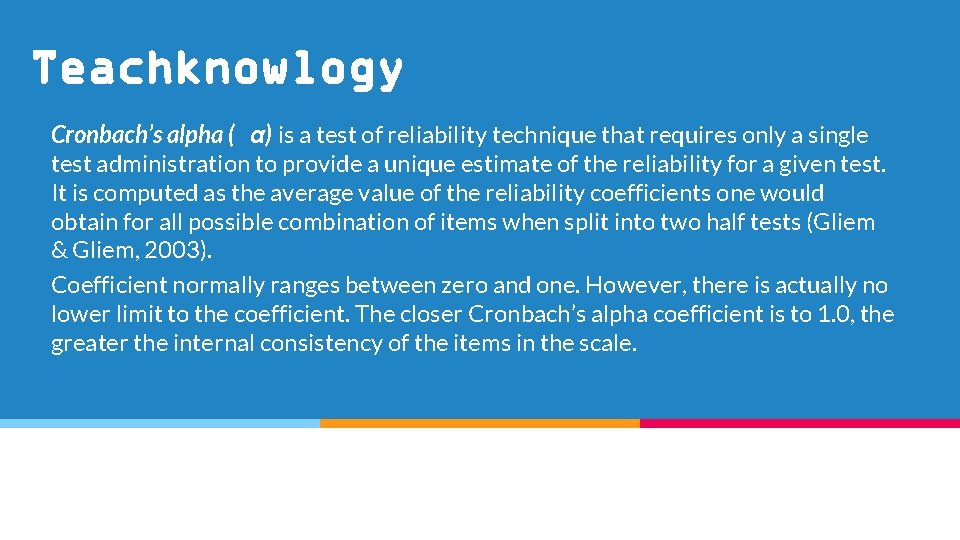
Teachknowlogy Cronbach’s alpha ( α) is a test of reliability technique that requires only a single test administration to provide a unique estimate of the reliability for a given test. It is computed as the average value of the reliability coefficients one would obtain for all possible combination of items when split into two half tests (Gliem & Gliem, 2003). Coefficient normally ranges between zero and one. However, there is actually no lower limit to the coefficient. The closer Cronbach’s alpha coefficient is to 1. 0, the greater the internal consistency of the items in the scale.
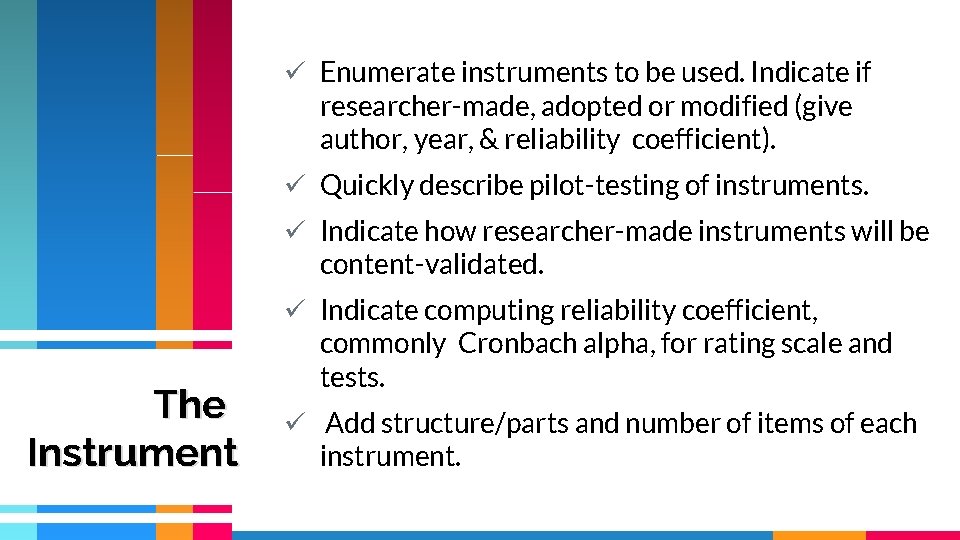
ü Enumerate instruments to be used. Indicate if researcher-made, adopted or modified (give author, year, & reliability coefficient). ü Quickly describe pilot-testing of instruments. ü Indicate how researcher-made instruments will be content-validated. The Instrument ü Indicate computing reliability coefficient, commonly Cronbach alpha, for rating scale and tests. ü Add structure/parts and number of items of each instrument.
ü Add Table of Specifications for researcher-made tests. ü Add details of content validation: who the experts are without naming them. ü Add details of pilot-testing (when and who), and describe group (similar to group to which instruments will be eventually administered). The Instrument
ü Clearly and completely describe how the intervention will be implemented, such that the reader can replicate the intervention. ü Describe what happens in comparison group. The Intervention
ü Quickly describe whose permission will be sought and arrangements to make to administer instruments. ü Describe when instruments will be administered and who will administer them. Data Collection Procedure ü Add details on arrangements and administration of instruments, if needed.
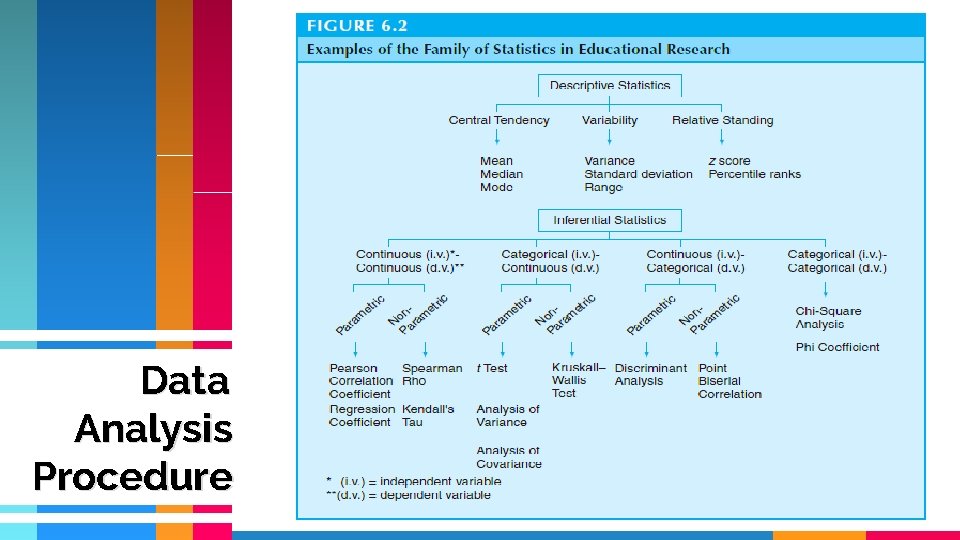
This section indicates how the data will be analyzed and reported; it should specify the qualitative and/or quantitative methods that will be used in analyzing the data gathered for the research. In writing this section, ü Describe analysis to be done for each research question, following sequence in Statement of Problem. Data Analysis Procedure ü State if tests of hypotheses will be done and for what purpose. ü Indicate that tests of hypotheses will be done at. 05 level of significance.
ü Level of significance or p value = no. of cases out of 100 cases that results are due to chance alone. ü Add scoring system for instruments. ü Avoid giving formulas or standard procedures for statistical tools (reader is expected to know these or look them up in statistics references). Data Analysis Procedure
Data Analysis Procedure
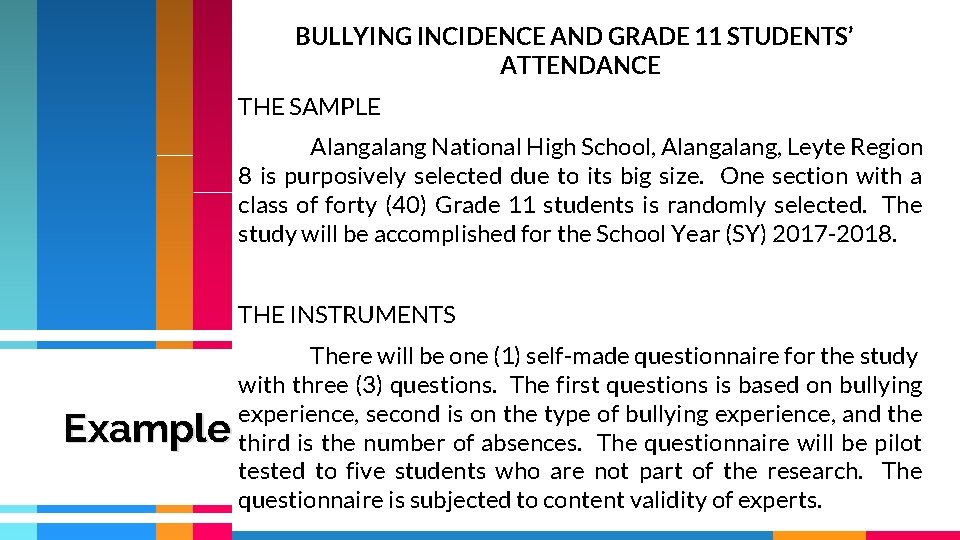
BULLYING INCIDENCE AND GRADE 11 STUDENTS’ ATTENDANCE THE SAMPLE Alangalang National High School, Alangalang, Leyte Region 8 is purposively selected due to its big size. One section with a class of forty (40) Grade 11 students is randomly selected. The study will be accomplished for the School Year (SY) 2017 -2018. THE INSTRUMENTS Example There will be one (1) self-made questionnaire for the study with three (3) questions. The first questions is based on bullying experience, second is on the type of bullying experience, and the third is the number of absences. The questionnaire will be pilot tested to five students who are not part of the research. The questionnaire is subjected to content validity of experts.
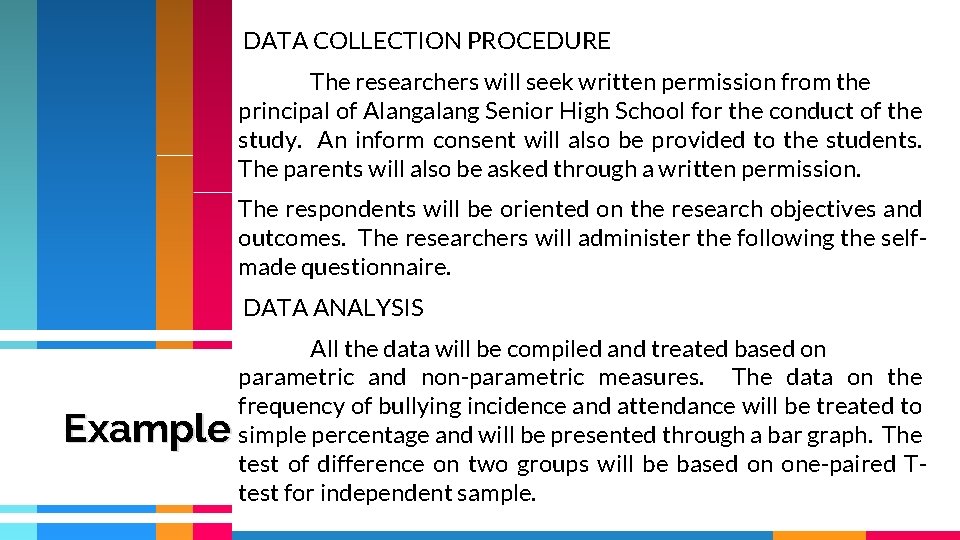
DATA COLLECTION PROCEDURE The researchers will seek written permission from the principal of Alangalang Senior High School for the conduct of the study. An inform consent will also be provided to the students. The parents will also be asked through a written permission. The respondents will be oriented on the research objectives and outcomes. The researchers will administer the following the selfmade questionnaire. DATA ANALYSIS Example All the data will be compiled and treated based on parametric and non-parametric measures. The data on the frequency of bullying incidence and attendance will be treated to simple percentage and will be presented through a bar graph. The test of difference on two groups will be based on one-paired Ttest for independent sample.
WORKSHOP, CHAPTER THREE Methodology Research Design The Sample The Instruments Intervention Data Collection Procedure