
Understanding User Mobility Based on GPS Data Yu

Understanding User Mobility Based on GPS Data Yu Zheng Microsoft Research Asia
Outline • • Introduction Architecture Walk-Based Segmentation Feature Extraction Graph-based post-processing Experiments Conclusion
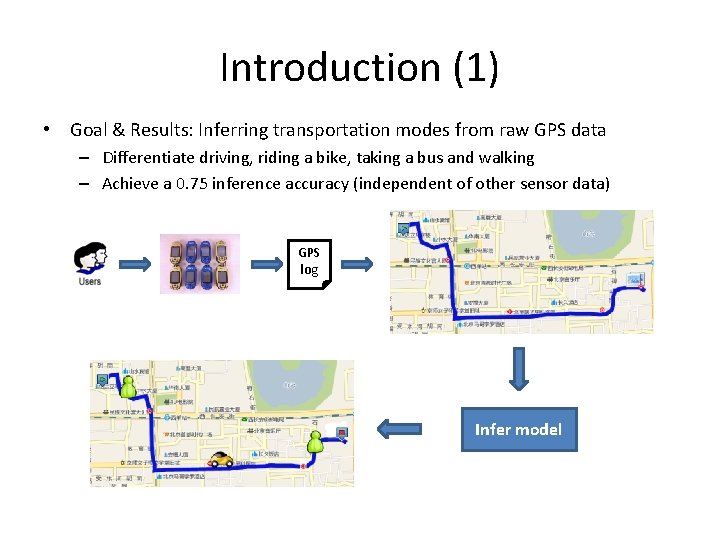
Introduction (1) • Goal & Results: Inferring transportation modes from raw GPS data – Differentiate driving, riding a bike, taking a bus and walking – Achieve a 0. 75 inference accuracy (independent of other sensor data) GPS log Infer model
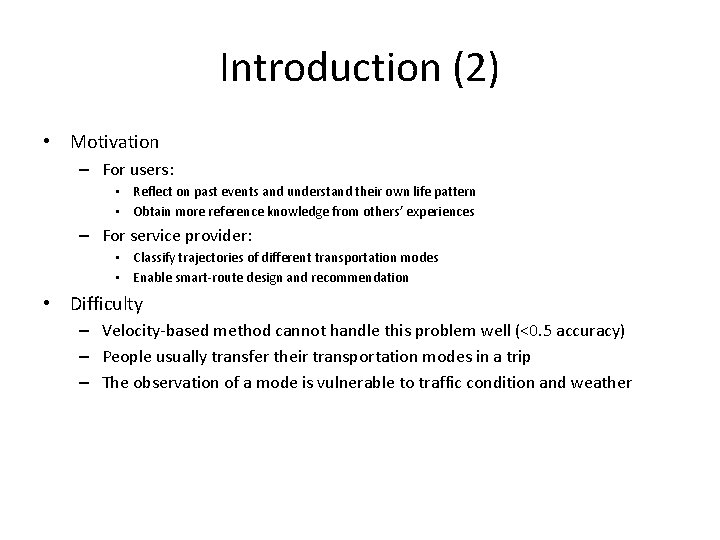
Introduction (2) • Motivation – For users: • Reflect on past events and understand their own life pattern • Obtain more reference knowledge from others’ experiences – For service provider: • Classify trajectories of different transportation modes • Enable smart-route design and recommendation • Difficulty – Velocity-based method cannot handle this problem well (<0. 5 accuracy) – People usually transfer their transportation modes in a trip – The observation of a mode is vulnerable to traffic condition and weather
Introduction (2) • Contributions and insights – A change point-based segmentation method • Walk is a transition between different transportation modes • Handle congestions to some extent – A set of sophisticated features • Robust to traffic condition • Feed into a supervise learning-based inference model – A graph-based post-processing • Considering typical user behavior • Employing location constrains of the real world • WWW 2008 (first version)
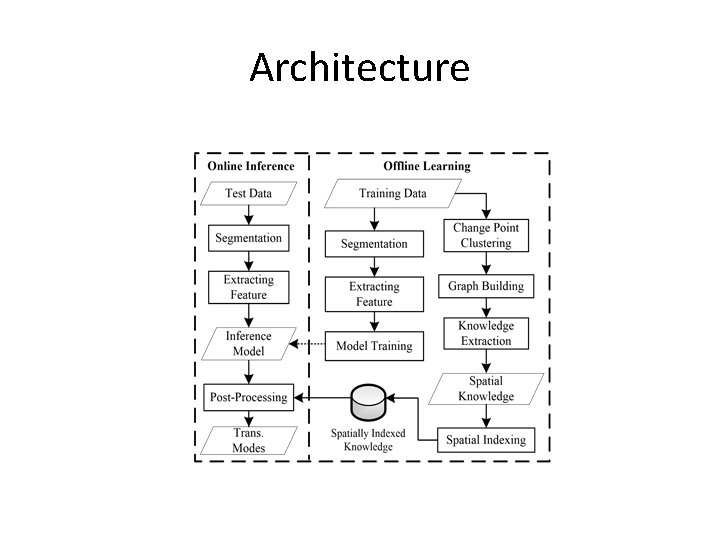
Architecture
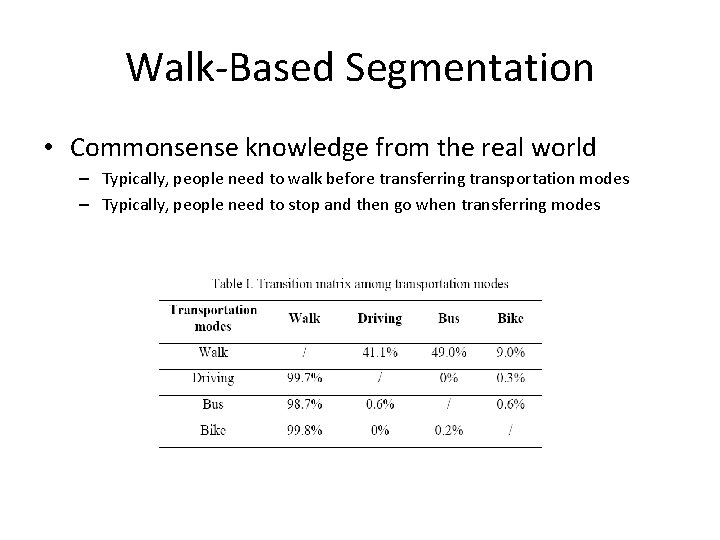
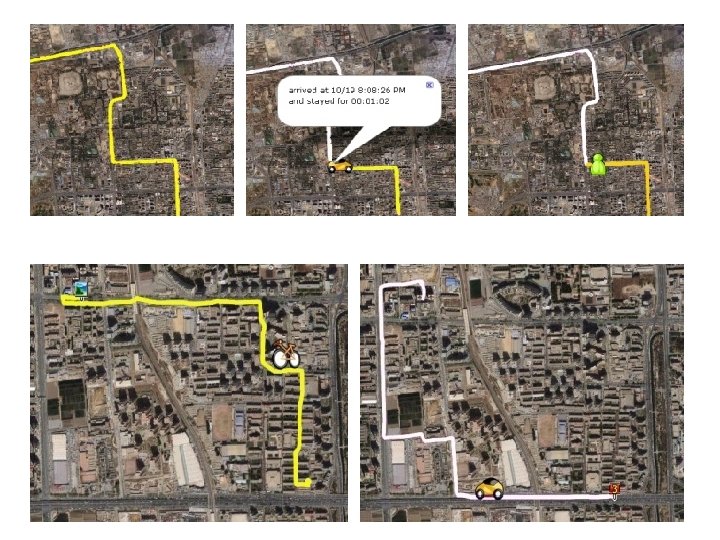
Walk-Based Segmentation • Commonsense knowledge from the real world – Typically, people need to walk before transferring transportation modes – Typically, people need to stop and then go when transferring modes
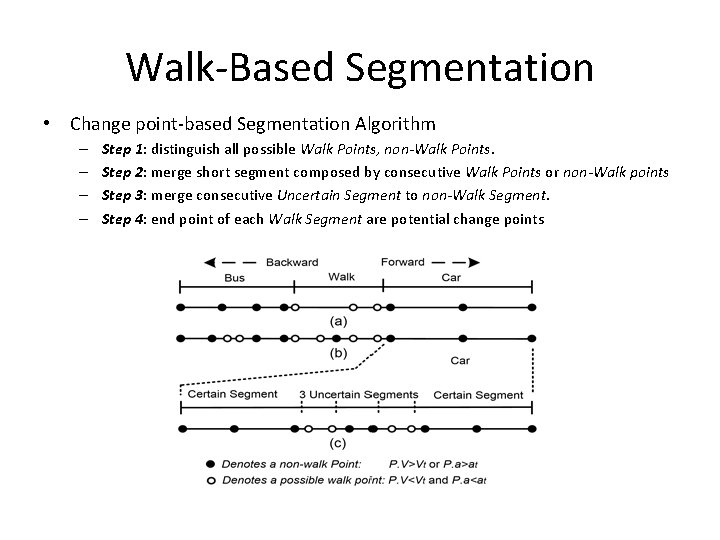
Walk-Based Segmentation • Change point-based Segmentation Algorithm – – Step 1: distinguish all possible Walk Points, non-Walk Points. Step 2: merge short segment composed by consecutive Walk Points or non-Walk points Step 3: merge consecutive Uncertain Segment to non-Walk Segment. Step 4: end point of each Walk Segment are potential change points
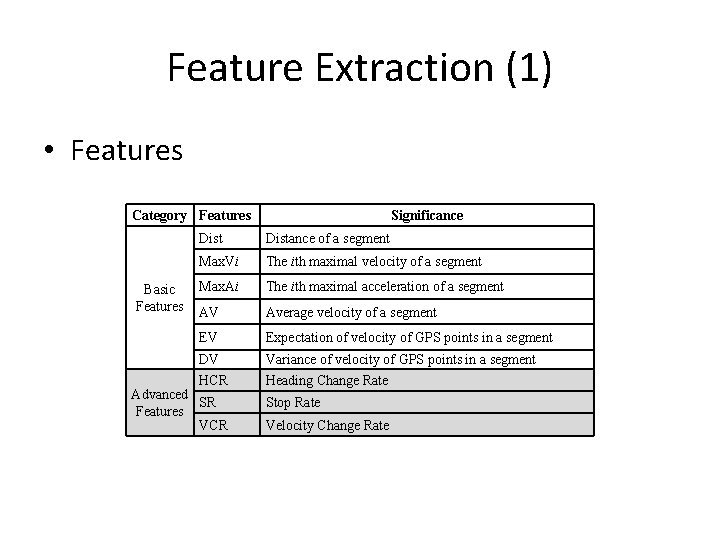
Feature Extraction (1) • Features Category Features Basic Features Significance Distance of a segment Max. Vi The ith maximal velocity of a segment Max. Ai The ith maximal acceleration of a segment AV Average velocity of a segment EV Expectation of velocity of GPS points in a segment DV HCR Variance of velocity of GPS points in a segment Heading Change Rate Advanced SR Features VCR Stop Rate Velocity Change Rate
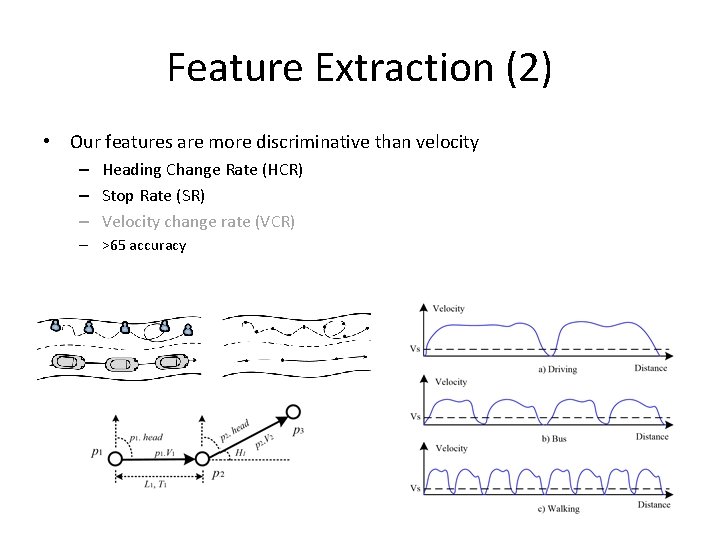
Feature Extraction (2) • Our features are more discriminative than velocity – Heading Change Rate (HCR) – Stop Rate (SR) – Velocity change rate (VCR) – >65 accuracy
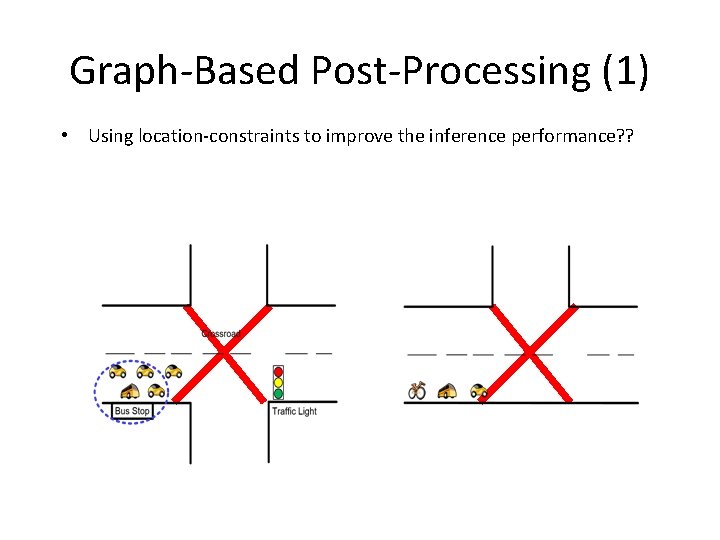
Graph-Based Post-Processing (1) • Using location-constraints to improve the inference performance? ?
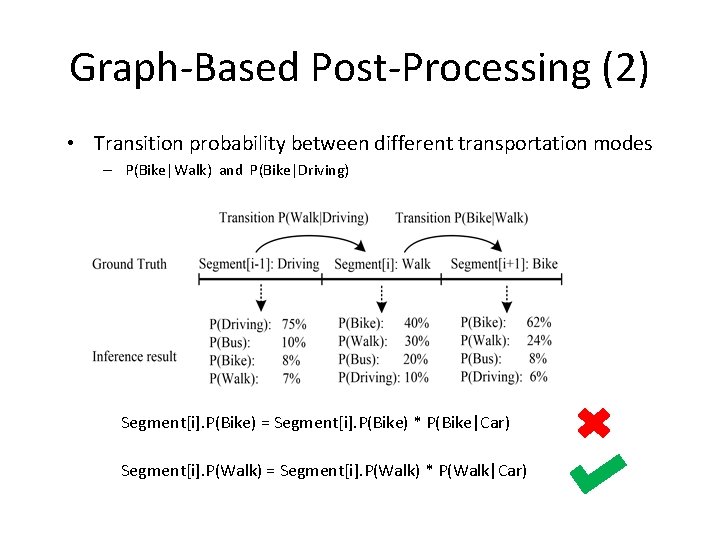
Graph-Based Post-Processing (2) • Transition probability between different transportation modes – P(Bike|Walk) and P(Bike|Driving) Segment[i]. P(Bike) = Segment[i]. P(Bike) * P(Bike|Car) Segment[i]. P(Walk) = Segment[i]. P(Walk) * P(Walk|Car)
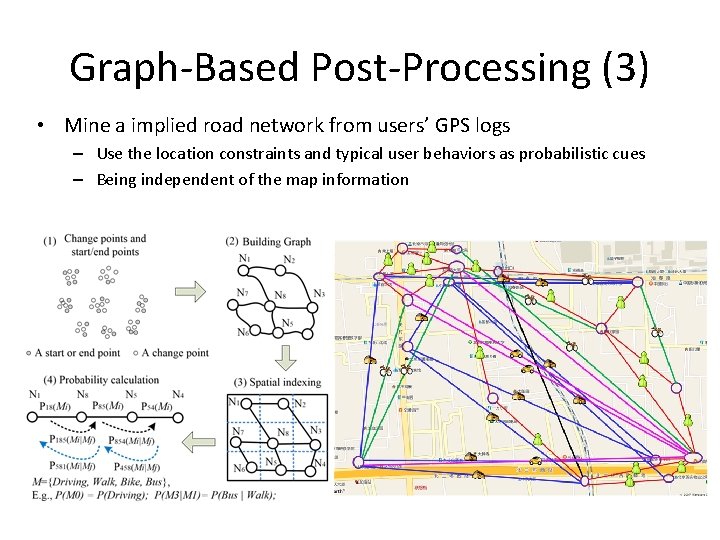
Graph-Based Post-Processing (3) • Mine a implied road network from users’ GPS logs – Use the location constraints and typical user behaviors as probabilistic cues – Being independent of the map information
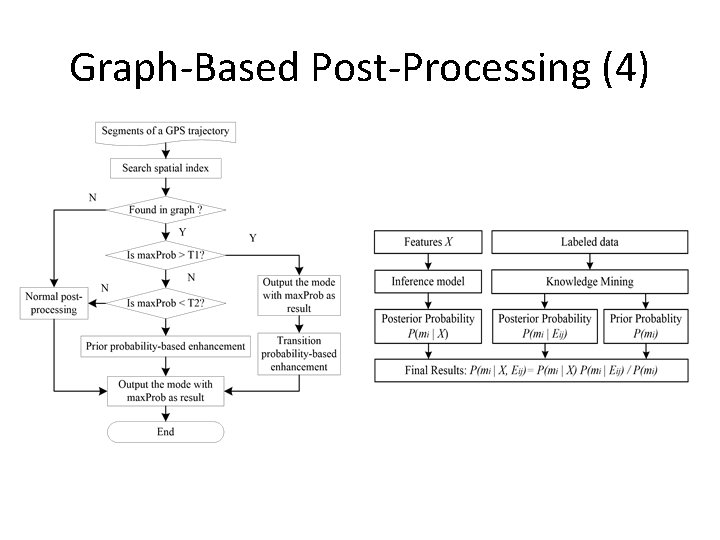
Graph-Based Post-Processing (4)
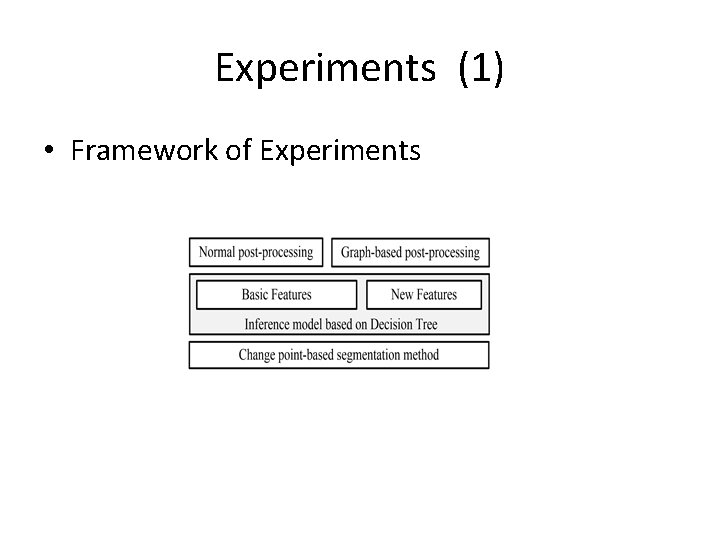
Experiments (1) • Framework of Experiments
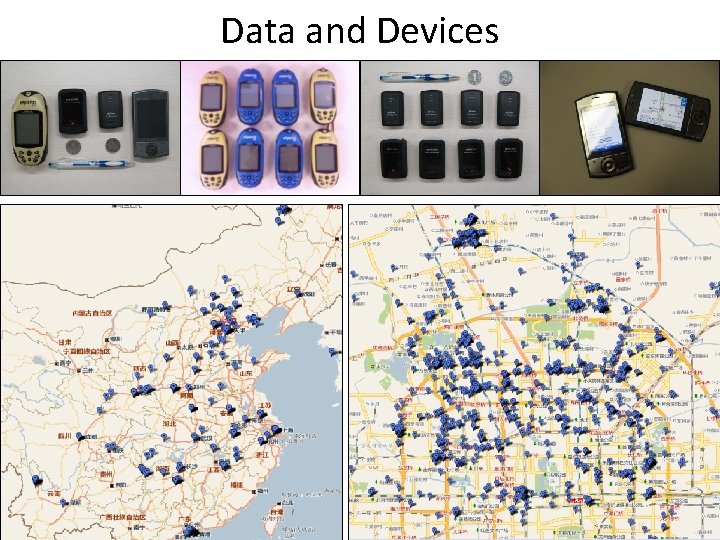
Data and Devices
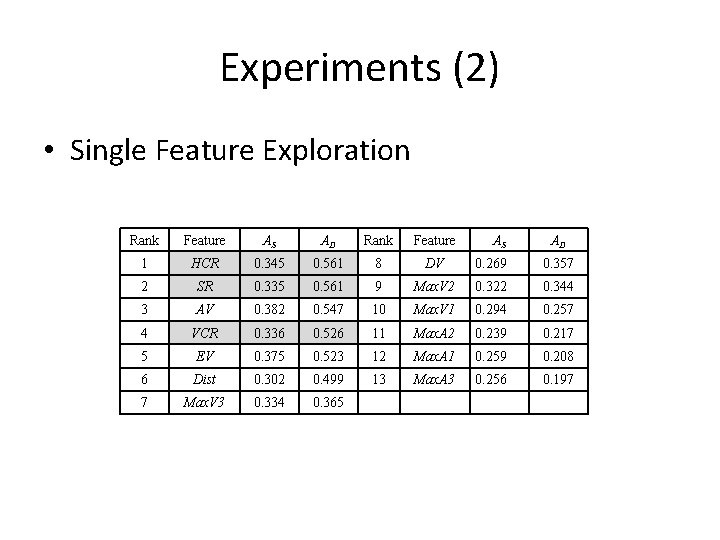
Experiments (2) • Single Feature Exploration Rank Feature AS AD 1 HCR 0. 345 0. 561 8 DV 0. 269 0. 357 2 SR 0. 335 0. 561 9 Max. V 2 0. 322 0. 344 3 AV 0. 382 0. 547 10 Max. V 1 0. 294 0. 257 4 VCR 0. 336 0. 526 11 Max. A 2 0. 239 0. 217 5 EV 0. 375 0. 523 12 Max. A 1 0. 259 0. 208 6 Dist 0. 302 0. 499 13 Max. A 3 0. 256 0. 197 7 Max. V 3 0. 334 0. 365
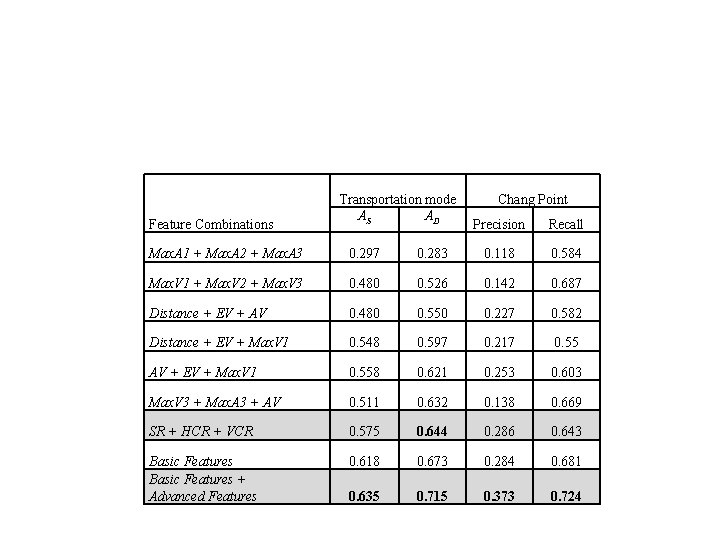
Feature Combinations Transportation mode AS AD Chang Point Precision Recall Max. A 1 + Max. A 2 + Max. A 3 0. 297 0. 283 0. 118 0. 584 Max. V 1 + Max. V 2 + Max. V 3 0. 480 0. 526 0. 142 0. 687 Distance + EV + AV 0. 480 0. 550 0. 227 0. 582 Distance + EV + Max. V 1 0. 548 0. 597 0. 217 0. 55 AV + EV + Max. V 1 0. 558 0. 621 0. 253 0. 603 Max. V 3 + Max. A 3 + AV 0. 511 0. 632 0. 138 0. 669 SR + HCR + VCR 0. 575 0. 644 0. 286 0. 643 Basic Features + Advanced Features 0. 618 0. 673 0. 284 0. 681 0. 635 0. 715 0. 373 0. 724
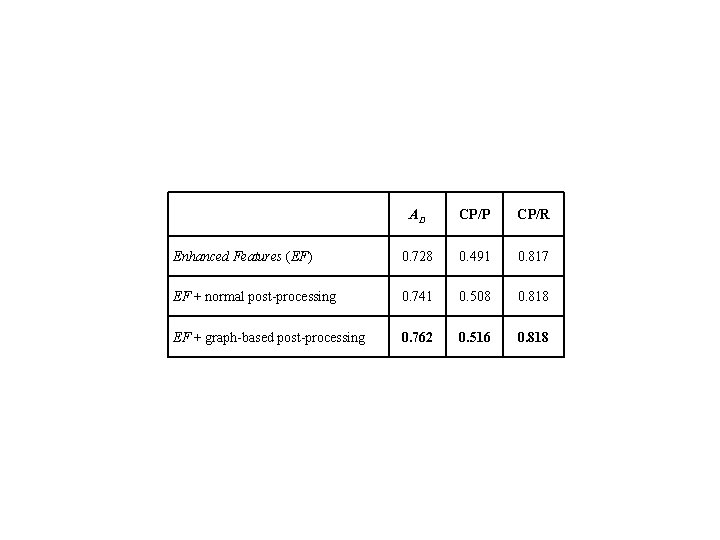
AD CP/P CP/R Enhanced Features (EF) 0. 728 0. 491 0. 817 EF + normal post-processing 0. 741 0. 508 0. 818 EF + graph-based post-processing 0. 762 0. 516 0. 818
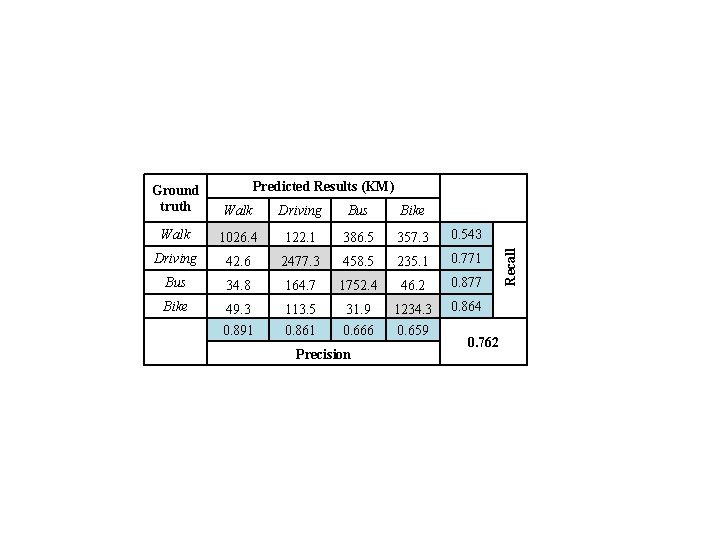
Walk Driving Bus Bike Walk 1026. 4 122. 1 386. 5 357. 3 0. 543 Driving 42. 6 2477. 3 458. 5 235. 1 0. 771 Bus 34. 8 164. 7 1752. 4 46. 2 0. 877 Bike 49. 3 0. 891 113. 5 0. 861 31. 9 0. 666 1234. 3 0. 659 0. 864 Precision 0. 762 Recall Predicted Results (KM) Ground truth
- Slides: 21