KJM 3110 Electrochemistry Chapter 15 Electrochemistry with Periodic


- Slides: 32

KJM 3110 Electrochemistry Chapter 15 Electrochemistry with Periodic Signals Most figures from the textbook we use for the course, via its web resources:

Ch. 14 Other interfaces - Summary

AC voltage and current. Impedance and power. • AC voltage the amplitude can be expressed as • Amplitude U 0 • Peak-to-peak voltage, Up-p = 2 U 0 • Root mean square (rms) voltage Urms = U 0/ 2 = Up-p/(2 2) • Resulting AC current can have a different amplitude and phase angle as a result of the impedance: Impedance Z* = U* / I* Instantaneous power P = U* I* Power integrated over time:

Textbook’s introduction to periodicity • Direct current (DC) vs alternating current (AC) • Sinusoidal case: • Angular frequency is ω = 2πf • Phase angle φ • What is the periodicity P here?

Conductivity cell • Conductivity of the electrolyte • Calibrate the geometrical factors by using a 1 M KCl solution • AC measurement: Current • Will generate voltages over R: over C: Phase shifts? Amplitude ratios?

Faradaic effects of AC. Impedance, harmonics, rectification • Apply AC current, measure AC voltage, or vice versa • Impedance Z (equivalent to resistance R in DC) • Faradaic effects • Apply (small) AC voltage • Reaction • Response on concentrations

Faradaic effects of AC. Impedance, harmonics, rectification • Semi-integration yields • The product and reactant consentrations are shifted -45° and +135°, respectively, i. e. , 180° apart. • Total concentraion close to constant

Relation to voltage – Butler-Volmer • From Ch. 7, a version of the Butler-Volmer equation: Charge transfer resistance Rct Warburg element W (transmission line) R/C = W 2

The Rct. W impedance

The Warburg impedance • W (unit of ohm s-1/2) • Reflects a combination of • Diffusion • Chemical capacitance • Appears in AC circuits to represent the impedance of mass transport • In series with the charge transfer resistance • Imposes a complex impedance ZW(ohm) = W/√(2ω) - j. W/√(2ω) • Has a constant, frequency independent phase shift of –π/4 (-45°)

Reversibility index λ • What we have done here is to perturb a reaction which reacts with kinetic and mass transport limitations (Rct and W, respectively) • Reversible: Rct very small, λ >> 1 • Quasireversible λ ≈ 1 • Irreversible: Rct large, λ << 1. No faradaic periodicity. • Reversibility index for AC impedance

AC impedance measurement • Electrochemical impedance spectroscopy (EIS) • Impedance spectrometer (frequency response analysers) • E. g. Solartron SI 1260 FRA • 0 -3 V rms AC 0. 01 m. Hz – 32 MHz, -42 - +42 V DC • Electrode electrical elements • • Ru Rct W C uncompensated electrolyte resistance (ohmic) charge transfer resistance (kinetics) Warburg impedance (diffusion) Capacitance (double layers)

Deviations from ideality at large perturbations • Small perturbations, linear range (blue) • Near-ideal response • Larger perturbations, non-linear range (red) • Non-ideal response • Rectification • Harmonics • Response cntains features sharper (of frequencies higher) than the perturbation frequency • Overharmonics (integer multiple of perturbation frequency)

AC impedance representations • Impedance has magnitude but also contains a phase angle between E and I • Vector in 2 -dimensional Z space • In-phase and out-of-phase components Z’’ • Real part Z’ • Imaginary part j. Z’’ • Z = Z’ + j. Z’’ or Z* = Z’ + j. Z’’ Z’ Complex numbers j =√-1 or j 2 = -1 • The value of Z – often denoted |Z| – is the length of the vector: Complex conjugate |Z| = √(Z 2) = √(Z’ 2+Z’’ 2) = √(Z’ 2–(j. Z’’)2) = √((Z’+j. Z’’)(Z’-j. Z’’))

Complex impedance Z* and admittance Y* • Z* = U*/I* = Z/ + j. Z// = R + j. X • • Z* Complex impedance |Z| Impedance R Resistance X Reactance • Y* = 1/Z* = I*/U* = Y/ + j. Y// = G + j. B • • Y* Complex admittance |Y| Admittance G Conductance B Susceptance

Impedance and admittance of discrete elements • Series RCL • Z* = Z/ + j. Z// = R + j. X • Parallel (RCL) • Y* = Y/ + j. Y// = G + j. B Resonance for (RC) when G = ωC or C=G/ω or ω=1/(RC)

Y*=1/Z* and Z*=1/Y*

Randles-Erschler circuit • Ru(C(Rct. W))

Build the circuit impedance • Add Rct and W in series, real and imaginary parts separate: • Add C in parallel:

Build the circuit impedance • Add Ru in series (has only real part):

Deconvolute and parameterise the circuit • Low frequencies

«Impedance plots» • Imaginary part Z’’ vs real part Z’ • Or often –Z’’ vs Z’ • Argand diagram • Sluyters plot • Cole-Cole plot • Nyquist plot • Reversible, Rct negligible Harry Nyquist 1889 -1976

The Z semicircle: (RC) • Irreversible • Fast diffusion; W is negligible • Ru(Rct. C) • Forms a semicircle distanced from origo • (Case dominated by W shown as the straight line) • Case with all components significant over a large frequency range • Frequency is a dependent variable

Constant phase elements (CPE) • Constant phase elements (CPE); symbol Q • Mathematically mimics the impedance of real, non-ideal, processes and components; dispersions in time constants • Q has admittance • • n=1 n=0 n = -1 n = 0. 5 Capacitor Conductor/Resistor Inductance Warburg element • Values in between: Intermediate behaviours

A detour to EIS of ceramic electrolytes Some slides from another course

Circuits of actual materials functions and of discrete elements. • Introductory warm-up: • The circuit contains discrete elements representing physical properties of a typical ceramic mixed ionic electronic conductor • Upper rail: Electronic transport rail • Re Electronic conduction (NOTE: No electrode charge transfer resistance assumed for electrons) • Lower rail: Ionic transport rail • • Rb ionic bulk conduction (grain interior) Cg geometric capacitance of the material Rgb grain boundary resistance Qgb grain boundary capacitance element Rct Electrode red-ox reaction charge transfer Cdl Double layer capacitance Rd Diffusion resistance Qd Diffusion-related (chemical) storage • L: inductive element • From sample, wires, and instrument parasitics Draw a sample with microstructure and place the elements What are the assumptions? How does everything add up? Microstructure Equivalent Circuit

Mathematics of some of the parameters • Bulk conductivity • Linear property • Sum of partial conductivity from each charge carrier • Partial conductivity: Charge, concentration, and mobility • Grain boundary transport • Linear property • Dominated by space charge layers • Electrode impedance • Butler-Volmer theory – linear case • Tafel behaviour – non-linear case

Conduction takes many paths • Bulk (grain interior) • Grain boundaries • Series resistance (can be delineated by EIS) • Parallel conductance (can not be delineated by EIS) • Core region • Space charge layers • Enhanced transport on external and internal surfaces • Transport in adsorbed water • Electrode impedance

Measurement, generation, and deconvolution of impedance spectra • Impedance spectra are measured logarithmically • Often from high to low frequency. • We can generate impedance spectra from equivalent circuits • We can deconvolute impedance spectra • Generate partial circuits • fit and subtracted one by one while building up the circuit • Final non-linear least squares (NLLS) fitting of the whole circuit. Use software “Equivalent Circuit” (EQ) or similar. • Notation: Each level of parenthesis goes from series to parallel. The start is series by default.

AC voltammetry (qualitative approach only) • «Discriminating against capacitive current» • Superimpose typically 10 m. V AC on e. g. +/150 m. V DC voltammogram • AC current response to AC voltage perturbation • In-phase with voltage is faradaic • Out-of-phase is capacitive • Eh: • R and O both present • maximum in I • minimum in W

Fourier transform voltammetry • Not curriculum • Fourier transforms convert between frequency and time domains • Example: • An impedance spectrum reflects a circuit’s transient current-voltage relationships in the frequency domain • In the current interruption technique, we polarise the circuit to steady state current, then interrupt it so that current is zero while the voltage decays from all capacitances over the respective resistors. The decay curve contain all the same information, from high to low frequencies, as the impedance spectrum. • One can generate the other and vice versa by fourier transforms.

Summary Ch. 15 Electrochemistry with Periodic Signals
 Chapter 6 the periodic table and periodic law
 Chapter 6 periodic table
 Chapter 5 periodic law
 Pluronic rpe 1720
 Cornell cs 3110
 C.tech collections
 What is the 8-bit unsigned binary result of 5610 − 3110?
 Boletin 3110
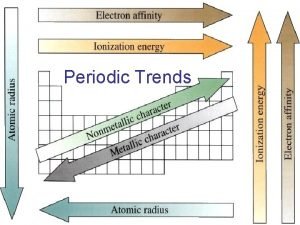
 Periodic table trends
 15/999 mass street periodic table, o 8
 Ap chemistry chapter 18 electrochemistry test
 Introduction of electrochemistry
 Ap chem electrochemistry review
 Chapter 21 electrochemistry
 Voltaic vs electrolytic cell
 Electrons flow from anode to cathode
 Faraday's constant
 Transport no. in electrochemistry
 Electrochemistry tutorial
 Electrochemistry
 Is electrochemistry
 Electrochemistry balancing equations
 Electrochemistry stoichiometry
 Nernst equation khan academy
 Basic electrochemistry
 Balancing complex redox reactions
 Danielle cell
 What are redox reactions
 Ecell formula
 Interfacial method in electrochemistry
 Electrochemistry eds
 Fundamentals of electrochemistry
 What is electrochemistry
