Ionization Energy Measurements and Spectroscopy of Hf O


- Slides: 16

Ionization Energy Measurements and Spectroscopy of Hf. O and Hf. O+ Jeremy M. Merritt, Vladimir E. Bondybey, and Michael C. Heaven Do. E

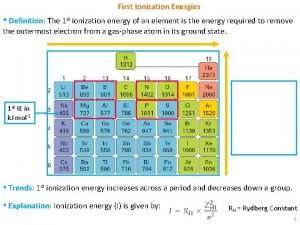
Motivation Previous studies of Th. O ionization revealed unexpected results. Ionization of the molecule weakened the bond (D 0 -D 0+=0. 3 e. V), but the vibrational frequency for the Th. O+ ion was higher ( e+=955 vs. e=896 cm-1) and the bond length was shorter (Re+=1. 807 vs. Re=1. 840 Å). Franck-Condon principle violations were observed in the photoelectron spectrum. Is this unusual behavior of Th. O simply a consequence of the electronic configurations involved or are relativistic effects playing a significant role? A comparison of Hf 2+(6 s 2)O 2 - with Th 2+(7 s 2)O 2 - can be used to probe this question. Ionization energy (IE) measurements by Rauh & Ackerman indicate that D 0(Hf. O)>D 0(Hf. O+). In the present work we obtained an accurate IE and the first spectroscopic constants for Hf. O+.

Ionization makes the Th-O bond weaker but stiffer Th+ + O D 0 IE(Th. O)=6. 6027 e. V IE(Th) + IE(Th)=6. 3067 e. V Hence, the Th. O+ bond is weaker Th + O D 0 -D 0+=0. 296 e. V but its vibrational frequency is higher IE(Th. O) D 0 Th. O+ e /cm-1 895. 77 954. 97

Experimental Techniques LIF REMPI & ZEKE Pulsed laser vaporization of metal samples. Laser induced fluorescence spectroscopy of neutral species. Two color resonance enhanced multi-photon ionization spectroscopy with mass selection. Pulsed-field ionization zero kinetic energy photoelectron spectroscopy

Multi-Photon Ionization Processes Pulsed electric field Hf. O+ + e- hv 2 hv 1 Hf. O* Hf. O REMPI PIE ZEKE MATI

Time-of-flight mass spectrum showing the products from pulsed laser ablation of Hf Isotopes Hf 174 176 177 178 179 180 % 0. 2 5. 3 18. 6 27. 3 13. 6 35. 1 (Hf)n+ clusters up to n=6 are observed, as well as signals due to (Hf)n. O+, upon non-resonant ionization with 193 nm light. The inset shows a higher resolution mass spectrum recorded with a longer flight tube to aid in separating the 6 naturally occurring isotopes of Hf. Resonant excitation of the G-X band of Hf. O has been used in this case. The peaks observed when the gas pulse is turned off are due to background impurity molecules.

Laser induced fluorescence spectrum for jet-cooled Hf. O Survey scan in the region of the E-X and F-X bands systems of Hf. O. The peak marked with a † is assigned to the D X 4 -0 transition. Sequence band transitions marked with a ‡ have been tentatively assigned as originating from a metastable triplet state. Peaks marked with an asterisk are due to atomic Hf.

Hf. O Comparison of LIF and REMPI spectra G 1 S (v=0) – X 1 S (v=0) Hf 174 176 177 178 179 180 % 0. 2 5. 3 18. 6 27. 3 13. 6 35. 1

IE=63760 cm-1 Two-color photoionization of Hf. O Photoionization efficiency (PIE) spectra for Hf. O recorded with the first laser tuned to the P(3) line of the F(0+) (v’=0) X 1 S(v”=0) band at 27353 cm-1. The insert shows part of the spectrum recorded under higher resolution illustrating the sharp resonance structure above the ionization threshold. The different traces in the inset correspond to gating on the different isotopomers of Hf. O+.

Vibrationally resolved photoelectron spectrum for Hf. O Tv+ = Te + e(v+1/2) – exe(v+1/2)2 e = 1017. 7 cm-1 exe = 3. 2 cm-1 No evidence for excited electronic states Excitation via F 1 S (v=2) X 1 S (v=0)

Rotationally resolved photoelectron spectrum for Hf. O Rotational structure confirms that the electronic ground state for Hf. O+ is X 2 S+. Rotational constant for the ion is B 0+ = 0. 403(5) cm-1 1. 687(3) Å

IE for Hf. O is greater than the literature value Electron impact PFI-ZEKE 6. 1(1) U 6. 194 5. 6(1) UO 6. 031 5. 6(1) Th 6. 307 6. 1(1) Th. O 6. 604 6. 65(10) Hf 6. 825 7. 55(10) Hf. O 7. 917

Electronic structure calculations for Hf. O and Hf. O+ Hf = ECP 60 MWB (8 s 7 p 6 d 2 f 1 g)/[6 s 5 p 3 d 2 f 1 g] Hf: 5 s 2 5 p 6 5 d 2 6 s 2 O = aug-cc-p. VTZ Molpro

Computed properties of Hf. O and Hf. O+ All constants are given in cm-1 units except for the ionization energy which is in e. V. B 0 HF. 39171 MP 2. 38566 CISD. 39350 CCSD. 39017 B 0+ . 40959 . 39473 . 40807 . 40422 DG 1/2 1036. 69 989. 67 1043. 11 1024. 93 DG 1/2+ 1112. 78 1004. 54 1099. 09 1077. 03 IE 6. 7810 7. 5466 7. 3037 7. 361 e 7. 374 c, e 7. 6687 IE CASSCFd MRCISD(Q) CCSDT 6. 480 c, e 7. 357 c, e 7. 631 c, e 7. 755 c, e CCSD(T). 38475. 38775 b. 38180 c. 39722. 40061 b. 39432 c 988. 62 989. 56 b 976. 76 c 1027. 35 1030. 19 b 1015. 81 c 7. 7365 7. 7371 b 7. 7485 c 7. 753 c, e B 3 LYP. 38242 Expa 0. 386537(7) . 39601 0. 403(5) 969. 75 974. 09 1019. 79 1013(1) 7. 7286 7. 91687(10)

Comparison of measured properties for Hf. O and Th. O Hf. O/Hf. O+ Th. O/Th. O+ IE(e. V) 7. 91687 6. 6026 D 0 -D 0+ (e. V) 1. 092 0. 2957 e+(cm-1) 1017. 7 954. 97 e 974. 09 859. 77 Be + 0. 403 0. 3451 Be 0. 3865 0. 3326 Both Hf. O and Th. O exhibit MO+ bonds that are weaker and stiffer than those of the neutral molecules. This behavior is associated with the ns 2 (n-1)d 2 configuration of the metal atom.

Conclusions The Hf. O IE measured by PFI-ZEKE is 0. 37 e. V higher than previous estimates from electron impact measurements. The Hf-O bond is weakened by ionization. However, the bond length contracts and the vibrational frequency increases. This is the same as the anomalous behavior observed for Th. O. Franck-Condon violations observed in the photoelectron spectrum of Th. O were not present in the spectra for Hf. O. This difference is attributed to a mixing of ionic and neutral states of Th. O which is not possible for the excited levels of Hf. O+.
 Atom radius
 Electronegativity and atomic radius
 Electronegativity trends
 Periodic table.trends
 Group 7 charge
 Whats atomic radius
 What is successive ionisation energy
 Ib chemistry atomic structure
 Ionization potential
 Decreasing metallic character
 Chapter 6 the periodic table
 Largest atomic radius
 Determining ionization energy
 Coulomb's law electronegativity
 First ionization energy of selenium
 Ionization energy snowman
 Which element has the largest atomic radius

