Hydrology CIVL 341 History of Hydrology from Greek


 for")


 The volume of ocean water is 1338 x 106 km")
 In a given year, a catchment with an area of")
 A catchment area of 140 Km 2 received 120 cm of")


")


 Area (km 2) Tammun 322. 3 49 Nablus 642. 6 36")


 is the rate at which water")

 = fc + (f 0 – fc) e-kt - Infiltration start")
 = St 1/2 + Kt Where S is a parameter called")


- Slides: 89
Hydrology CIVL 341
History of Hydrology from Greek: Yδωρ, hudōr, "water"; and λόγος, logos, "knowledge" Definition: Hydrology is a multidisciplinary natural science that deals with the occurrence, properties, distribution and movement of surface and ground – water on the earth (in the natural and man-made environments).
Applications of Hydrology – Designing dams for water supply or hydroelectric power generation; – Designing sewers and urban drainage system; – Designing bridges; – Mitigating and predicting flood, landslide and drought risk; – Providing drinking water; – Designing irrigation schemes and managing agricultural productivity; – Determining the water balance of a region.
Dam
Hydrological Data Sources Data normally required in the hydrological studies are: 1 - Weather record – temp. , humidity, and wind velocity 2 - Stream flow records 3 - Infiltration characteristics of the study area 4 - Soils of the area 5 - Land use and land cover 6 - Ground water characteristics 7 - Water quality data
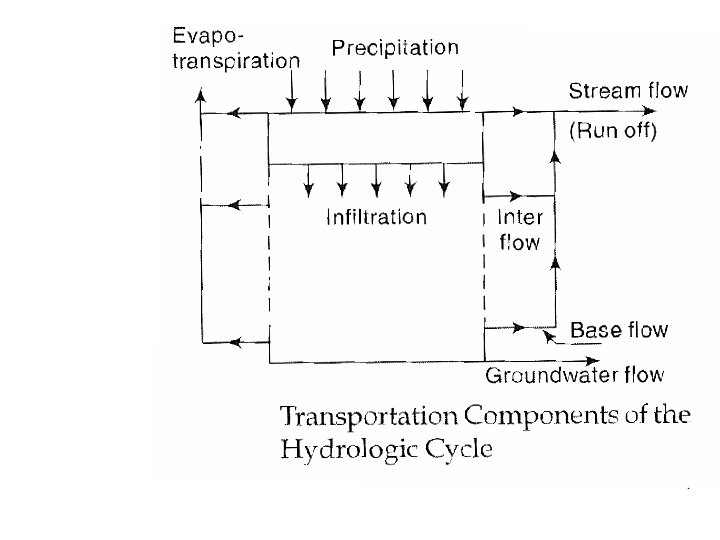
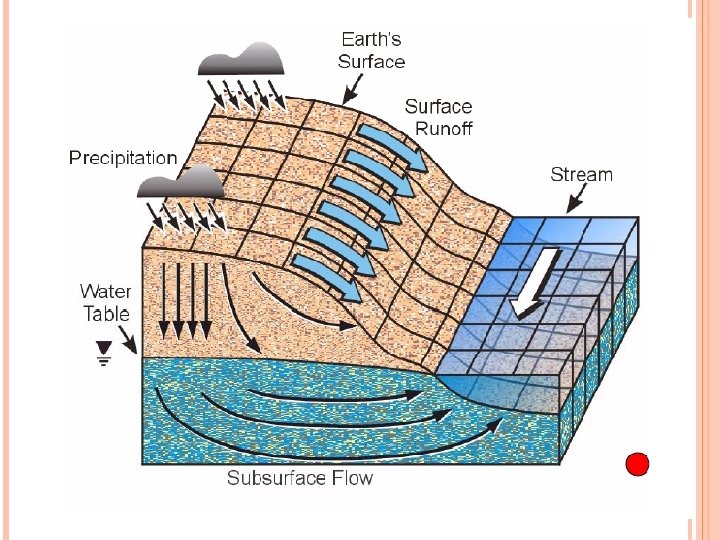
Hydrologic Cycle
The various aspects of water related to the earth can be explained in terms of a cycle known as the hydrologic cycle. Key hydrological cycle processes : a- Evaporation due to the heat energy provided by solar radiation. b- Water vapor moves upward and forms clouds. c- Clouds condense and fall back to the oceans as a rain d- Part of cloud is driven to the land e- Cloud condense and precipitate to the land as a rain f- Part of the precipitation may evaporate back to the atmosphere.
g- Another part of the precipitation may be intercepted by vegetation. h- The remaining part may be evaporate it back to the atmosphere or move down to the ground surface. i- A portion of the water that reaches the ground enters the earths surface through infiltration, enhancing the moisture content of the soil. J- Vegetation sends a portion of the water from under the ground surface back to the atmosphere through the process of transpiration. K- Portion of the precipitation by different paths above and below the surface of the earth reaches the stream channel is called runoff
Once it enters the stream channel , runoff becomes stream flow.
Water Budget Catchment Area : area of land draining into a stream at a given location. Its known also as a drainage area or drainage basin. In US called watershed.
The water balance equation for a catchment: P-R-G-E-T=∆S Or P-R-G-ET=∆S
Where: P: precipitation R: river or surface runoff G: groundwater runoff ( net groundwater flow out of the catchment) E: evaporation T: transpiration ET: evapotranspiration ∆S: storage change in a catchment
The storage S consists of three components as: S= Sc+Ssm+Sg Where : Sc: surface water storage Ssm: water in storage as soil moisture Sg: water in storage as groundwater
Thuse ∆S equal to : ∆S = ∆Sc+ ∆Ssm+ ∆Sg In terms of rainfall- runoff relationship R=P-L Where : L= losses = water not available to runoff due to infiltration (causing addition to soil moisture and ground water storage), evaporation, transpiration and surface storage. The catchment for an interval time ∆t Mass inflow – Mass outflow= ∆S
Ex 1 : The volume of atmospheric water is 12, 900 km 3. The evapotranspiration from land is 72, 000 km 3/year and that from ocean is 505, 000 km 3/year. Estimate the residence time of water molecules in the atmosphere (in days).
Ex 2: A reservoir has the following inflows and outflows (in cubic meters) for the first three months of the year. If the storage at the beginning of January is 60 m 3, determine the storage at the end of March.
Ex 3: A lake had a water surface elevation of 103. 200 m above datum at the beginning of a certain month. In that month the lake received an average inflow of 6. 0 m 3/s from surface runoff sources. In the same period the outflow from the lake had an average value of 6. 5 m 3/s. Further, in that month, the lake received a rainfall of 145 mm and the evaporation from the lake surface was estimated as 6. 10 cm. Write the water budget equation for the lake and calculate the water surface elevation of the lake at the end of the month. The average lake surface area can be taken as 5000 ha and assume that there is no contribution to or from the ground water storage
Ex 4: A small catchment of area 150 ha received a rainfall of 10. 5 cm in 90 minutes due to a storm. At the of the catchment, the stream draining the catchment was dry before the storm and experienced a runoff lasting for 10 hours with an average discharge of 1. 5 m 3/s. The stream was again dry after the runoff event. (a) what is the amount of water which was not available to runoff due to combined effect of infiltration, evaporation and transpiration? (b) What is the ratio of runoff to precipitation?
Ex 5: A river reach had a flood wave passing through it. At a given instant the storage of water in reach was estimated as 15. 5 ha. m. what would be the storage in the reach after interval of 3 hours if the average inflow and outflow during the time period are 14. 2 m 3/s and 10. 6 m 3/s respectively?
Ex 6: A catchment has four sub-areas. The annual precipitation and evaporation from each of the subareas are given below. Assume there is no change in the ground water storage on annual basis. Calculate for the whole catchment the values of annual average (a) precipitation and (b) evaporation. What are the annual runoff coefficients for the sub-areas and for the total catchment taken as a whole?
Assignment 1 1 -) The volume of ocean water is 1338 x 106 km 3. The runoff from rivers is 44. 7 x 10³ km 3/year and the runoff from groundwater is 2. 2 x 10³ km 3/year. The precipitation on the ocean is 1270 mm /year (The ocean area is 361. 3 x 10⁶ km 2). Estimate the residence time of water molecules in the ocean (in years).
Assignment 1 2 -) In a given year, a catchment with an area of 2500 km 2 received 130 cm of precipitation. The average flow rate measured in the river draining the catchment was 30 m 3/s. a) How much runoff reached the river for the year (in m 3)? b) Estimate the amount of water lost due to the combined effects of evapotranspiration and infiltration to groundwater (in m 3)? c) How much precipitation is converted into river runoff (in percentage)?
Assignment 1 3) A catchment area of 140 Km 2 received 120 cm of rainfall in a year. At the outlet of the catchment the flow in the stream draining the catchment was found to have an average rate of 2. 0 m 3/s for 3 months, 3. 0 m 3 /s for 6 months and 5. 0 m 3/s for 3 months. (a) what is the runoff coefficient of the catchment. (b) If the afforestation of the catchment reduces the runoff coefficient to 0. 50, what is the increase in the abstraction from precipitation due to infiltration, evaporation and transpiration, for the same annual rainfall of 120 cm?
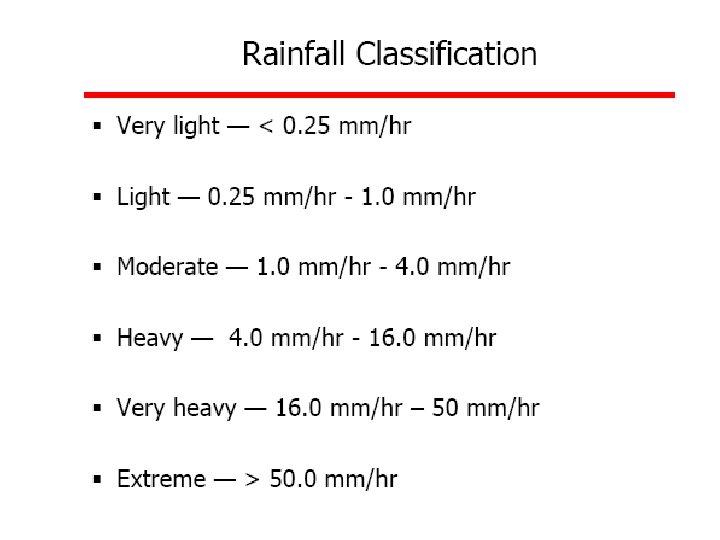
Precipitation
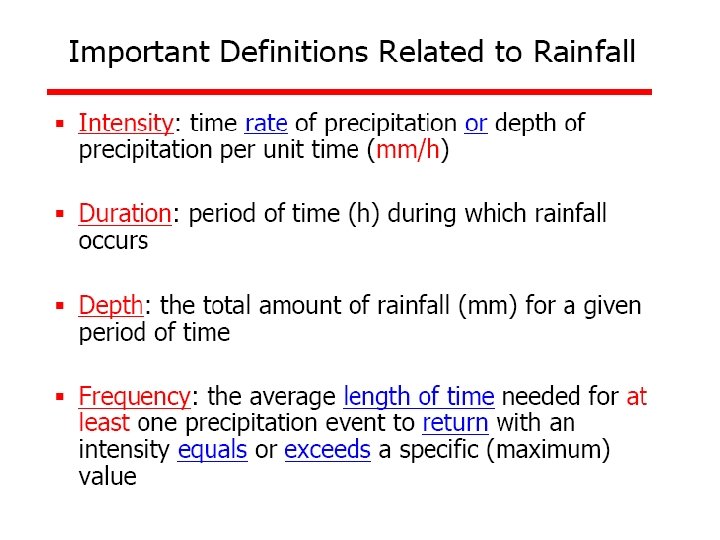
Forms of Precipitation is all forms of water that reach the earth from atmosphere Common forms of precipitation are: Rain : the term rainfall is used to describe precipitations in the forms of water drops of sizes larger than 0. 5 mm. Snow : another important form of precipitation. It consists of ice crystals which usually combine to form flakes.
Forms of Precipitation Drizzle : fine water droplets of size less than 0. 5 mm. the drops are so small that they appear to float in the air. Glaze : when rain or drizzle comes in contact with cold ground at around 00 C, the water drops freeze to form an ice coating called glaze or freezing rain. Hail : it is showery precipitation in the form of irrigular lumps of ice of size more than 8 mm. occurred in violent thunderstorms.
Rainfall Measurement Why do we need to measure rainfall? Engineers - to design structures for runoff control i. e. stormwater drains, bridges etc.
What if you need to know the rainfall in a catchment? • Measure it yourself…. – Type of rain gauges? – Where to put gauges? – How many gauges? – How do you map it?
Methods of Measuring Rainfall: Manual • Often have a funnel opening into a cylinder gauge. • Come in a variety of shapes and sizes • Calculate the rainfall (in mm) by dividing the volume of water collected by the area of the opening of the cup. (The gauge marking often accounts for this).
Methods of Measuring Rainfall: Remote • Tipping bucket rain gauge -The bucket tips when precipitation of 0. 2 mm, 0. 5 mm, 1. 0 mm has been collected. Each tip is recorded by a data logger. • Weather Station - Records rainfall, but also evaporation, air pressure, air temperature, wind speed and wind direction (so can be used to estimate evapo-transpiration) • Radar - Ground-based radar equipment can be used to determine how much rain is falling and where it is the heaviest.
Number and Distribution of Gauges Need to consider: • size of area • prevailing storm type • form of precipitation • topography • aspect • season
Distribution of Gauges • The distribution of gauges should not be random. – only fixed characteristics of areas can be sampled randomly. Random events must be sampled by a systematic arrangement of sampling points • Practical considerations of access and exposure mean that some pragmatism is required in designing a network. – It is useful to locate gauges so that isohyetal maps can be drawn. Some gauges need to be near, or outside the catchment boundary in order to cover the catchment completely.
Number of Gauges Depends on Storm type • Cyclonic storms (large areas, low intensities) -small number of gauges may be O. K. • Convective storms (local, intense, uneven distribution) -denser network needed. Convective storms may have seasonal dominance -need to consider this as well. • Orographic rainfall due to mountains (not fronts) -may need denser network than flatter area.
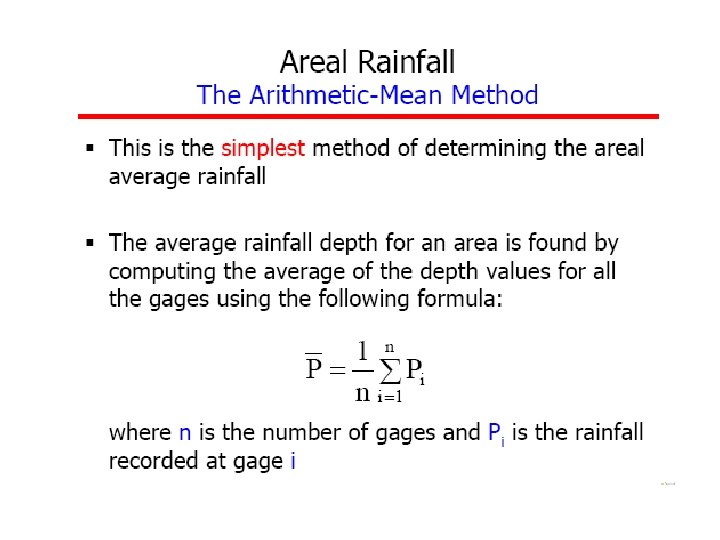
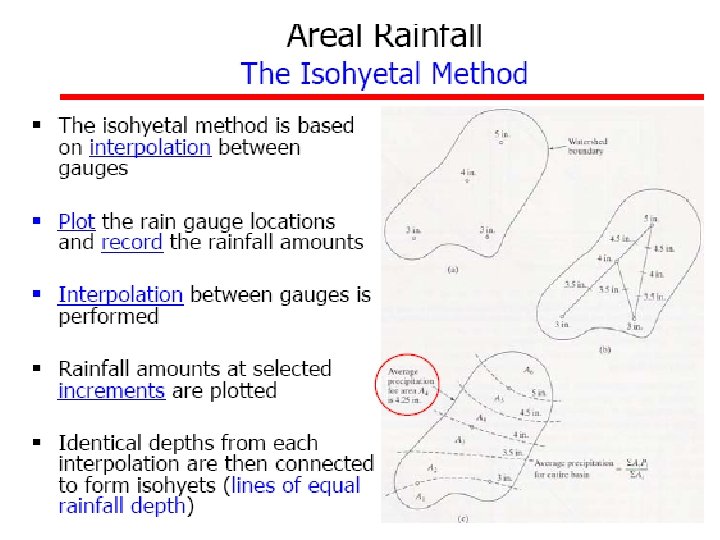
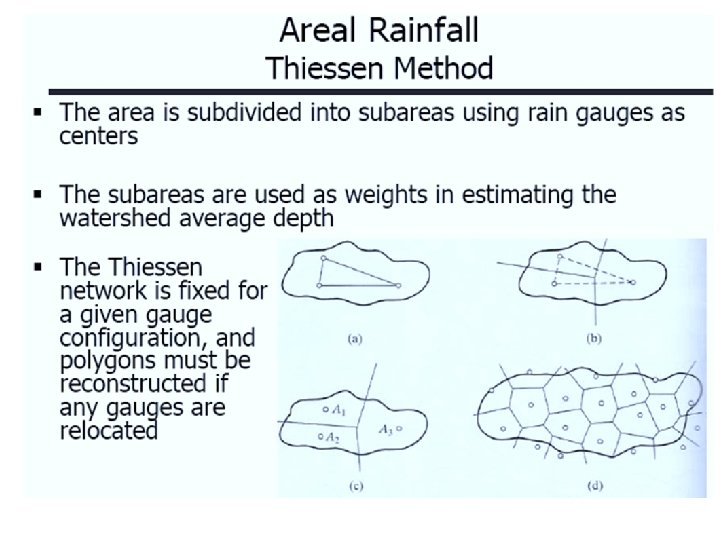
Methods of Computing a Rainfall • Arithmetic average • Theissen polygons • Isohyetal method Although, most of these calculations are done with computer mapping programs, it is still useful to understand these methods.
Example : Estimate the mean precipitation for the catchment area were tabulated as below: Solution :
Example 7: for the catchment shown below, If the rainfall depths recorded by Gauge A, B and C are 10 mm, 8 mm, 7 mm and the corresponding areas are 2. 1 km 2, 9. 1 km 2 and 2. 4 km 2, estimate the catchment average rainfall depth and the total volume of water from this rainfall event. Apply Thiessen Method of Analysis.
Solution :
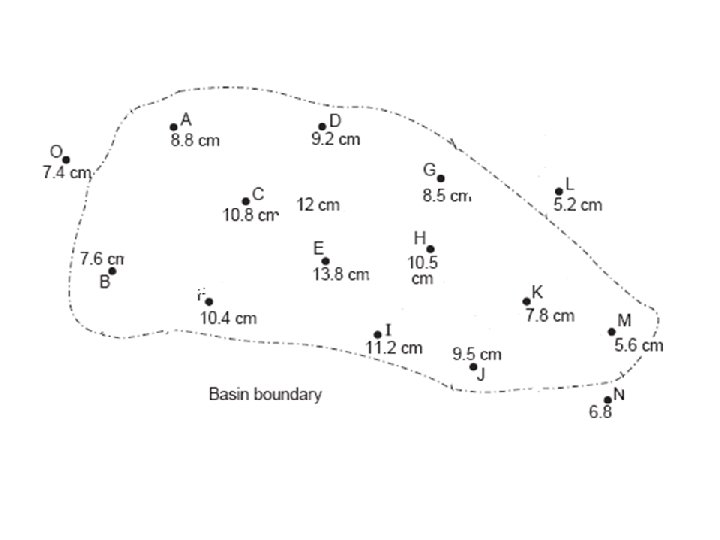
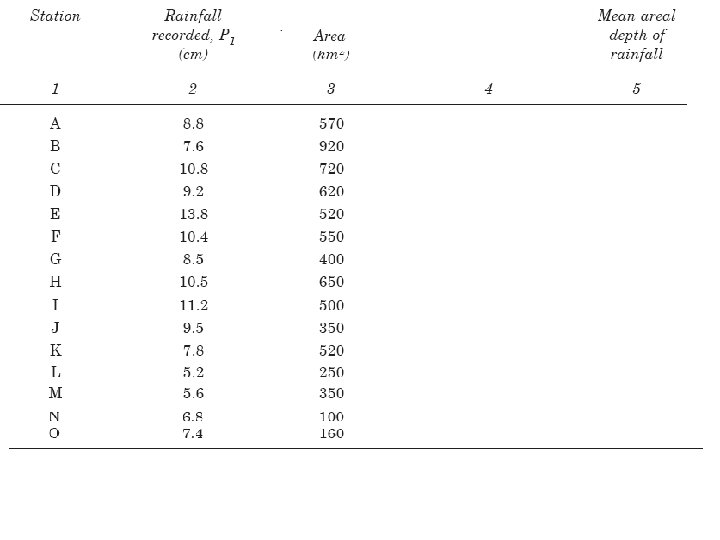
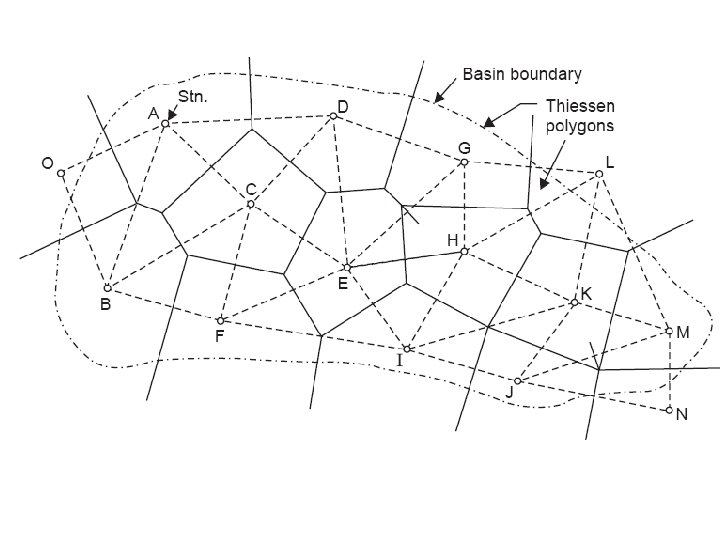
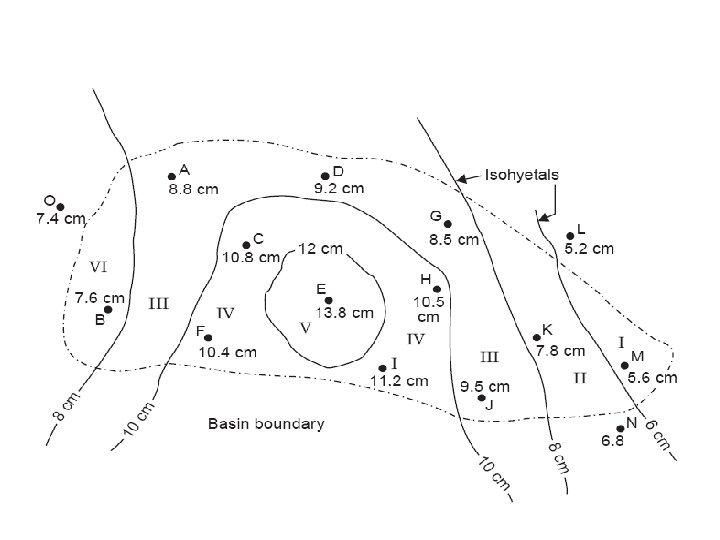
Ex 8: pound rainfalls due to a storm at several raingauge stations in a basin are shown in Figure below. Determine the mean areal depth of rainfall over the basin by the three methods.
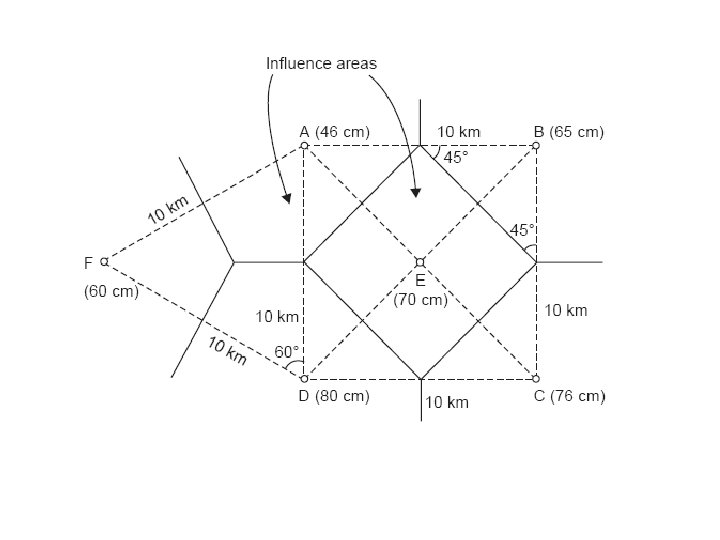
Assignment 2 1 -The area shown in Figure below is composed of a square plus an equilateral triangular plot of side 10 km. The annual precipitations at the rain-gauge stations located at the four corners and centre of the square plot and apex of the triangular plot are indicated in figure. Find the mean precipitation over the area by Thiessen polygon method, and compare with the arithmetic mean method.
Assignment 2 2 - The figures below show the spatial distribution of rainfall stations in Faria Catchment along with the long-term annual rainfall depth. You need to find out the average rainfall in the catchment and the total rainfall volume using a. The arithmetic-mean method b. Thiessen method c. Isohyetal method
Name Rain (mm) Area (km 2) Tammun 322. 3 49 Nablus 642. 6 36 Beit Dajan 379. 1 75 Al Faria 198. 6 100 Tubas 415. 2 19 Talluza 630. 5 52
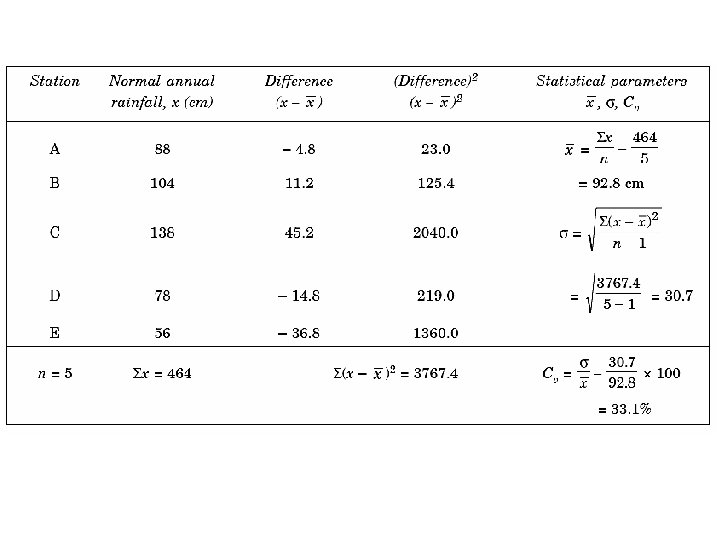
Optimum Rain Gauge Network Design Where : N: optimum number of rain gauge station to be establish in the basin Cp: coefficient of variation of the rainfall of the existing rain gauge stations P: desired degree of percentage error in the estimate of the average depth of rainfall over the basin
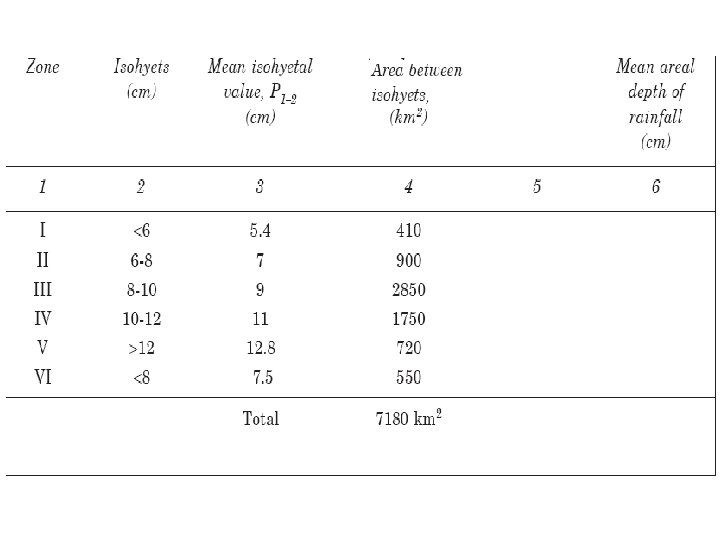
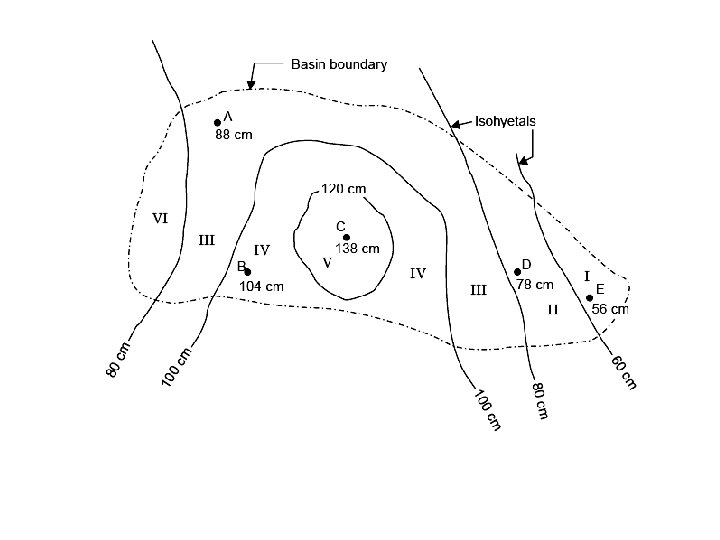
Ex 9: for the basin shown below, the normal annual rainfall depths recorded and the isohyetals are given. Determine the optimum number of rain gauge stations to be established in the basin if it is desired to limit the error in the mean value of rainfall to 10%. Indicate how you are going to distribute the additional rain gauge stations required, if any. What is the percentage accuracy of the existing network in the estimation of the average depth of rainfall over the basin?
Thus additional rain gauge stations to be established = N -n=11 -5=6 The additional six rain gauge stations have to be distributed in proportion to the areas between the isohytals as shown below:
The percentage error P in the estimation of average depth of rainfall in the existing network: : The percentage accuracy = 85. 2%
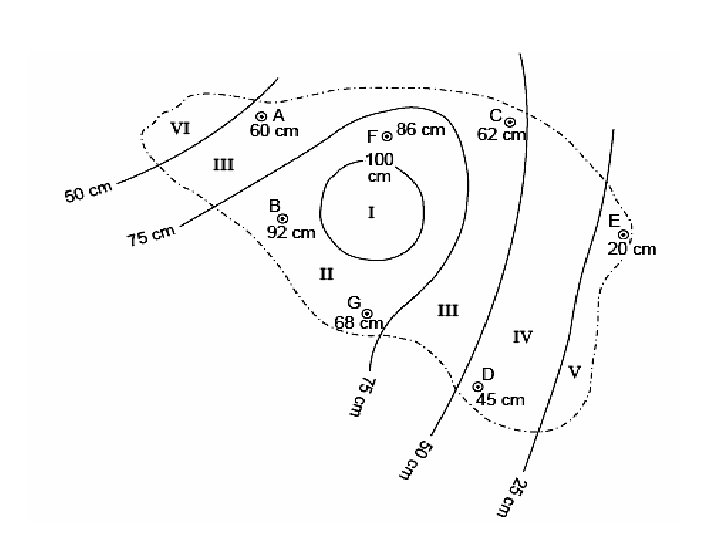
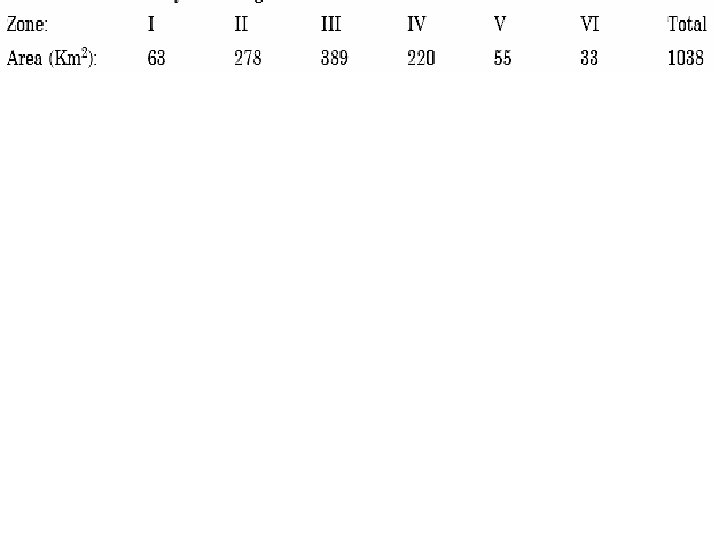
Ex 10: For the basin shown in Figure below, the normal annual rainfall depths recorded and the isohyetals are given. Determine the optimum number of raingauge stations to be established in the basin if it is desired to limit the error in the mean value of rainfall to 10%. Indicate how you are going to distribute the additional rain-gauge stations required if any. What is the percentage accuracy
CIVL 341 HYDROLOGY INFILTRATION
Definition • It is a process of water penetrating from the ground surface into the ground
FACTORS THAT INFLUENCE INFILTRATION RATE ARE: • Condition of soil surface and it’s vegetative cover a) b) c) • The properties of soil (such as porosity, hydraulic conductivity, moisture content etc. ) • Hydraulic conductivity is the ability of soil to allow water to flow through it (silt has high H. C, clay has low H. C) • Sometimes several layers of soils with different properties lay on top of each other. This spatial variation (changes in space-different type of soil) and time variation (changes in time- in form of moisture content) make calculation of infiltration rate very hard)
The distribution of soil moisture within soil profile during the downward movement water is as below. Depending on the amount of infiltration and physical properties of soil, the wetting front may be from a few inches to several feet into the soil.
INFILTRATION RATE Infiltration rate f (in/hr or mm/hr) is the rate at which water enter the soil at the surface. Cumulative infiltration F is the accumulated depth of water infiltrated during given time period
Method to calculate infiltration Horton’s Equation Phillip’s Equation
HORTON’S EQUATION f(t) = fc + (f 0 – fc) e-kt - Infiltration start at rate f 0 and exponentially decreases until it reaches constent rate fc - k f 0 fc f(t) - = delay constant = initial infiltration = constant infiltration = infiltration rate
PHILLIP’S EQUATION F(t) = St 1/2 + Kt Where S is a parameter called sorptivity, which is a function of the soil suction potential, and K is the hydraulic conductivity By differentiation f(t) = ½ St-1/2 + K SEE EXAMPLE 4. 2. 1
EXAMPLE 4. 2. 1 A small tube with a cross=sectional area of 40 cm 2 is filled with soil and laid horizontally. The open end of the tube is saturated, and after 15 minutes, 100 cm 3 of water have filtrated into the tube. If the saturated hydraulic conductivity of the soil is 0. 4 cm/h, how much infiltration would have taken place in 30 minutes if the soil column had initially been placed upright with its upper surface saturated.
MEASUREMENT OF INFILTRATION Rainfall simulator Flooding infiltrometer Hydrograph analysis 3 methods to determine infiltration rate
Why it is important to get infiltration rate of soil?
Rain that fall in watershed will flow on the ground, into river and discharged out downstream. Some of the water will infiltrate into ground and this reduce surface runoff. In soil in watershed is mostly sand, infiltration rate will be high and surface runoff will be low. This allow us to make optimum design of drainage facilities Example: i. how big and wider river need to be i. Allowable obstruction to water flow by briges.
Estimation of Infiltration Rate Ex 11: The initial infiltration capacity fo of a catchment is estimated as 4. 5 mm/hr, the time constant as 0. 35 /hour, and capacity fc as 0. 4 mm/hour. Apply Horton's equation to find the following: a) The value ft at t=10 min, 30 min, 1 hr, 2 hr and 6 hr. b) The total volume of infiltration over the 6 hours period. Assume continuously ponded conditions
Example 12 Suppose that the parameters for Horton’s equation are fo=3. 5 mm/hr, fc=0. 6 mm/hr and k=4. 1 hr-1. Determine the infiltration rates after 0, 10 min, 20 min, 1 hr, 1. 5 hr and 2 hr and the cumulative infiltration after 2 hours. Assume continuously ponded conditions.